Print this worksheet, or choose "Save as PDF" in the print window to share a file.
Chart worksheet
Charts to read and discuss
Name:
Class:
Date:
Chart 1 of 3 · World
How long do people around the world live, and how has that changed since 1960?
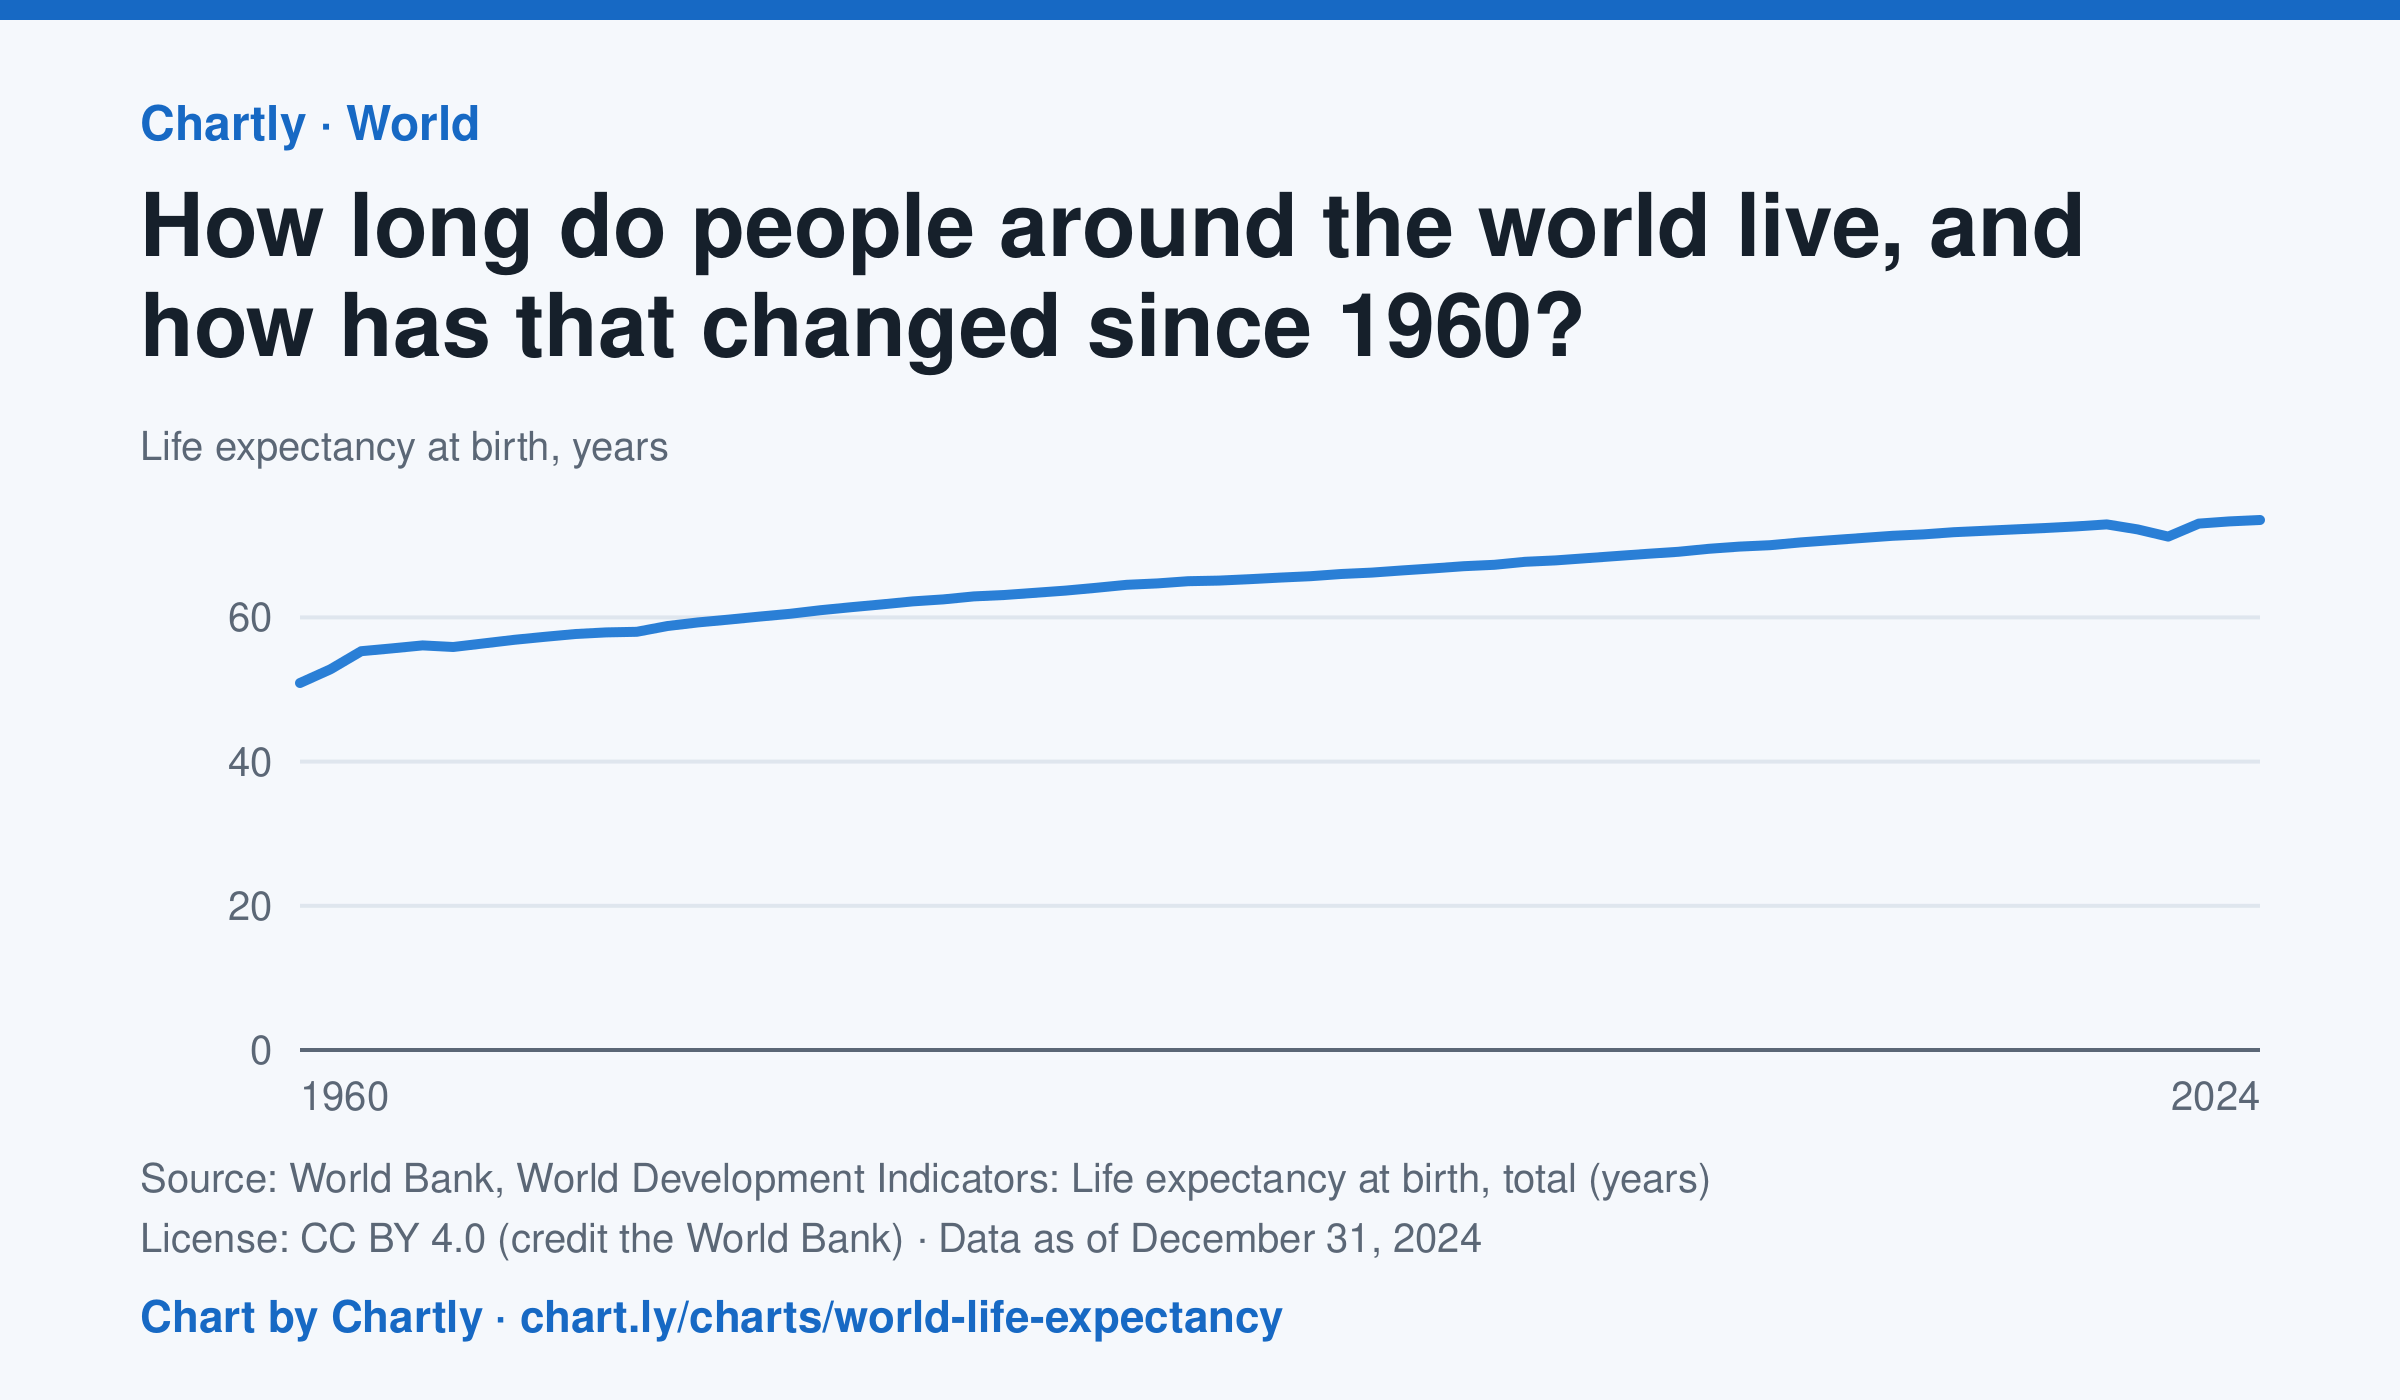
A baby born in 2024 could expect to live 73.5 years on average across the world, up from 50.9 in 1960. The very low early-1960s figures include the famine in China. Life expectancy fell to 71.2 years in 2021, during the COVID-19 pandemic, then recovered. These are United Nations estimates.
Source: World Bank, World Development Indicators: Life expectancy at birth, total (years) (CC BY 4.0 (credit the World Bank)) · Data as of Dec 31, 2024
How to read this chart
Each point is how long a baby born that year could expect to live, on average, across the whole world, if death rates stayed as they were. Because it averages every country, it rises when poorer countries cut deaths of babies and young children. The World Bank publishes the numbers.
Questions
- How many years did world life expectancy rise between the first year on the chart and the newest?
- Find a year when the line dipped. What happened in the world then?
- Compare this chart with the U.S. life expectancy lesson. Why might the world's average have risen faster?
Chart and numbers: chart.ly/charts/world-life-expectancy · More free charts at chart.ly
Chart 2 of 3 · Health
How many Americans die of drug overdoses each year?
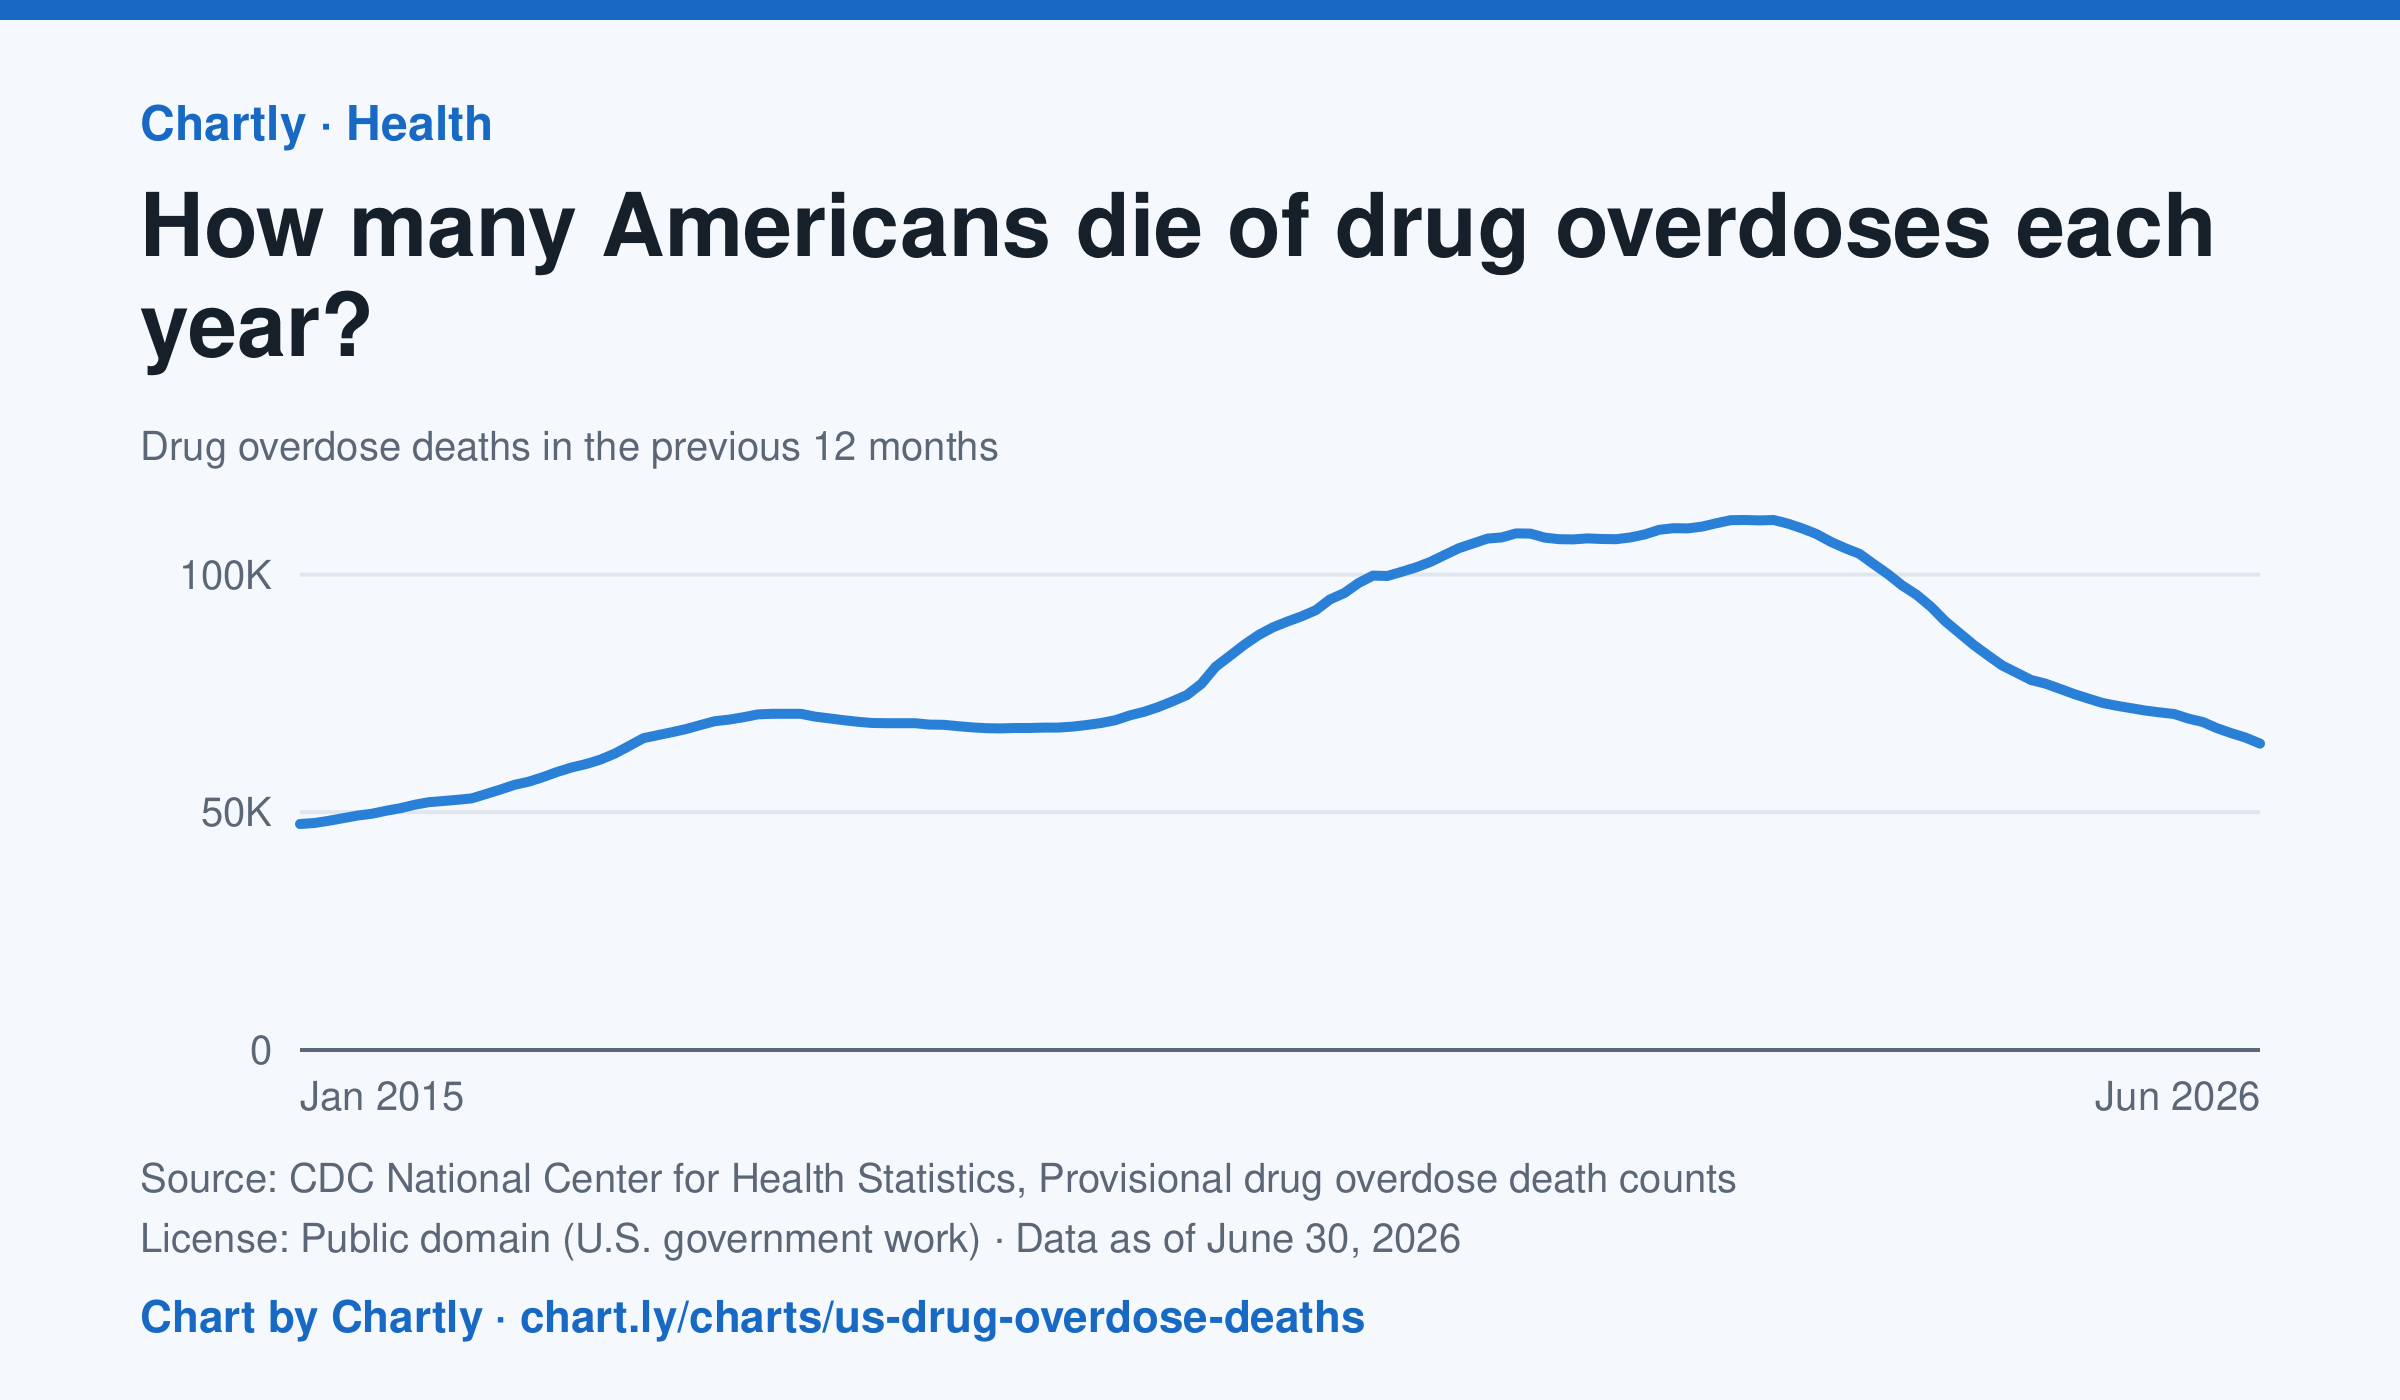
64,433 people died of drug overdoses in the US in the 12 months ending June 2026, about 42% fewer than at the peak of about 111,500 in the 12 months ending June 2023. The counts are provisional: the latest months are slightly undercounted while some causes of death are still being investigated. CDC's provisional counts start with the 12 months ending January 2015.
Source: CDC National Center for Health Statistics, Provisional drug overdose death counts (Public domain (U.S. government work)) · Data as of Jun 30, 2026
How to read this chart
Each point counts the people who died of a drug overdose in the 12 months ending that month, so each point covers a whole year. Using 12-month totals smooths out busy and quiet months. The newest months are provisional: the count rises as death investigations are finished.
Questions
- When were overdose deaths highest on the chart, and how has the number changed since then?
- Why does each point add up 12 months instead of showing just one month?
- Newer numbers can rise later as investigations finish. How should that change the way you read the newest points?
Chart and numbers: chart.ly/charts/us-drug-overdose-deaths · More free charts at chart.ly
Chart 3 of 3 · Climate
How much has the US warmed since 1895?
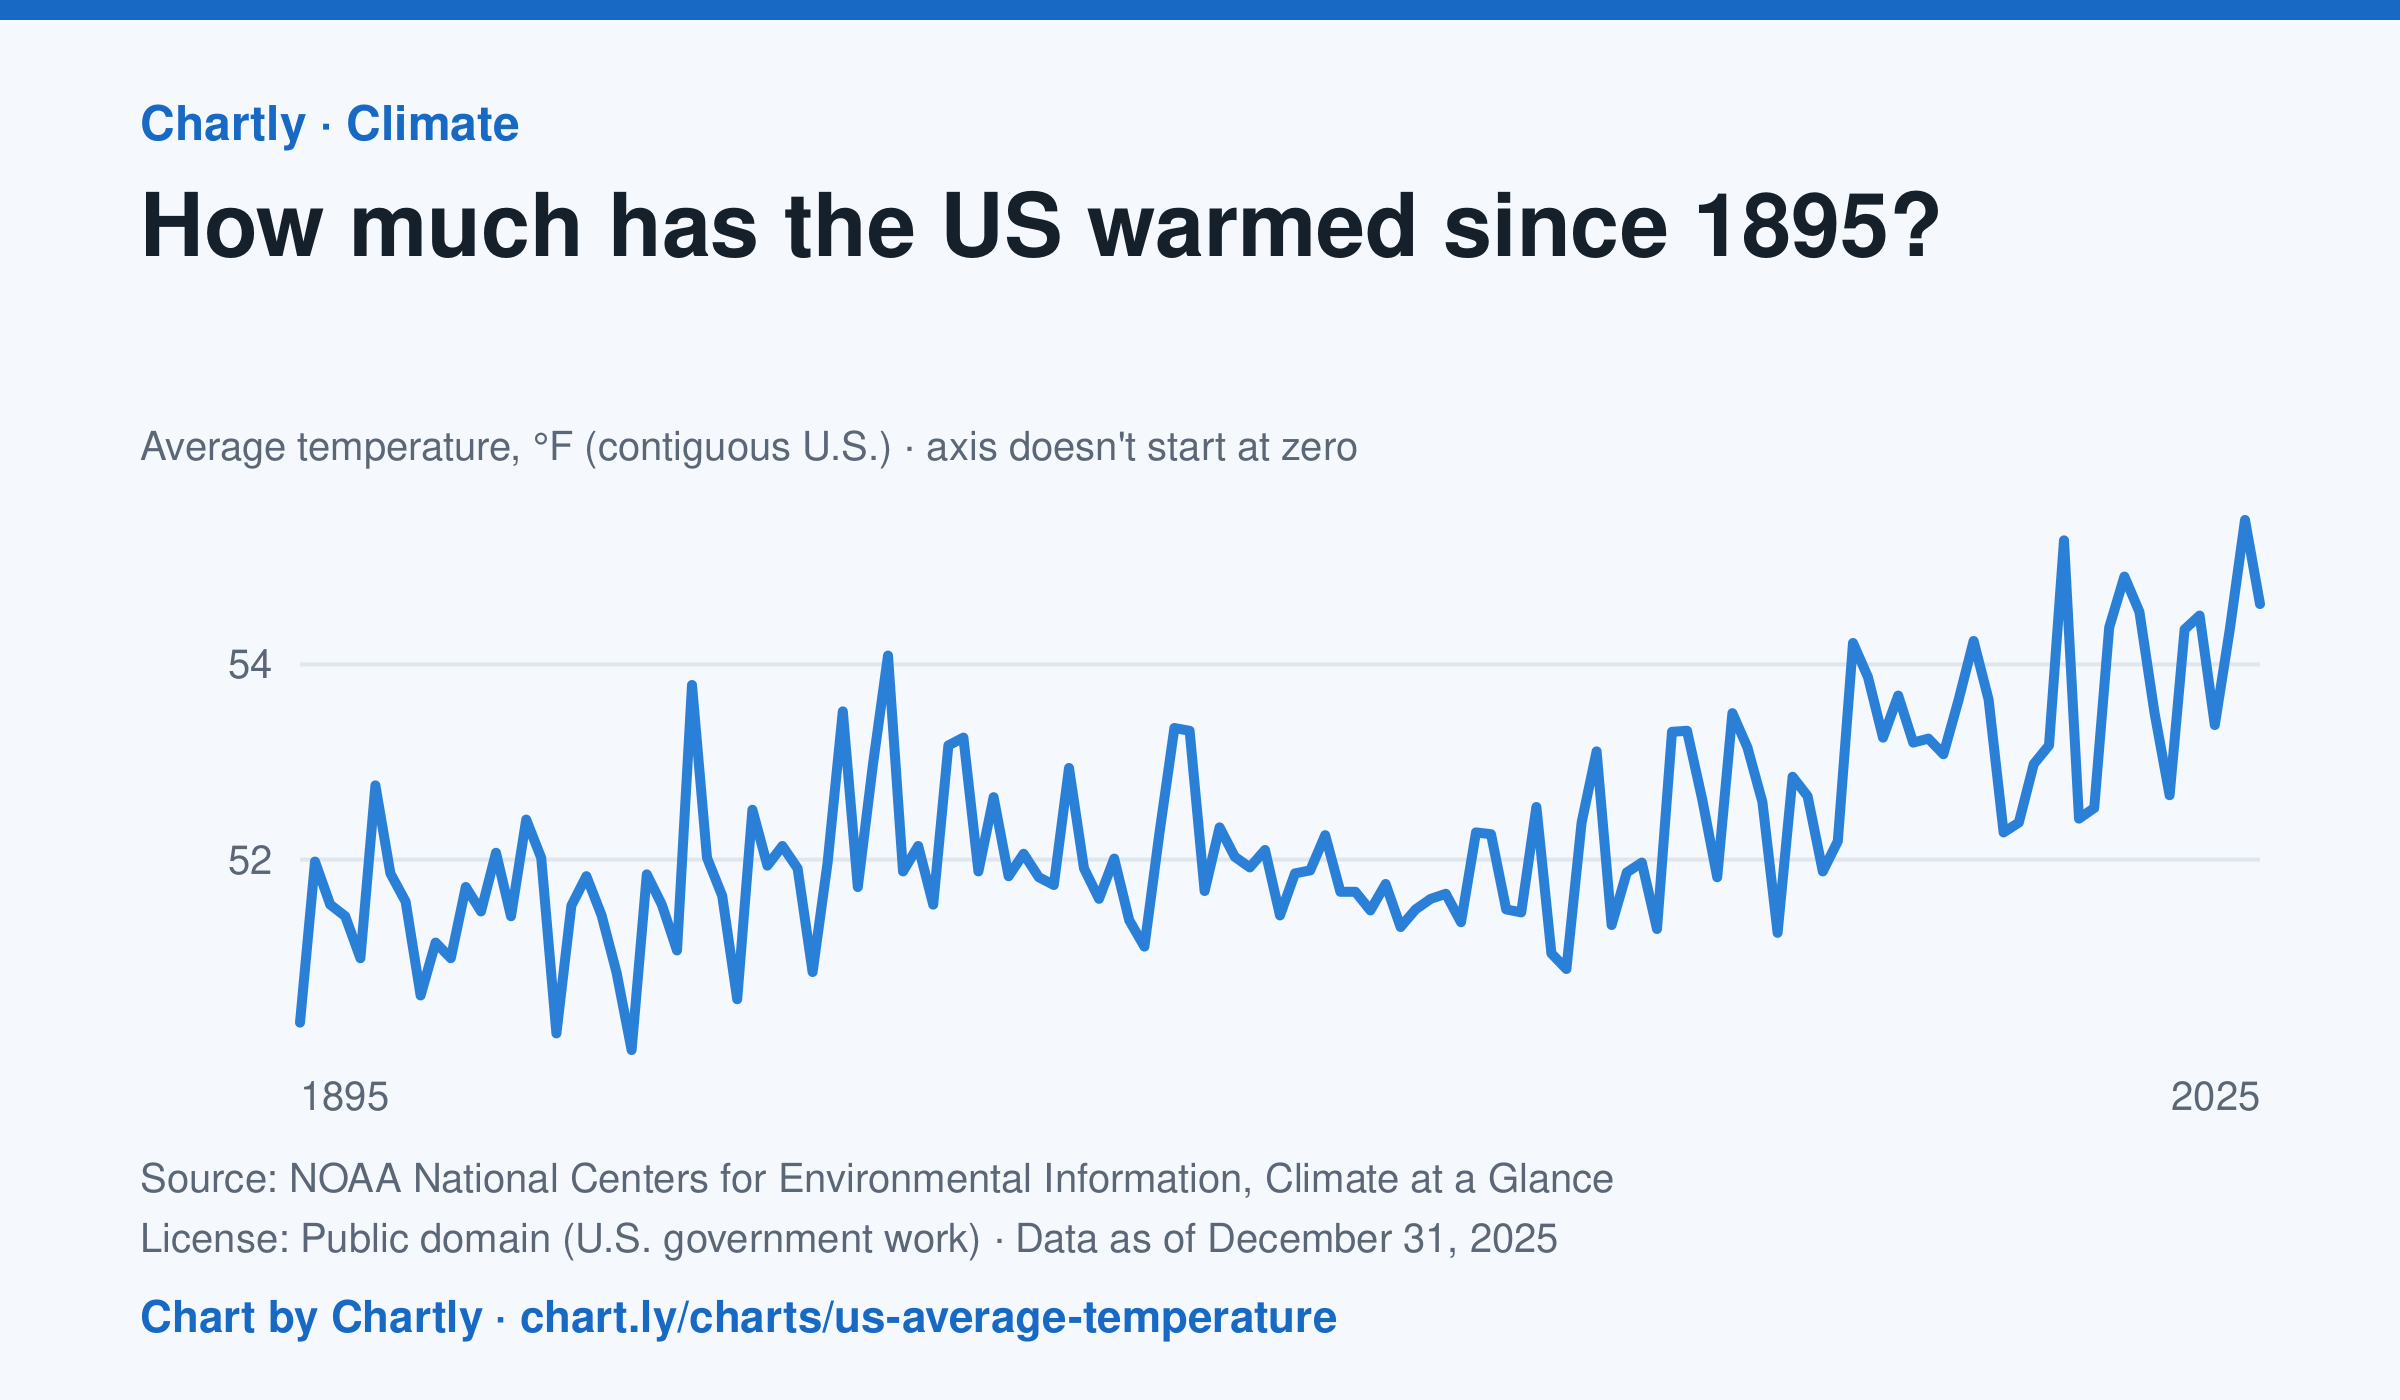
The contiguous US averaged 54.6°F in 2025. The warmest year since records began in 1895 was 2024, at 55.5°F. Through 2025, the dashed trend line, the straight line that best fits every year, rose about 0.18°F a decade, or 2.3°F since 1895, and warming had sped up to about 0.5°F a decade since 1970. Alaska and Hawaii aren't included.
Source: NOAA National Centers for Environmental Information, Climate at a Glance (Public domain (U.S. government work)) · Data as of Dec 31, 2025
How to read this chart
Each point is one year's average temperature across the lower 48 states, in degrees Fahrenheit. The axis doesn't start at zero, so a small rise looks steep: read the numbers on the axis, not the height of the line. The dashed line is the trend, the straight line that best fits every year; single years bounce above and below it.
Questions
- Find the warmest and coolest years on the chart. How many degrees apart are they?
- Why might one year be much cooler than the year before, even while the trend line keeps rising?
- The axis doesn't start at zero here, but bar charts always do. Why is that fair for temperatures but not for bars?
Chart and numbers: chart.ly/charts/us-average-temperature · More free charts at chart.ly