Print this worksheet, or choose "Save as PDF" in the print window to share a file.
Chart worksheet
Charts to read and discuss
Name:
Class:
Date:
Chart 1 of 2 · World
How fast has the world come online?
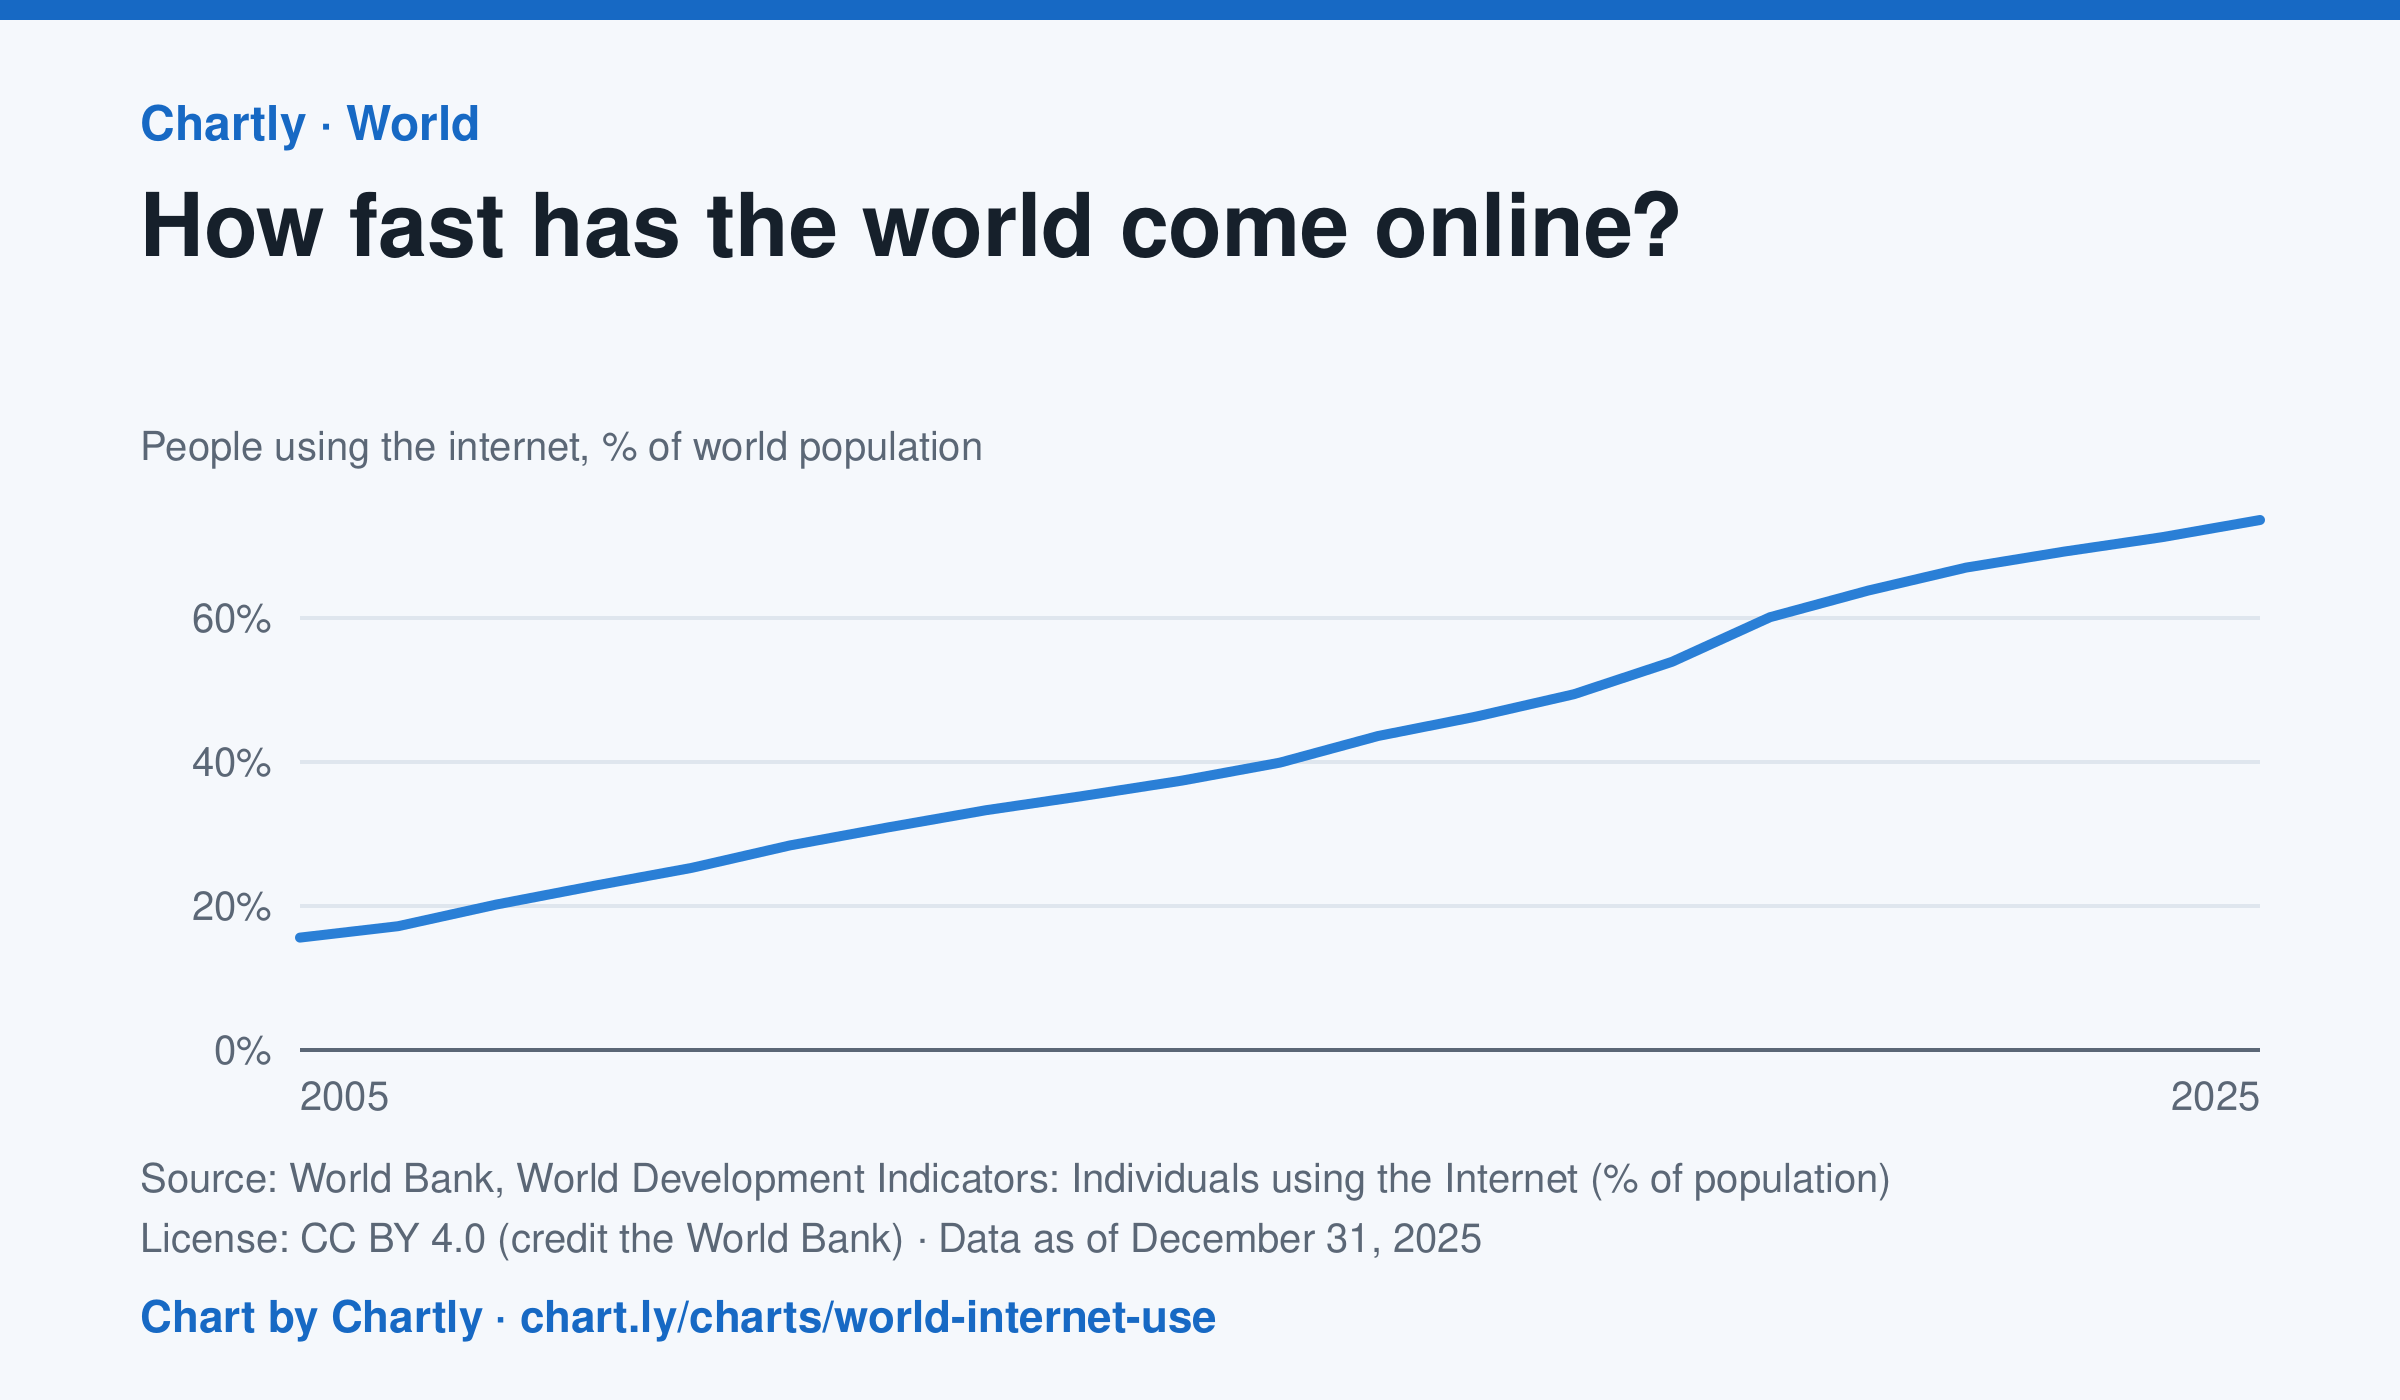
73.6% of the world's people used the internet in 2025, up from 15.6% in 2005, the first year the World Bank gives a world figure. It counts people who used the internet at least once in the previous three months. The world figures are estimates by the International Telecommunication Union.
Source: World Bank, World Development Indicators: Individuals using the Internet (% of population) (CC BY 4.0 (credit the World Bank)) · Data as of Dec 31, 2025
How to read this chart
Each point is the share of the world's people who used the internet at least once in the previous three months, as estimated by the International Telecommunication Union. The axis starts at zero, so the height shows the true share. The steeper the line, the faster people were coming online.
Questions
- About what share of the world was online in the first year on the chart, and in the latest year?
- Did the share grow faster in some years than others? What could have sped it up?
- Using the internet once in three months counts here. What does this number leave out about how people get online?
Chart and numbers: chart.ly/charts/world-internet-use · More free charts at chart.ly
Chart 2 of 2 · Jobs and wages
What is the US unemployment rate?
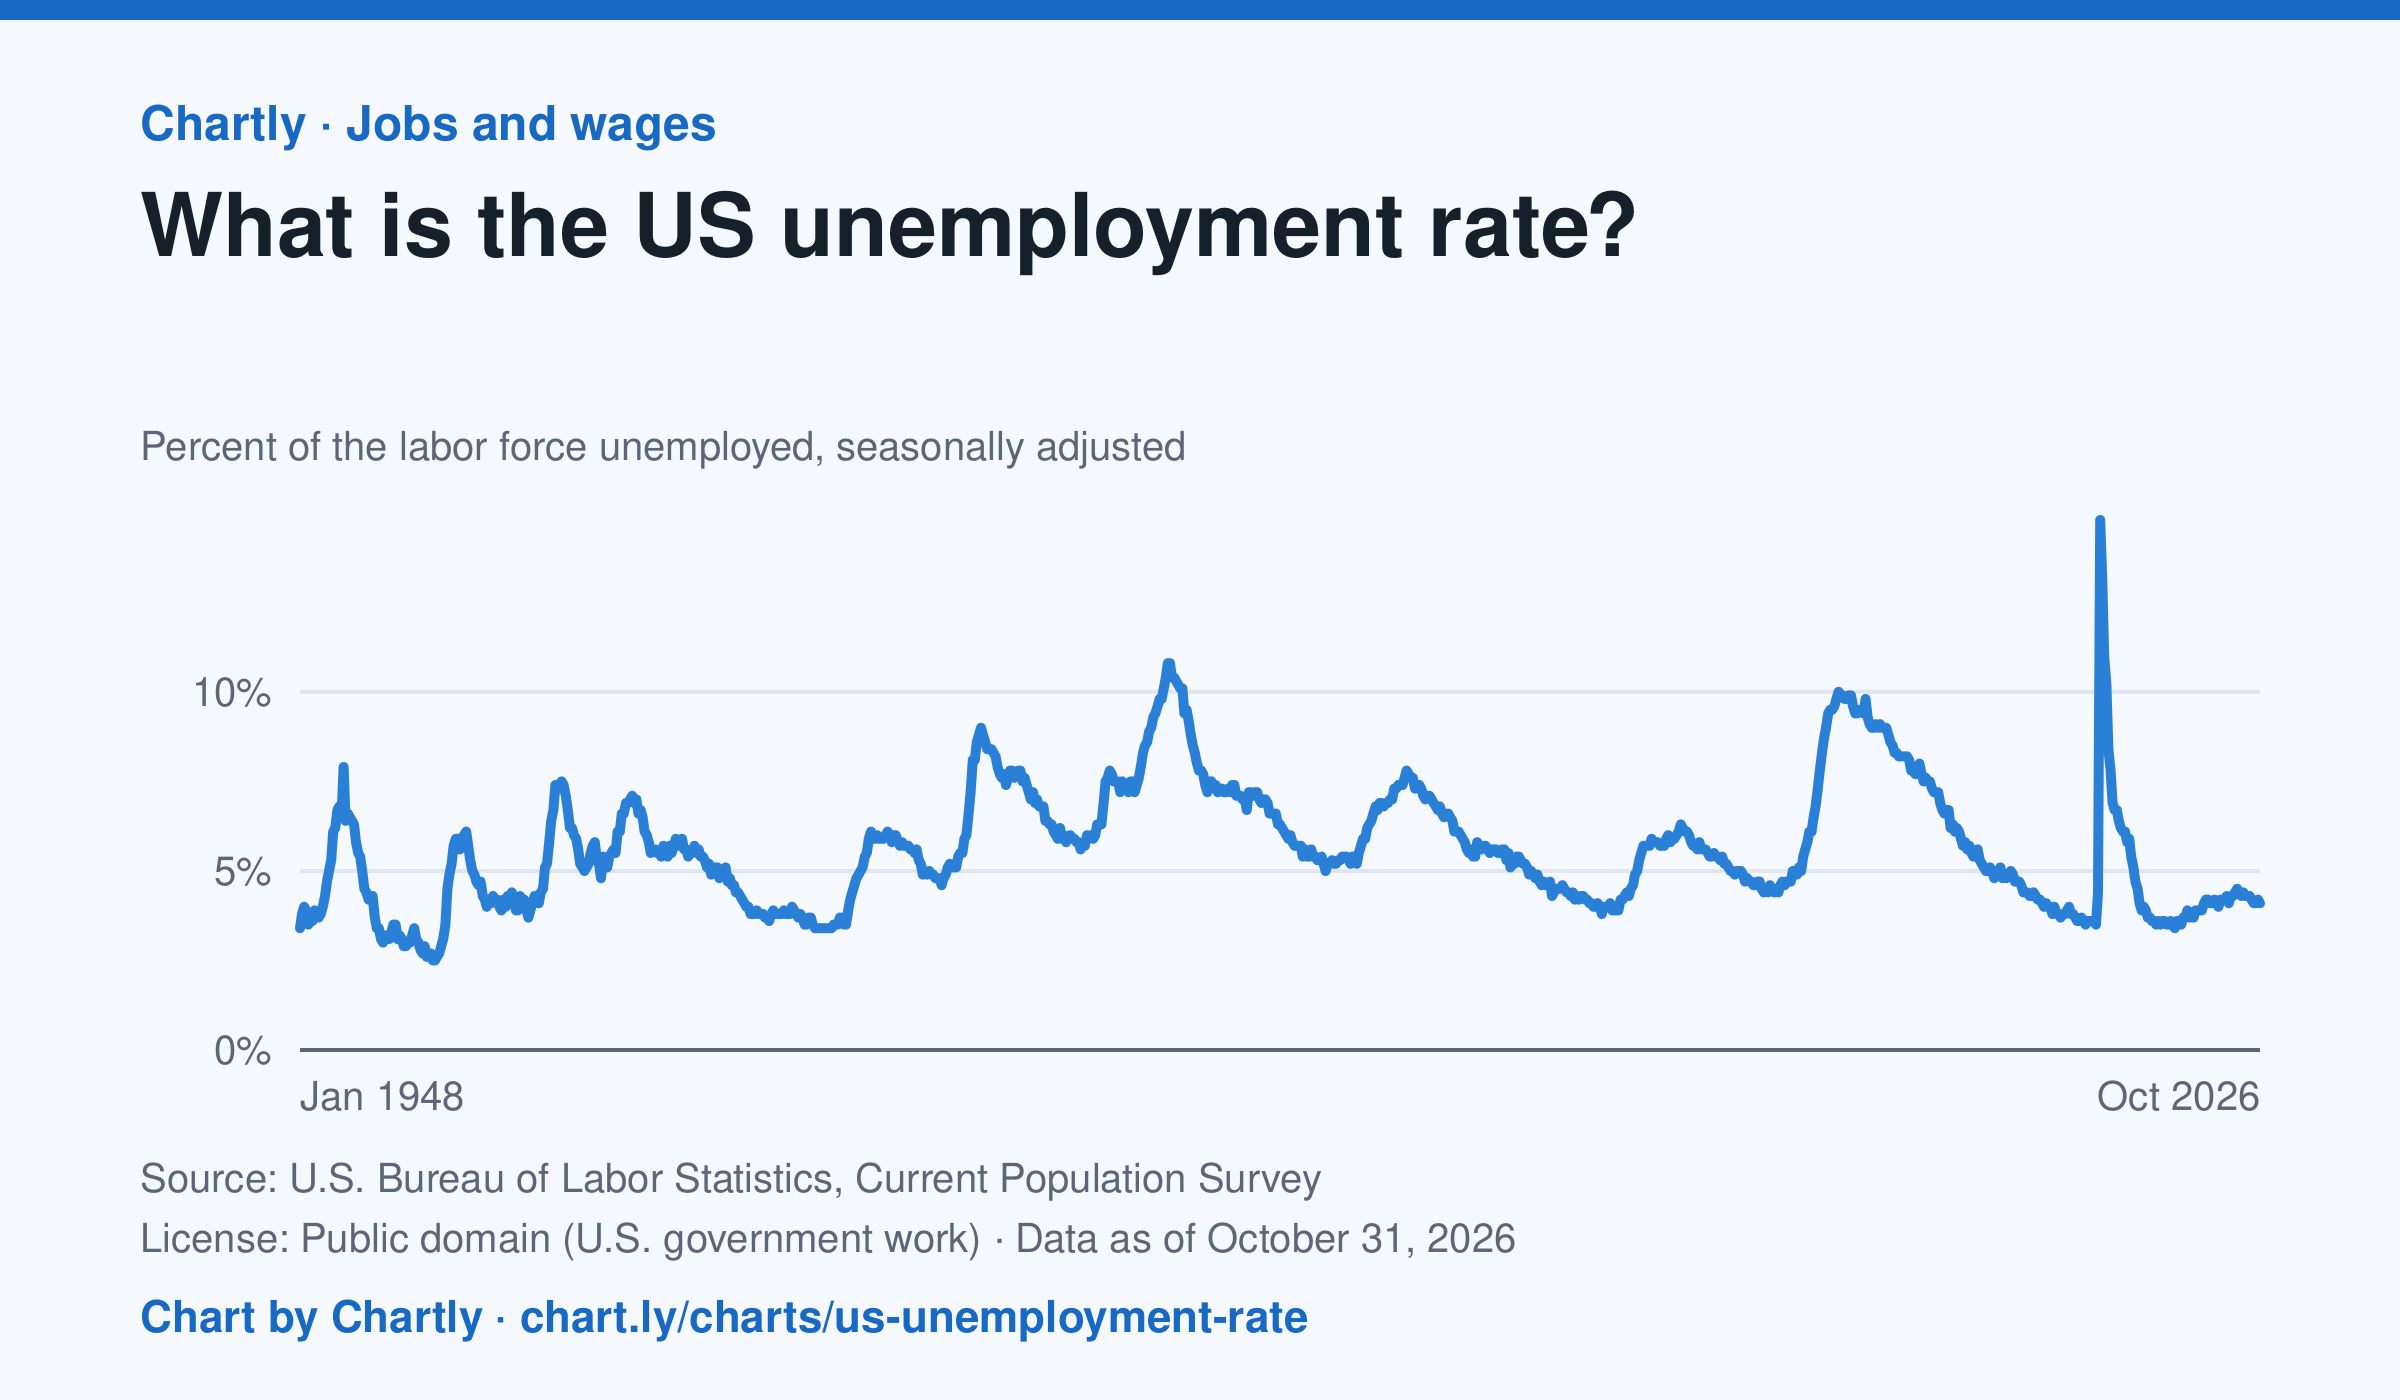
4.1% of the US labor force was unemployed in October 2026, against 4.4% in September 2025. Since the monthly rate began in 1948 it peaked at 14.8% in April 2020, at the start of the pandemic, and was lowest at 2.5% in May 1953. October 2025 is missing because a lapse in federal funding stopped the survey.
Source: U.S. Bureau of Labor Statistics, Current Population Survey (Public domain (U.S. government work)) · Data as of Oct 31, 2026
How to read this chart
Each point is the share of the labor force without a job in one month: people who have no work, are available and looked for a job in the past four weeks. People who aren't looking, such as retirees and most students, aren't in the labor force, so they don't count as unemployed. The numbers are seasonally adjusted, so the usual jump when school ends doesn't show up as bad news.
Questions
- Find the three highest peaks on the chart. What was happening in the economy at each one?
- How long did it take the rate to come back down after each peak? Was the recovery faster or slower than the rise?
- Someone who gives up looking for work stops counting as unemployed. How could that make the rate look better than things really are?
Chart and numbers: chart.ly/charts/us-unemployment-rate · More free charts at chart.ly