Print this worksheet, or choose "Save as PDF" in the print window to share a file.
Chart worksheet
Charts to read and discuss
Name:
Class:
Date:
Chart 1 of 2 · World
How fast has the world come online?
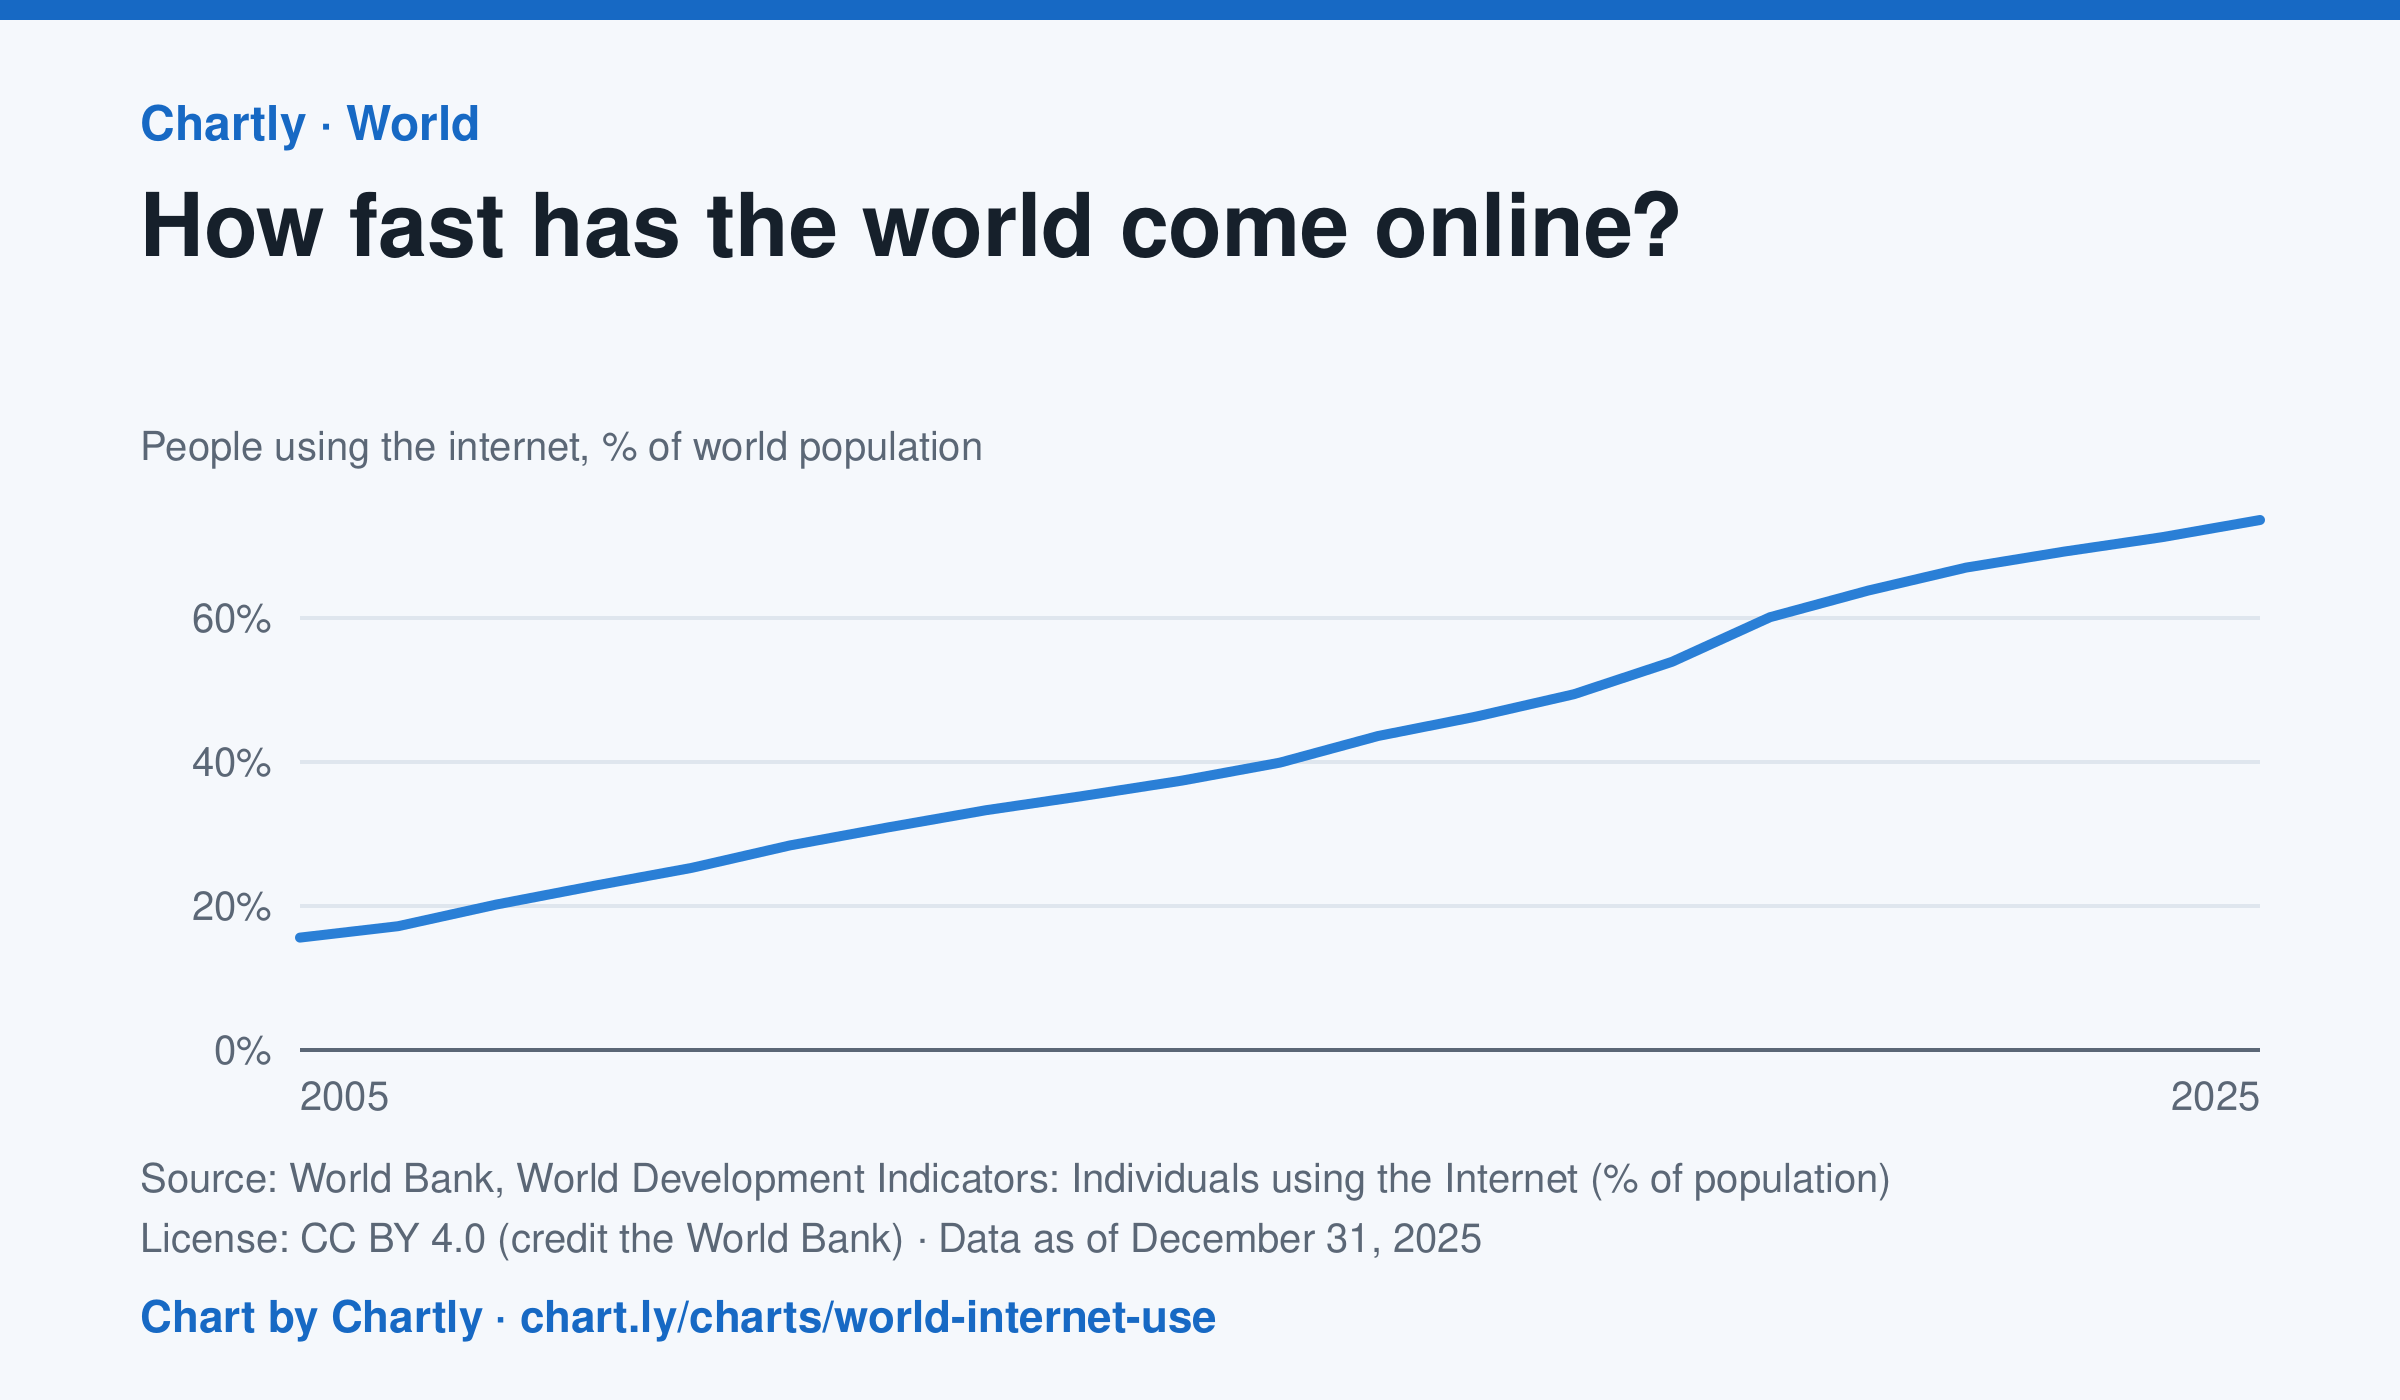
73.6% of the world's people used the internet in 2025, up from 15.6% in 2005, the first year the World Bank gives a world figure. It counts people who used the internet at least once in the previous three months. The world figures are estimates by the International Telecommunication Union.
Source: World Bank, World Development Indicators: Individuals using the Internet (% of population) (CC BY 4.0 (credit the World Bank)) · Data as of Dec 31, 2025
How to read this chart
Each point is the share of the world's people who used the internet at least once in the previous three months, as estimated by the International Telecommunication Union. The axis starts at zero, so the height shows the true share. The steeper the line, the faster people were coming online.
Questions
- About what share of the world was online in the first year on the chart, and in the latest year?
- Did the share grow faster in some years than others? What could have sped it up?
- Using the internet once in three months counts here. What does this number leave out about how people get online?
Chart and numbers: chart.ly/charts/world-internet-use · More free charts at chart.ly
Chart 2 of 2 · Federal budget
Where does federal spending go?
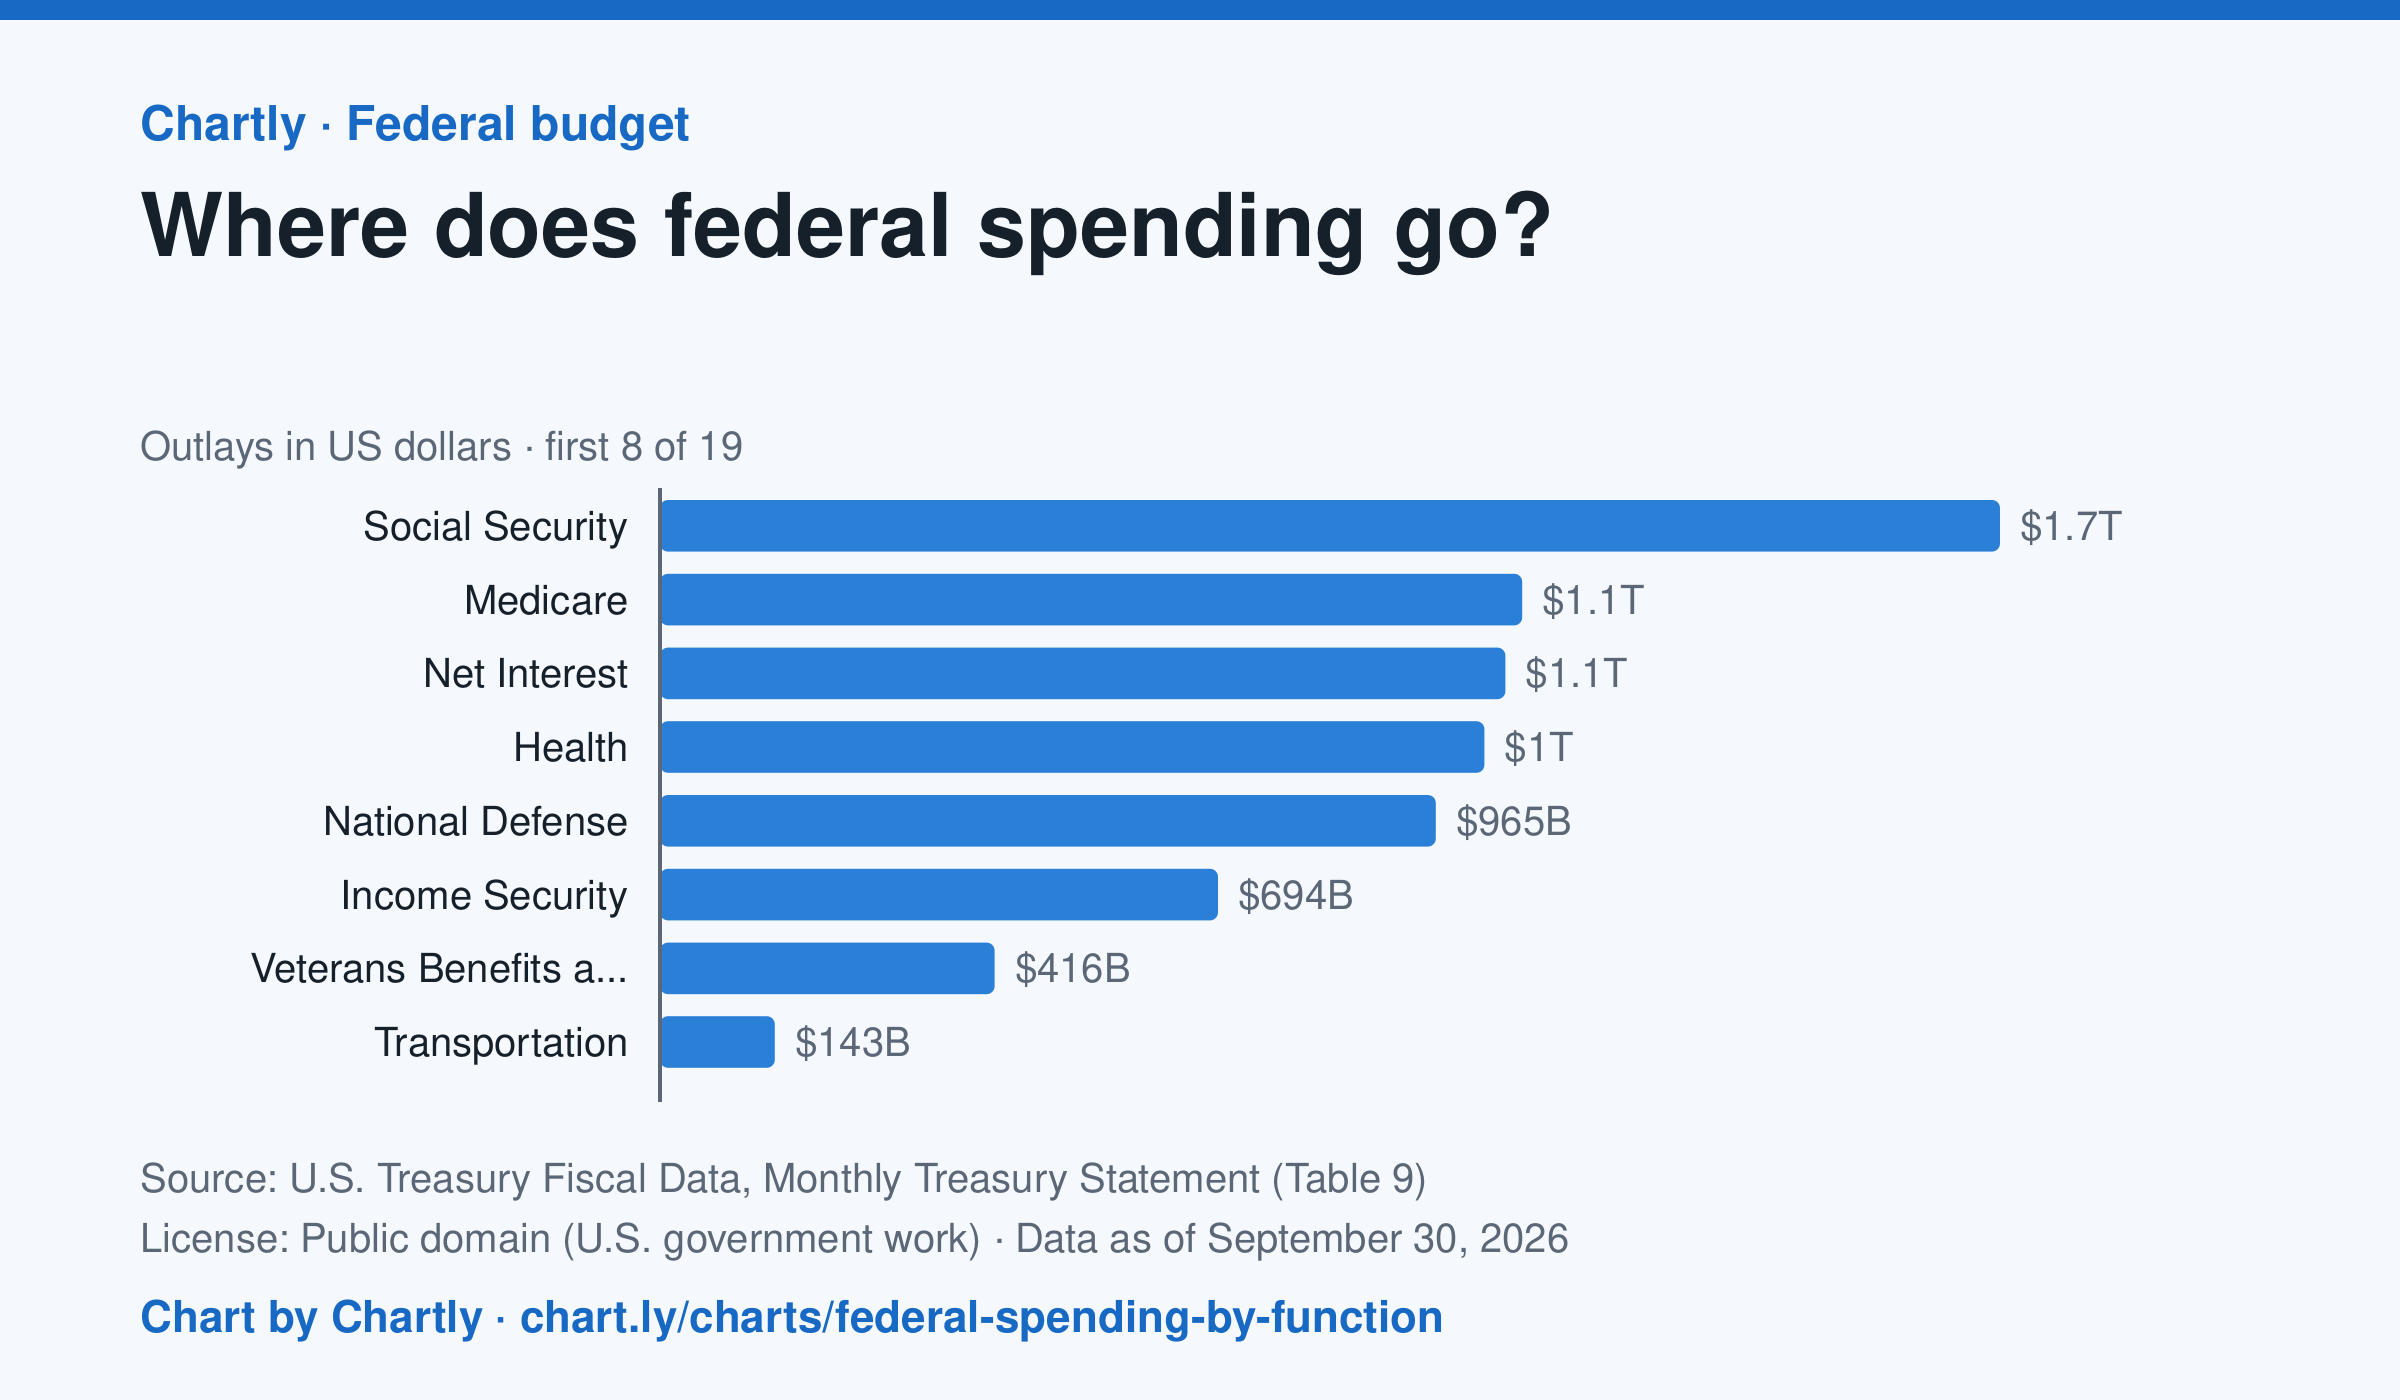
Social Security was the biggest item in fiscal 2026 at $1.67 trillion, out of $7.4 trillion in total. Next came Medicare ($1.07 trillion), Net Interest ($1.05 trillion), Health ($1.03 trillion) and National Defense ($965 billion). Two accounting lines are below zero, so the bars add up to the total.
Source: U.S. Treasury Fiscal Data, Monthly Treasury Statement (Table 9) (Public domain (U.S. government work)) · Data as of Sep 30, 2026
How to read this chart
Each bar is how much the federal government spent on one area in a fiscal year, which runs from October to September. The axis shows dollars: 1T is a trillion dollars, a thousand billion. One bar is below zero because it counts money the government takes back in, such as payments agencies make to each other, which lowers the total.
Questions
- Which area gets the most money? About how many times more than the smallest positive bar?
- Which of the biggest areas are paid to people directly, like retirees and patients, and which pay for services?
- If Congress wanted to cut spending by a lot, which bars would it have to change, and why is that hard?
Chart and numbers: chart.ly/charts/federal-spending-by-function · More free charts at chart.ly