Print this worksheet, or choose "Save as PDF" in the print window to share a file.
Chart worksheet
Charts to read and discuss
Name:
Class:
Date:
Chart 1 of 2 · World
How fast has the world come online?
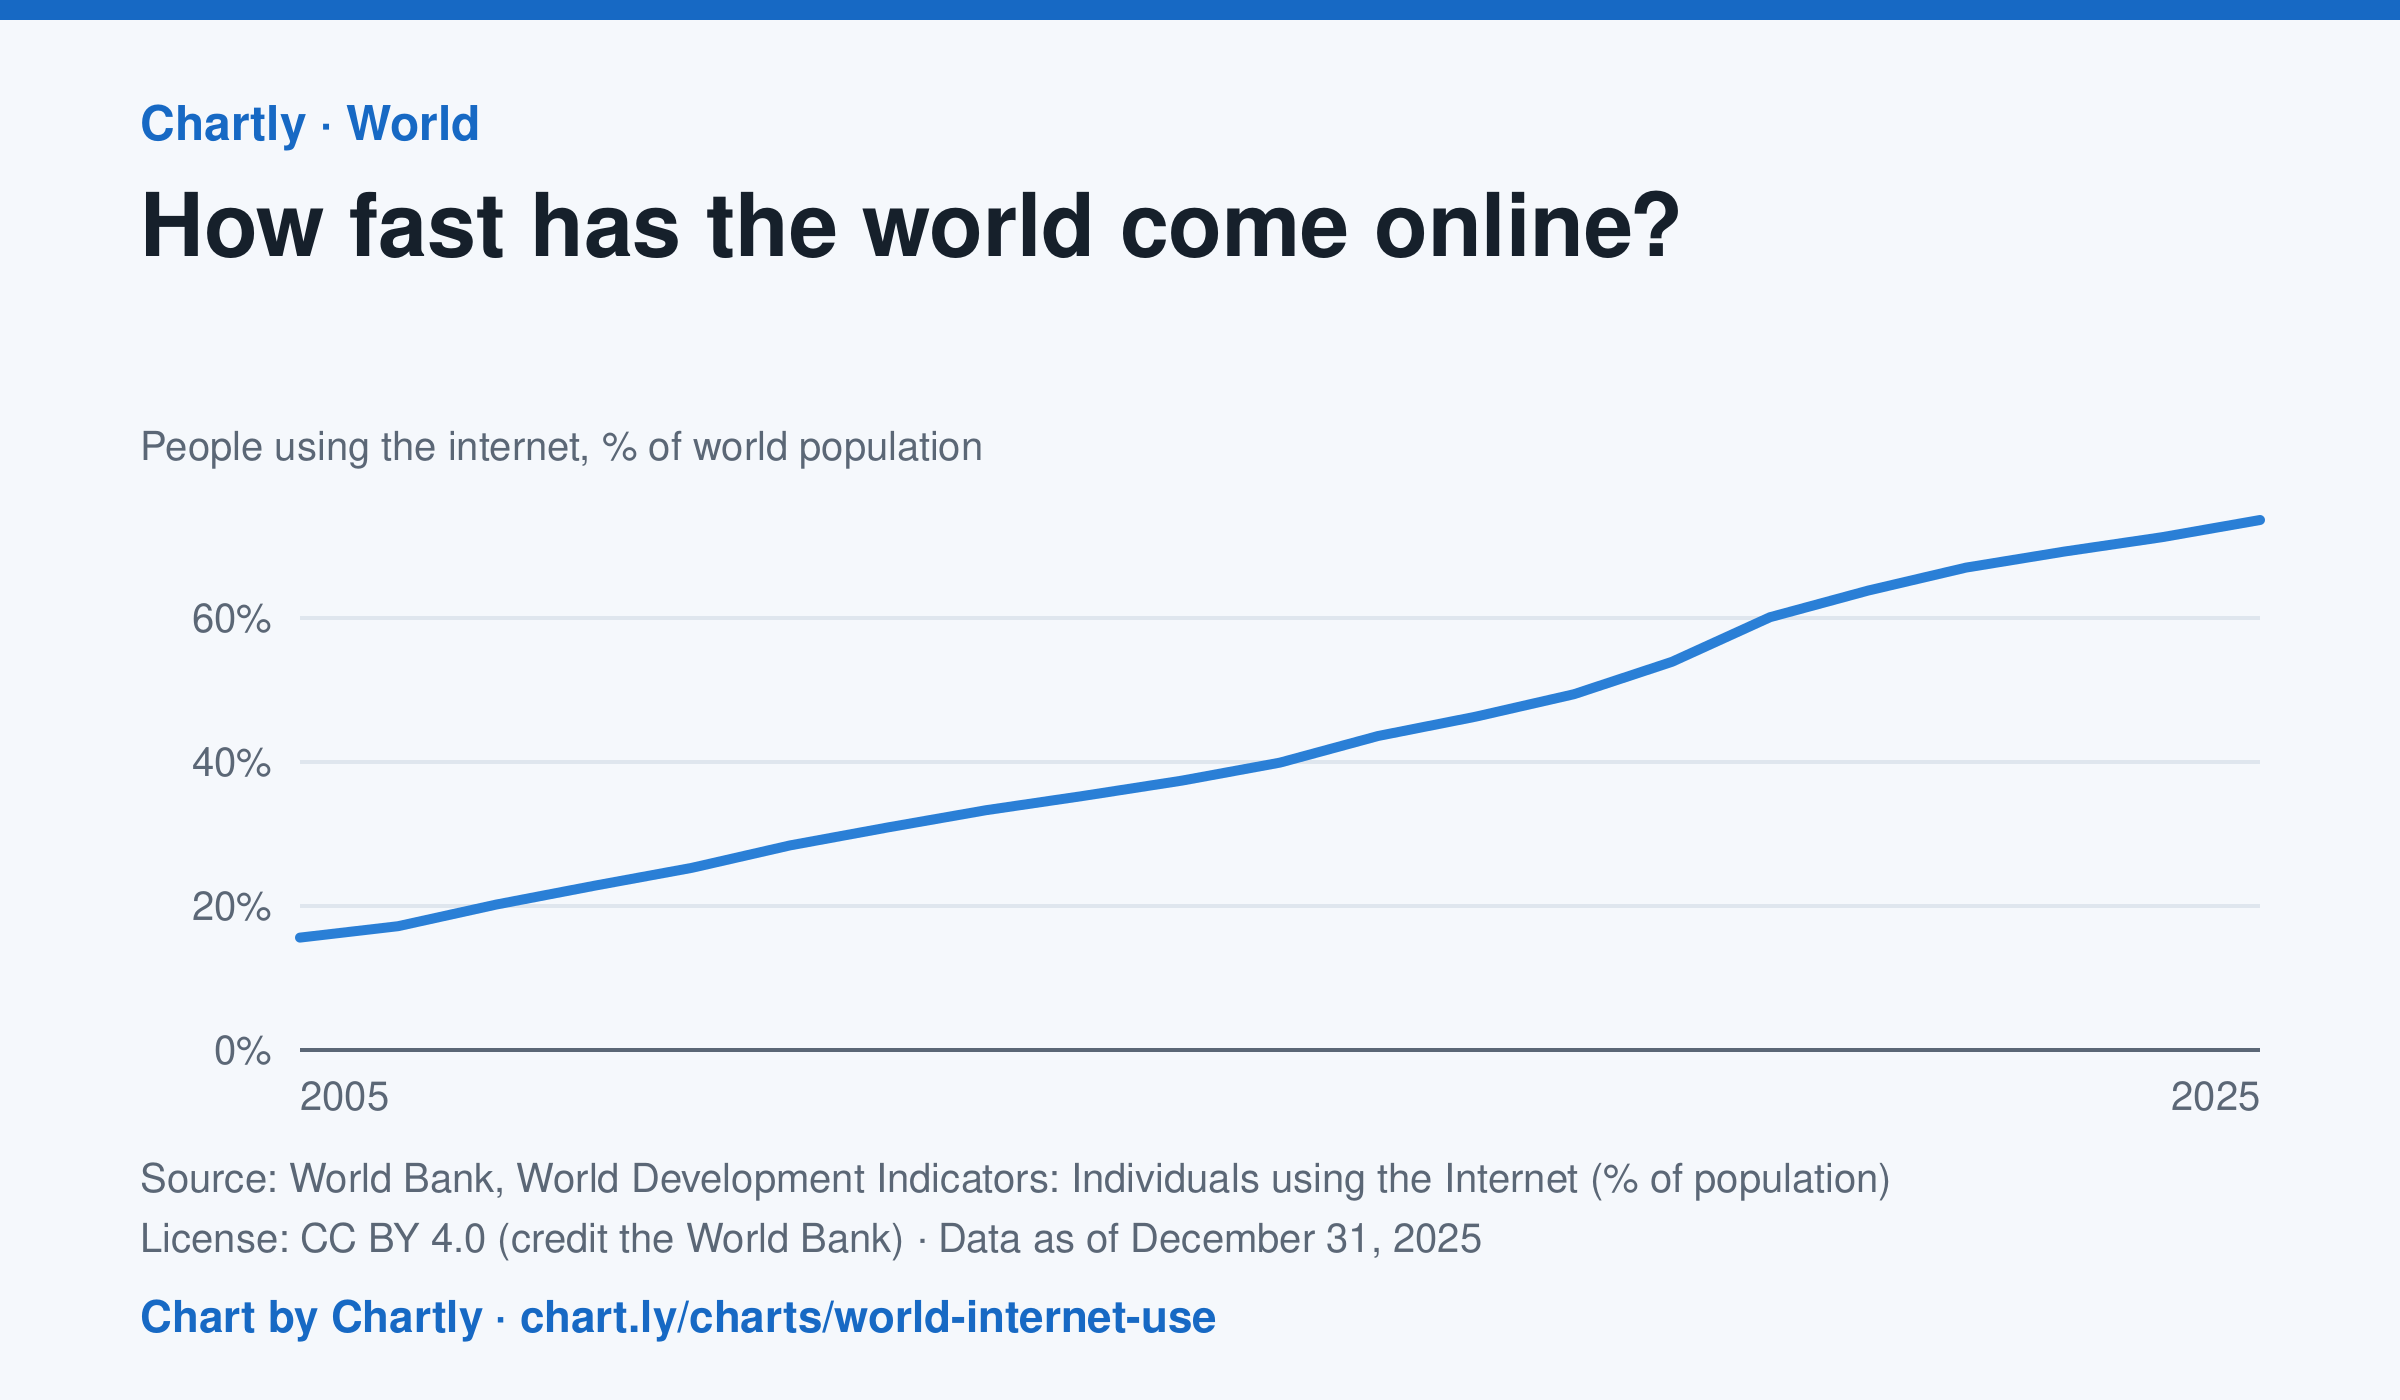
73.6% of the world's people used the internet in 2025, up from 15.6% in 2005, the first year the World Bank gives a world figure. It counts people who used the internet at least once in the previous three months. The world figures are estimates by the International Telecommunication Union.
Source: World Bank, World Development Indicators: Individuals using the Internet (% of population) (CC BY 4.0 (credit the World Bank)) · Data as of Dec 31, 2025
How to read this chart
Each point is the share of the world's people who used the internet at least once in the previous three months, as estimated by the International Telecommunication Union. The axis starts at zero, so the height shows the true share. The steeper the line, the faster people were coming online.
Questions
- About what share of the world was online in the first year on the chart, and in the latest year?
- Did the share grow faster in some years than others? What could have sped it up?
- Using the internet once in three months counts here. What does this number leave out about how people get online?
Chart and numbers: chart.ly/charts/world-internet-use · More free charts at chart.ly
Chart 2 of 2 · Federal budget
Where does federal revenue come from?
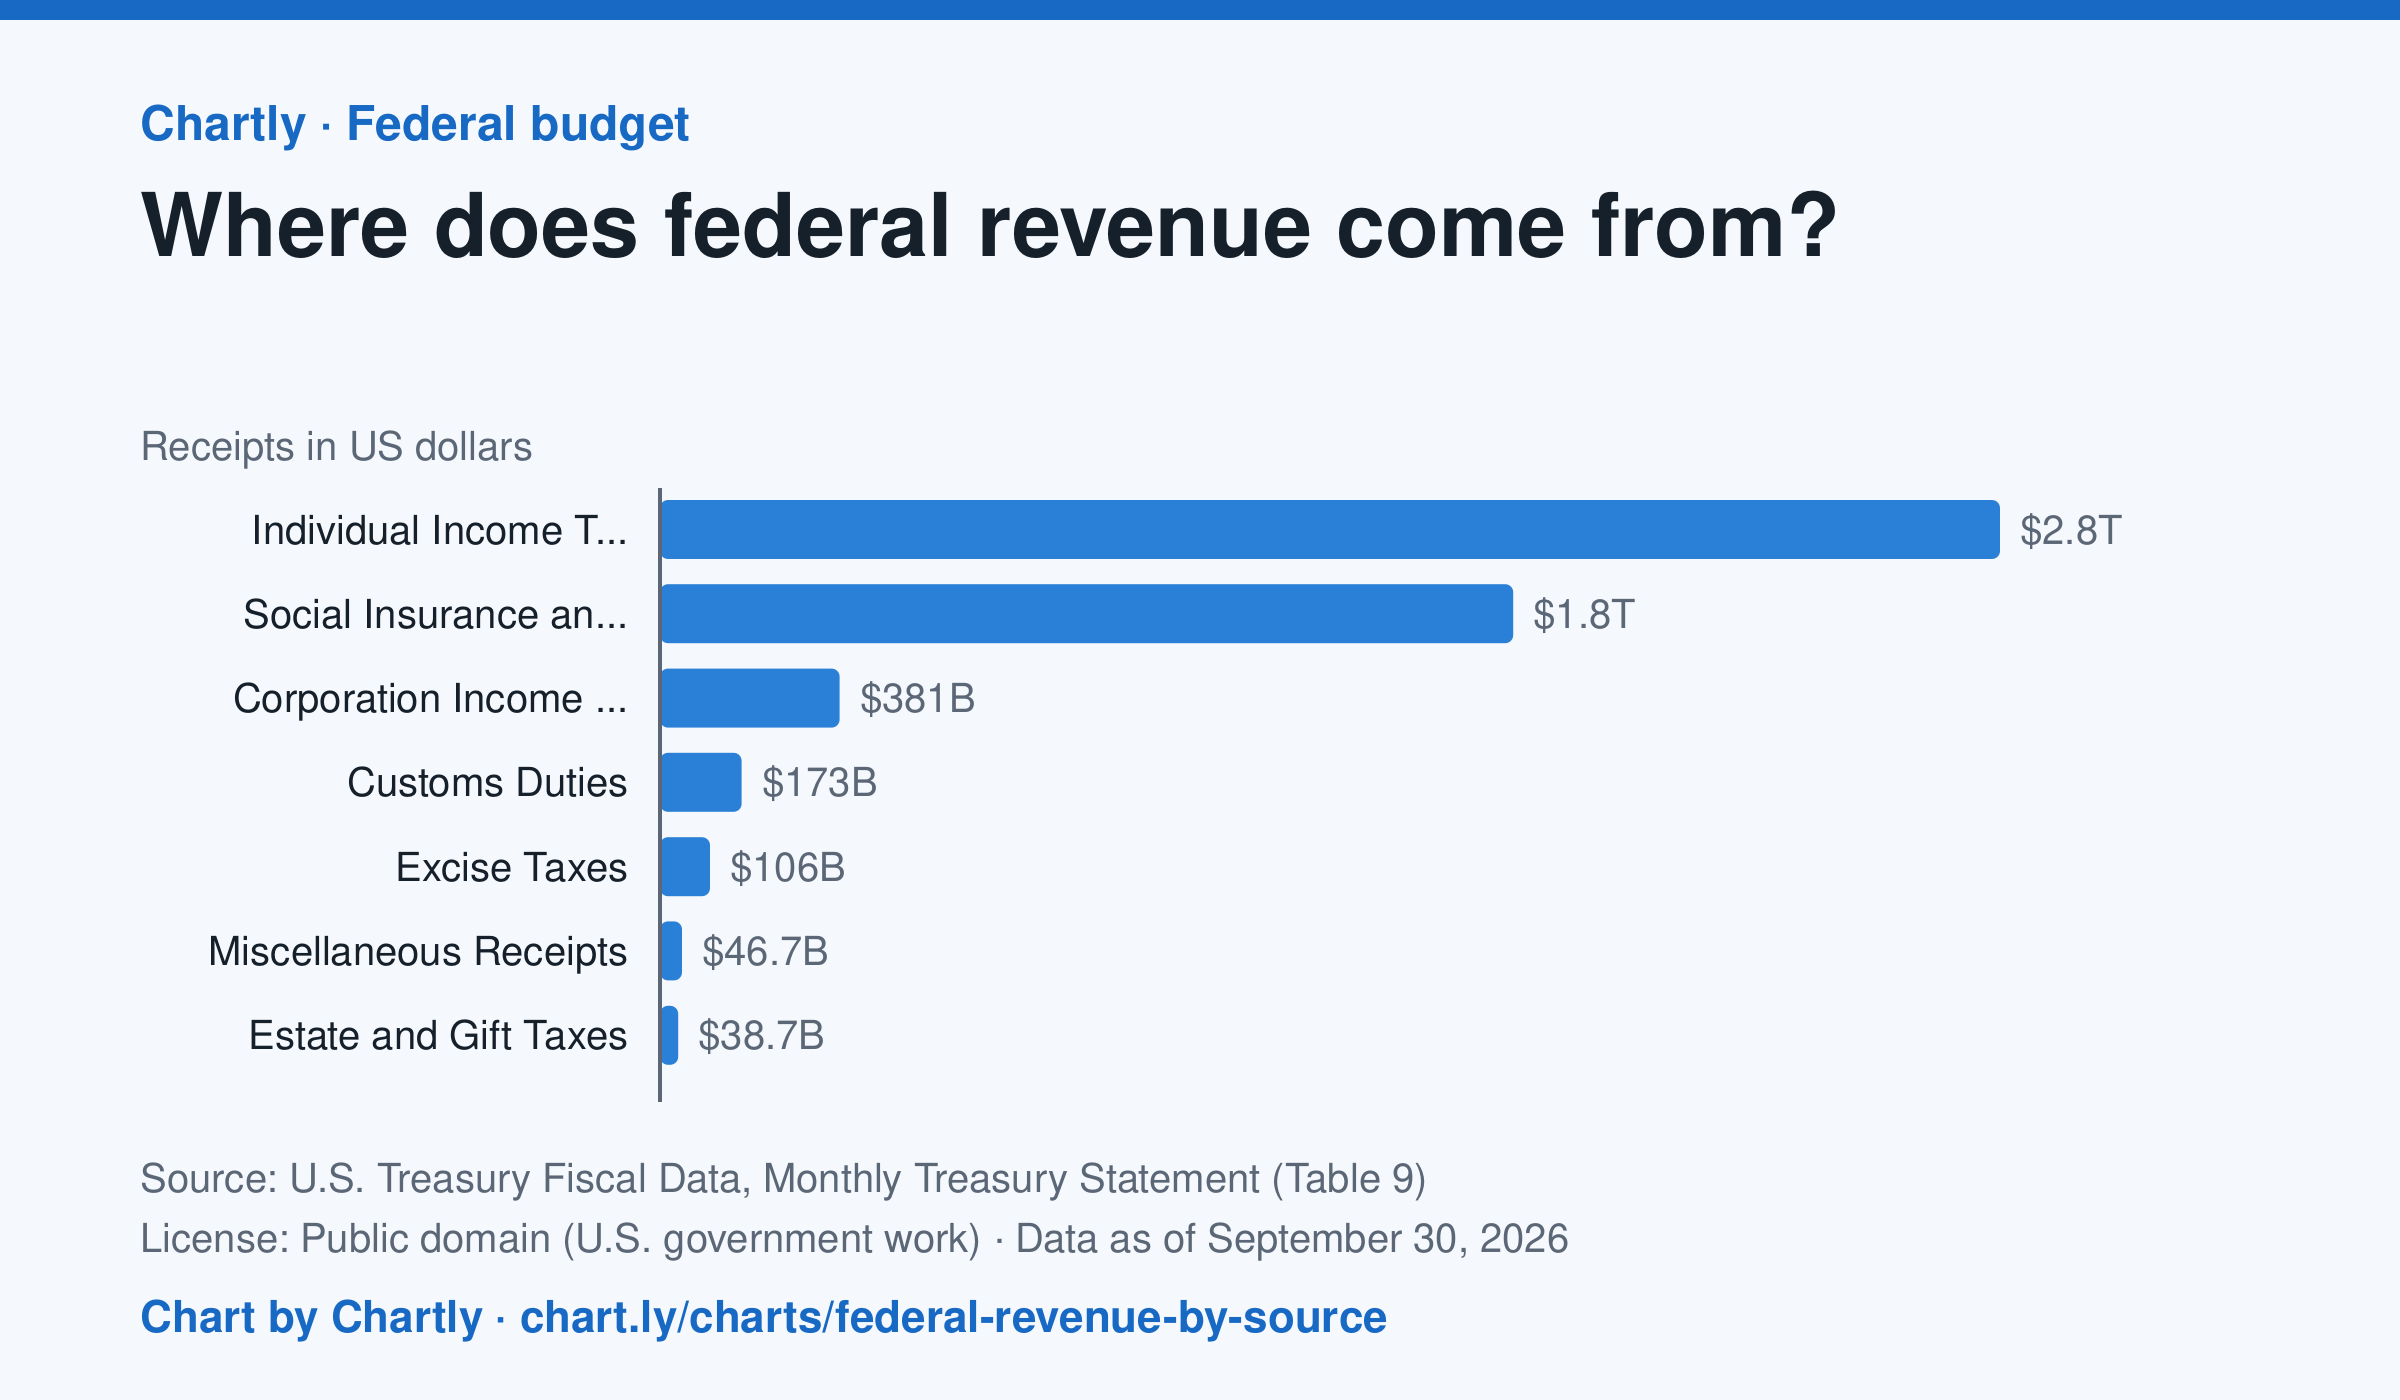
Individual income taxes brought in $2.85 trillion of the government's $5.4 trillion in fiscal 2026, about 53%. Payroll taxes for Social Security, Medicare and unemployment insurance ("social insurance") added $1.81 trillion, and corporate income taxes $381 billion.
Source: U.S. Treasury Fiscal Data, Monthly Treasury Statement (Table 9) (Public domain (U.S. government work)) · Data as of Sep 30, 2026
How to read this chart
Each bar is how much money the federal government collected from one kind of tax in a fiscal year, which runs from October to September. Payroll taxes are the Social Security and Medicare taxes taken out of paychecks. The axis shows dollars: 1T is a trillion dollars.
Questions
- Which source brings in the most money? About what share of the total is it?
- How are individual income taxes different from payroll taxes? Who pays each one?
- Compare this chart with the federal spending chart. What happens when the government spends more than it collects?
Chart and numbers: chart.ly/charts/federal-revenue-by-source · More free charts at chart.ly