Print this worksheet, or choose "Save as PDF" in the print window to share a file.
Chart worksheet
Environmental science chart assignment
Name:
Class:
Date:
Chart 1 of 1 · Energy
Where does US electricity come from?
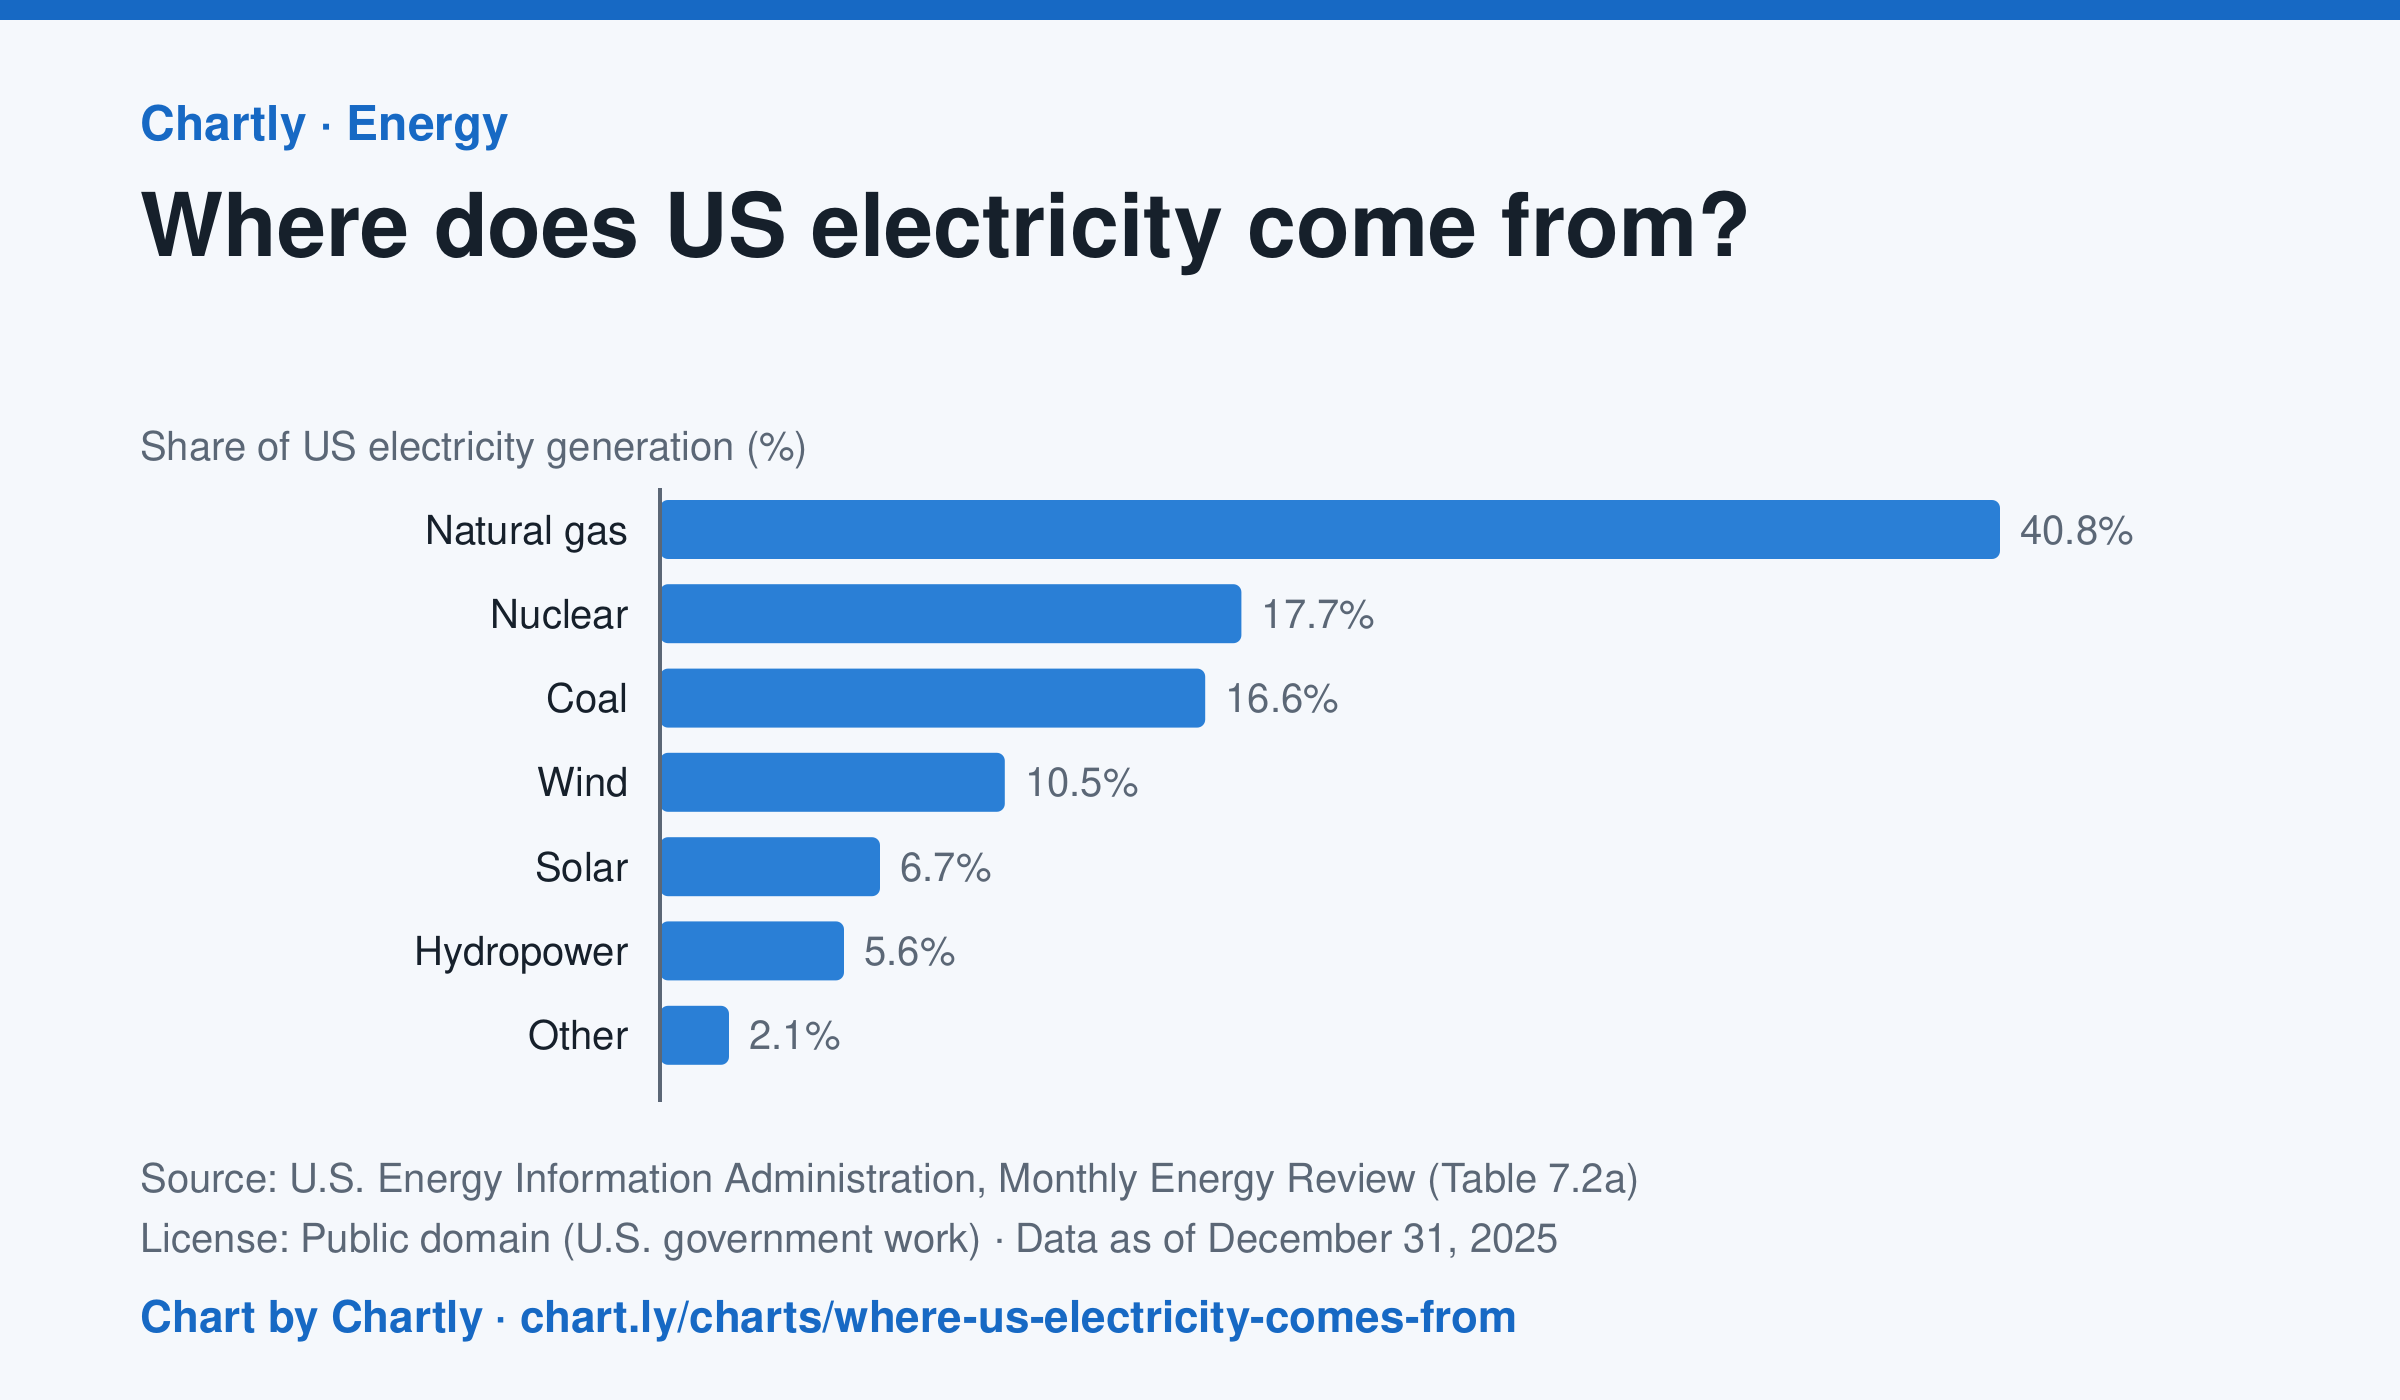
In 2025 natural gas made 40.8% of US electricity, followed by nuclear (17.7%) and coal (16.6%). Wind made 10.5% and solar 6.7%. Solar counts only utility-scale plants, not rooftop panels, and the 2025 figures are preliminary.
Source: U.S. Energy Information Administration, Monthly Energy Review (Table 7.2a) (Public domain (U.S. government work)) · Data as of Dec 31, 2025
How to read this chart
Each bar is one energy source's share of all the electricity made in the U.S. in a year, so the bars add up to about 100%. The bars start at zero, so a bar twice as long means twice the share. Solar counts only large power plants, not panels on rooftops.
Questions
- What are the three biggest sources of U.S. electricity?
- Which of these sources release carbon dioxide when they make electricity, and which don't?
- What are the trade-offs (cost, land, waste, steady supply) between nuclear power and wind and solar?
Chart and numbers: chart.ly/charts/where-us-electricity-comes-from · More free charts at chart.ly