Print this worksheet, or choose "Save as PDF" in the print window to share a file.
Chart worksheet
Charts to read and discuss
Name:
Class:
Date:
Chart 1 of 2 · Energy
Where does US electricity come from?
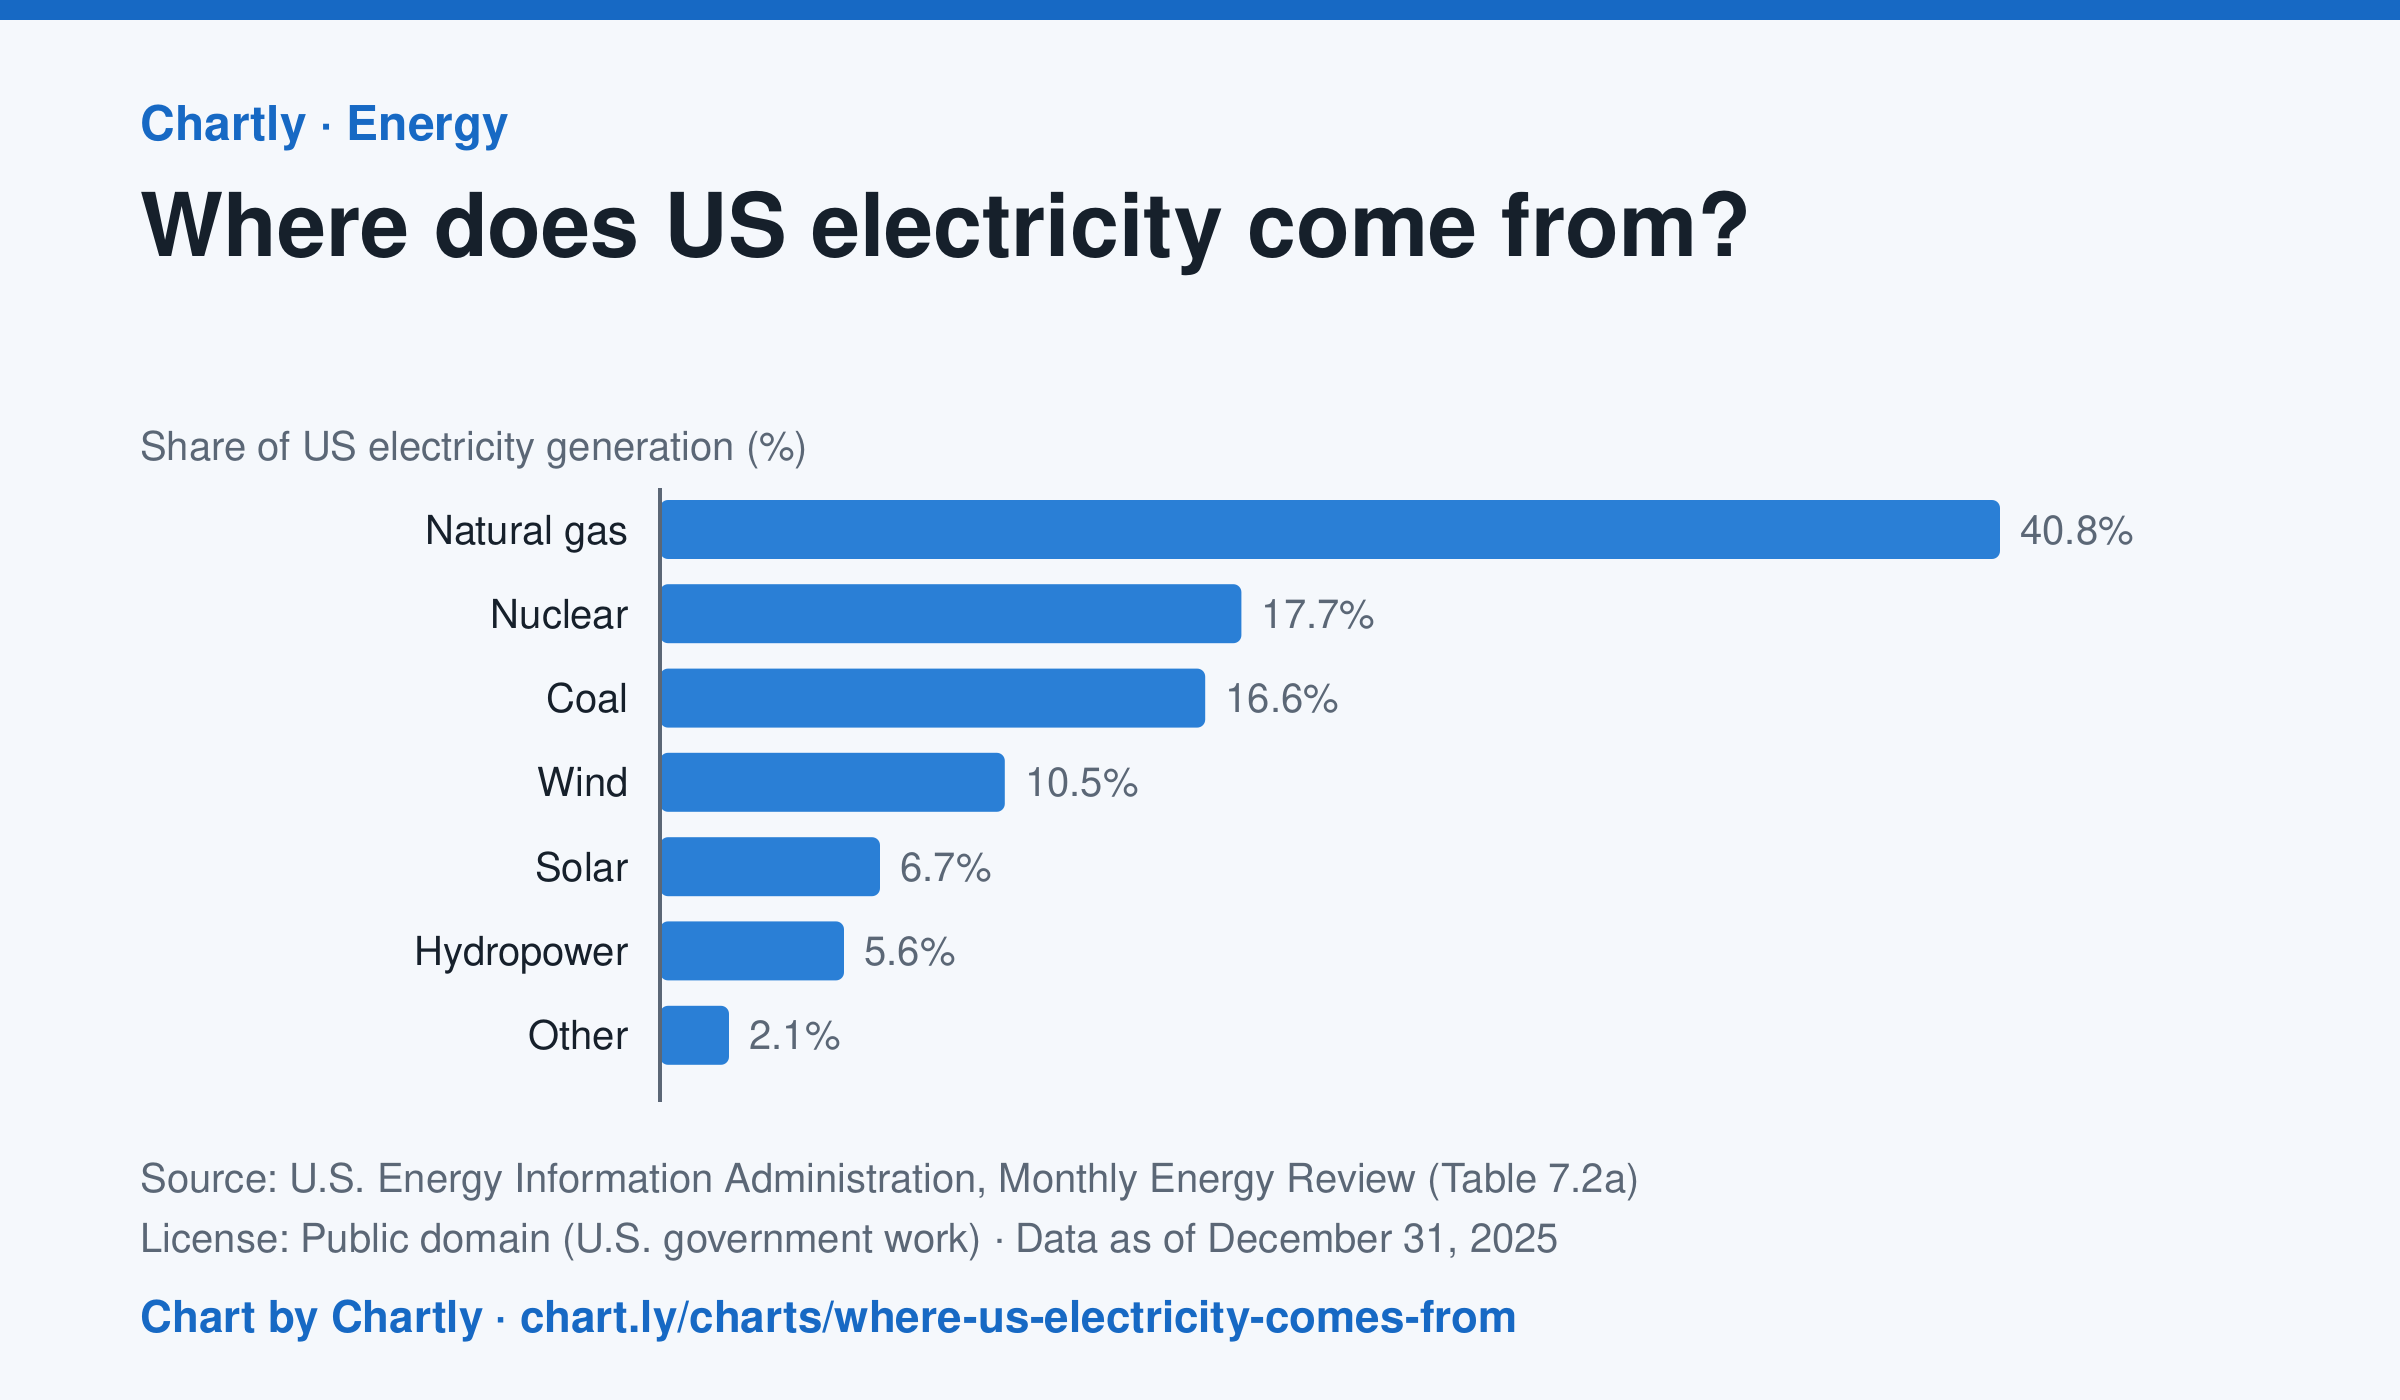
In 2025 natural gas made 40.8% of US electricity, followed by nuclear (17.7%) and coal (16.6%). Wind made 10.5% and solar 6.7%. Solar counts only utility-scale plants, not rooftop panels, and the 2025 figures are preliminary.
Source: U.S. Energy Information Administration, Monthly Energy Review (Table 7.2a) (Public domain (U.S. government work)) · Data as of Dec 31, 2025
How to read this chart
Each bar is one energy source's share of all the electricity made in the U.S. in a year, so the bars add up to about 100%. The bars start at zero, so a bar twice as long means twice the share. Solar counts only large power plants, not panels on rooftops.
Questions
- Which source makes the most electricity? About how many times more than the smallest bar?
- Which of these sources burn fuel and which don't? What share of electricity comes from each group?
- Why might a chart of this kind look different in your state than for the whole country?
Chart and numbers: chart.ly/charts/where-us-electricity-comes-from · More free charts at chart.ly
Chart 2 of 2 · Energy
How much has a gallon of gas cost in the US since 1990?
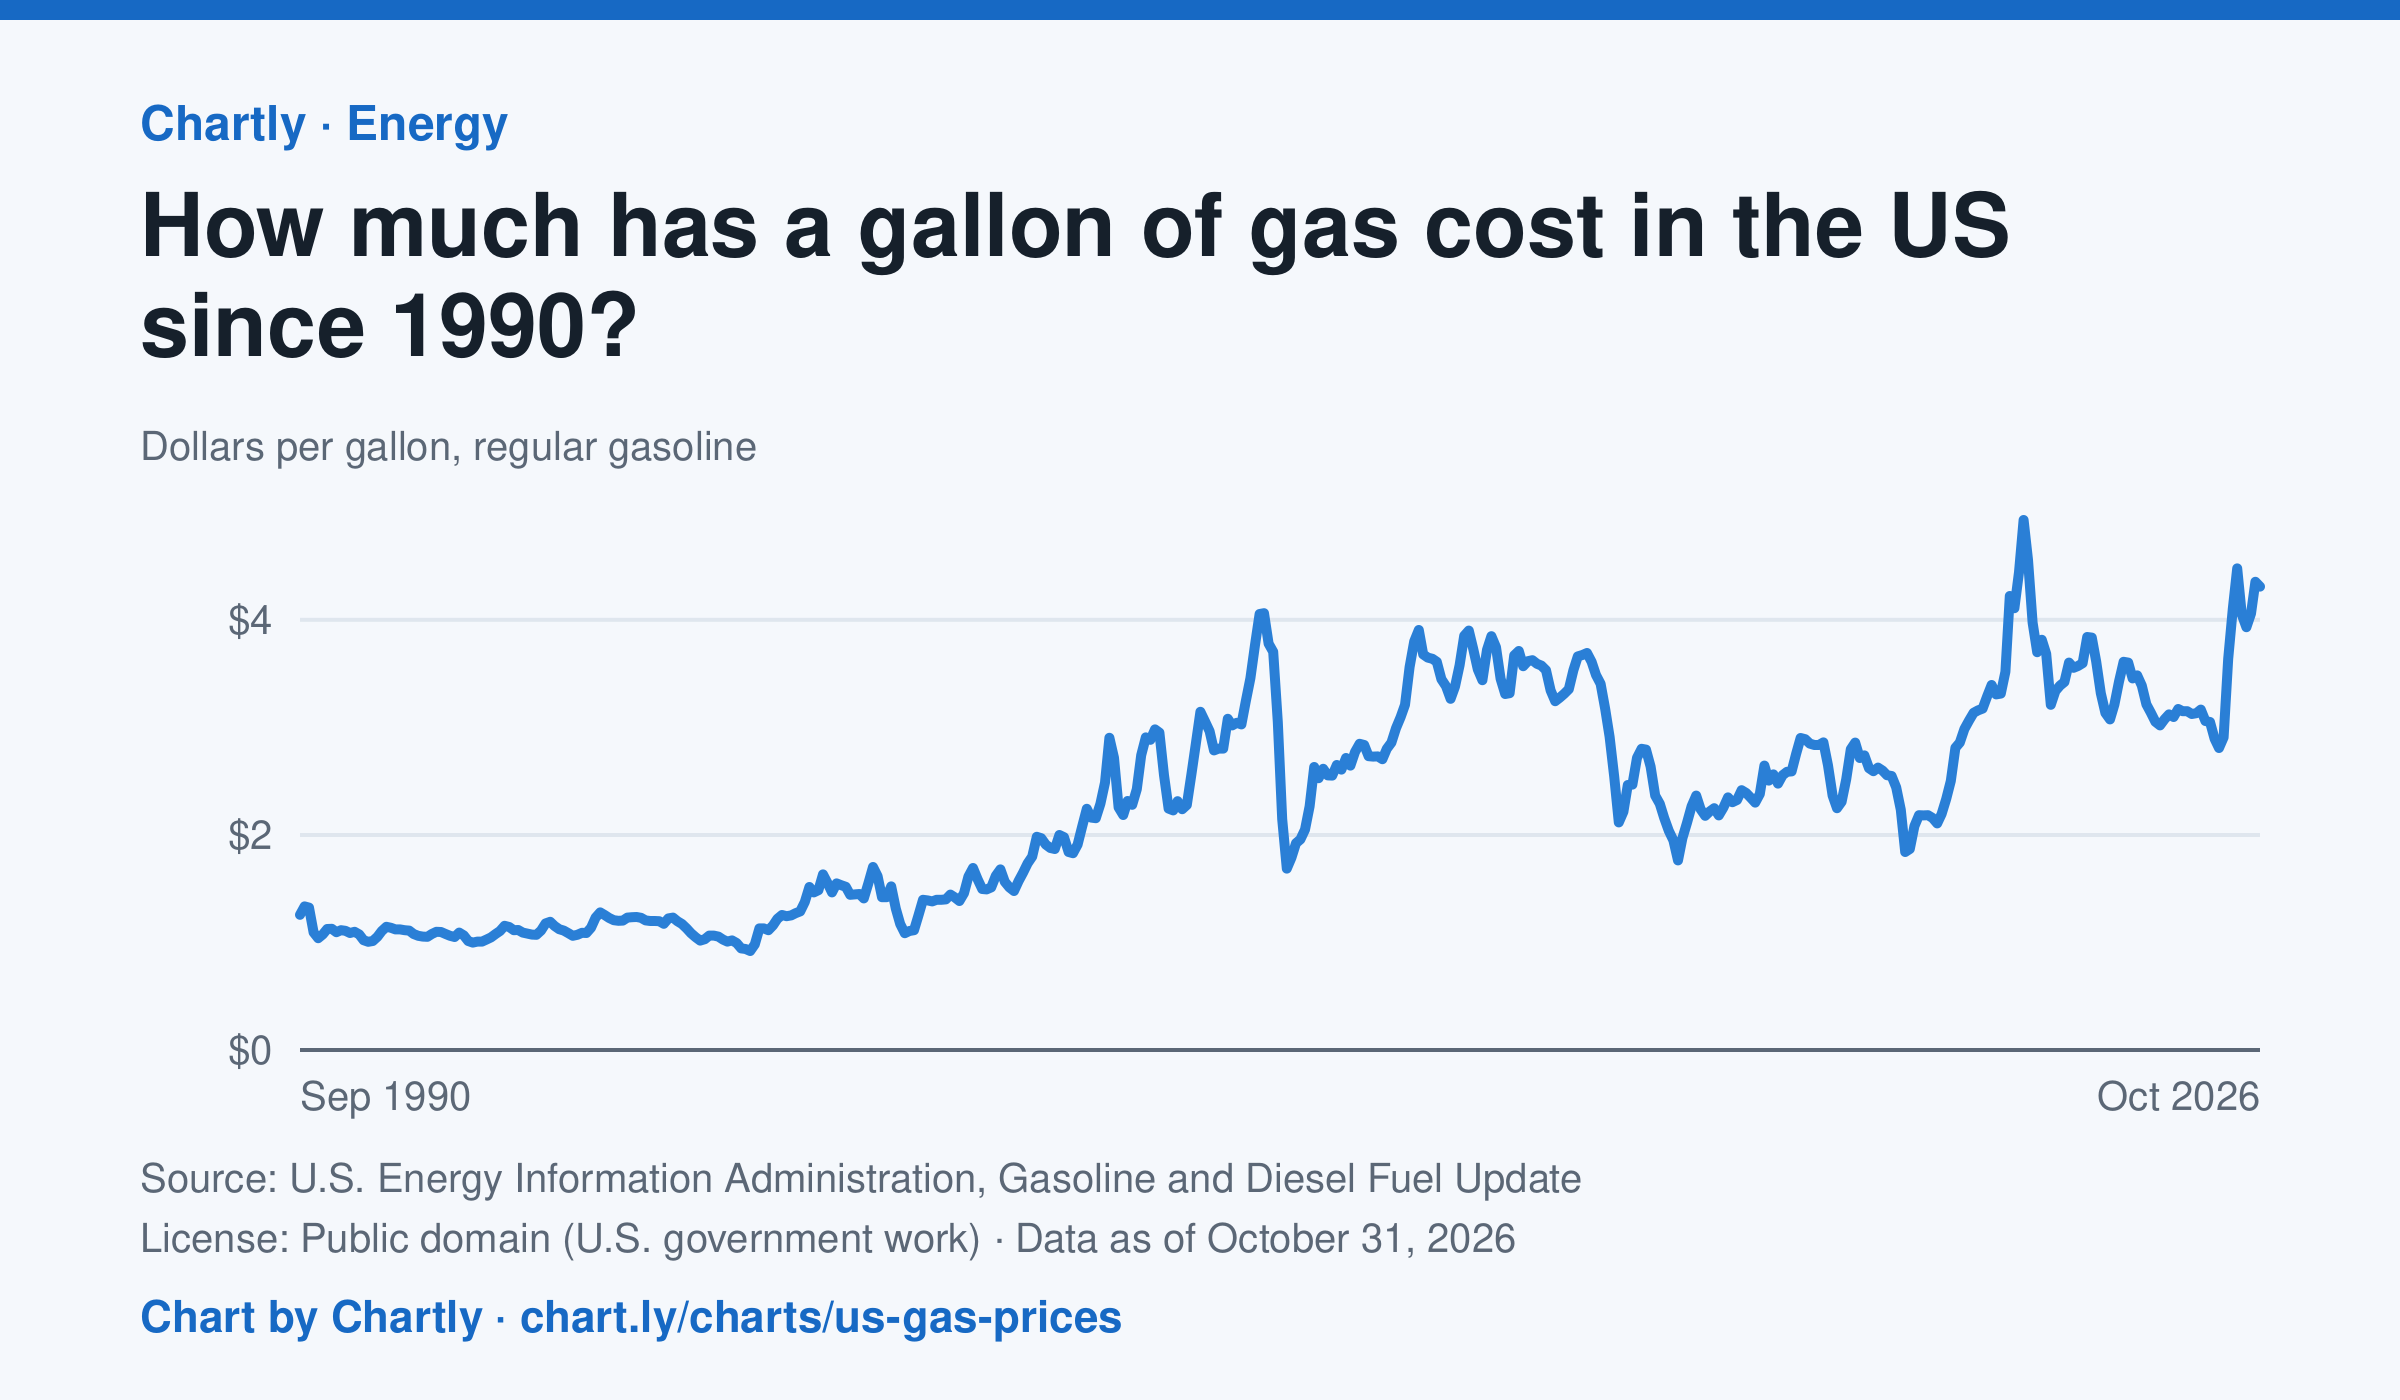
Regular gas averaged $4.31 a gallon in October 2026. The monthly average peaked at $4.93 in June 2022 and was lowest at $0.92 in February 1999. Each point averages EIA's weekly survey of gas stations nationwide, taxes included, in dollars of the day, not adjusted for inflation.
Source: U.S. Energy Information Administration, Gasoline and Diesel Fuel Update (Public domain (U.S. government work)) · Data as of Oct 31, 2026
How to read this chart
Each point is the average price of a gallon of regular gasoline in one month, in dollars, including taxes. The prices are not adjusted for inflation, so a dollar in 1990 bought more than a dollar does now. Gas prices follow the price of crude oil, so world events can move them quickly.
Questions
- Find the highest and lowest months on the chart. How many dollars apart are they?
- Pick a sharp drop on the chart. What world event could have made people use less gas or oil cost less?
- The chart isn't adjusted for inflation. How would that change the way the 1990s prices compare with today's?
Chart and numbers: chart.ly/charts/us-gas-prices · More free charts at chart.ly