Print this worksheet, or choose "Save as PDF" in the print window to share a file.
Chart worksheet
Charts to read and discuss
Name:
Class:
Date:
Chart 1 of 2 · Energy
Where does US electricity come from?
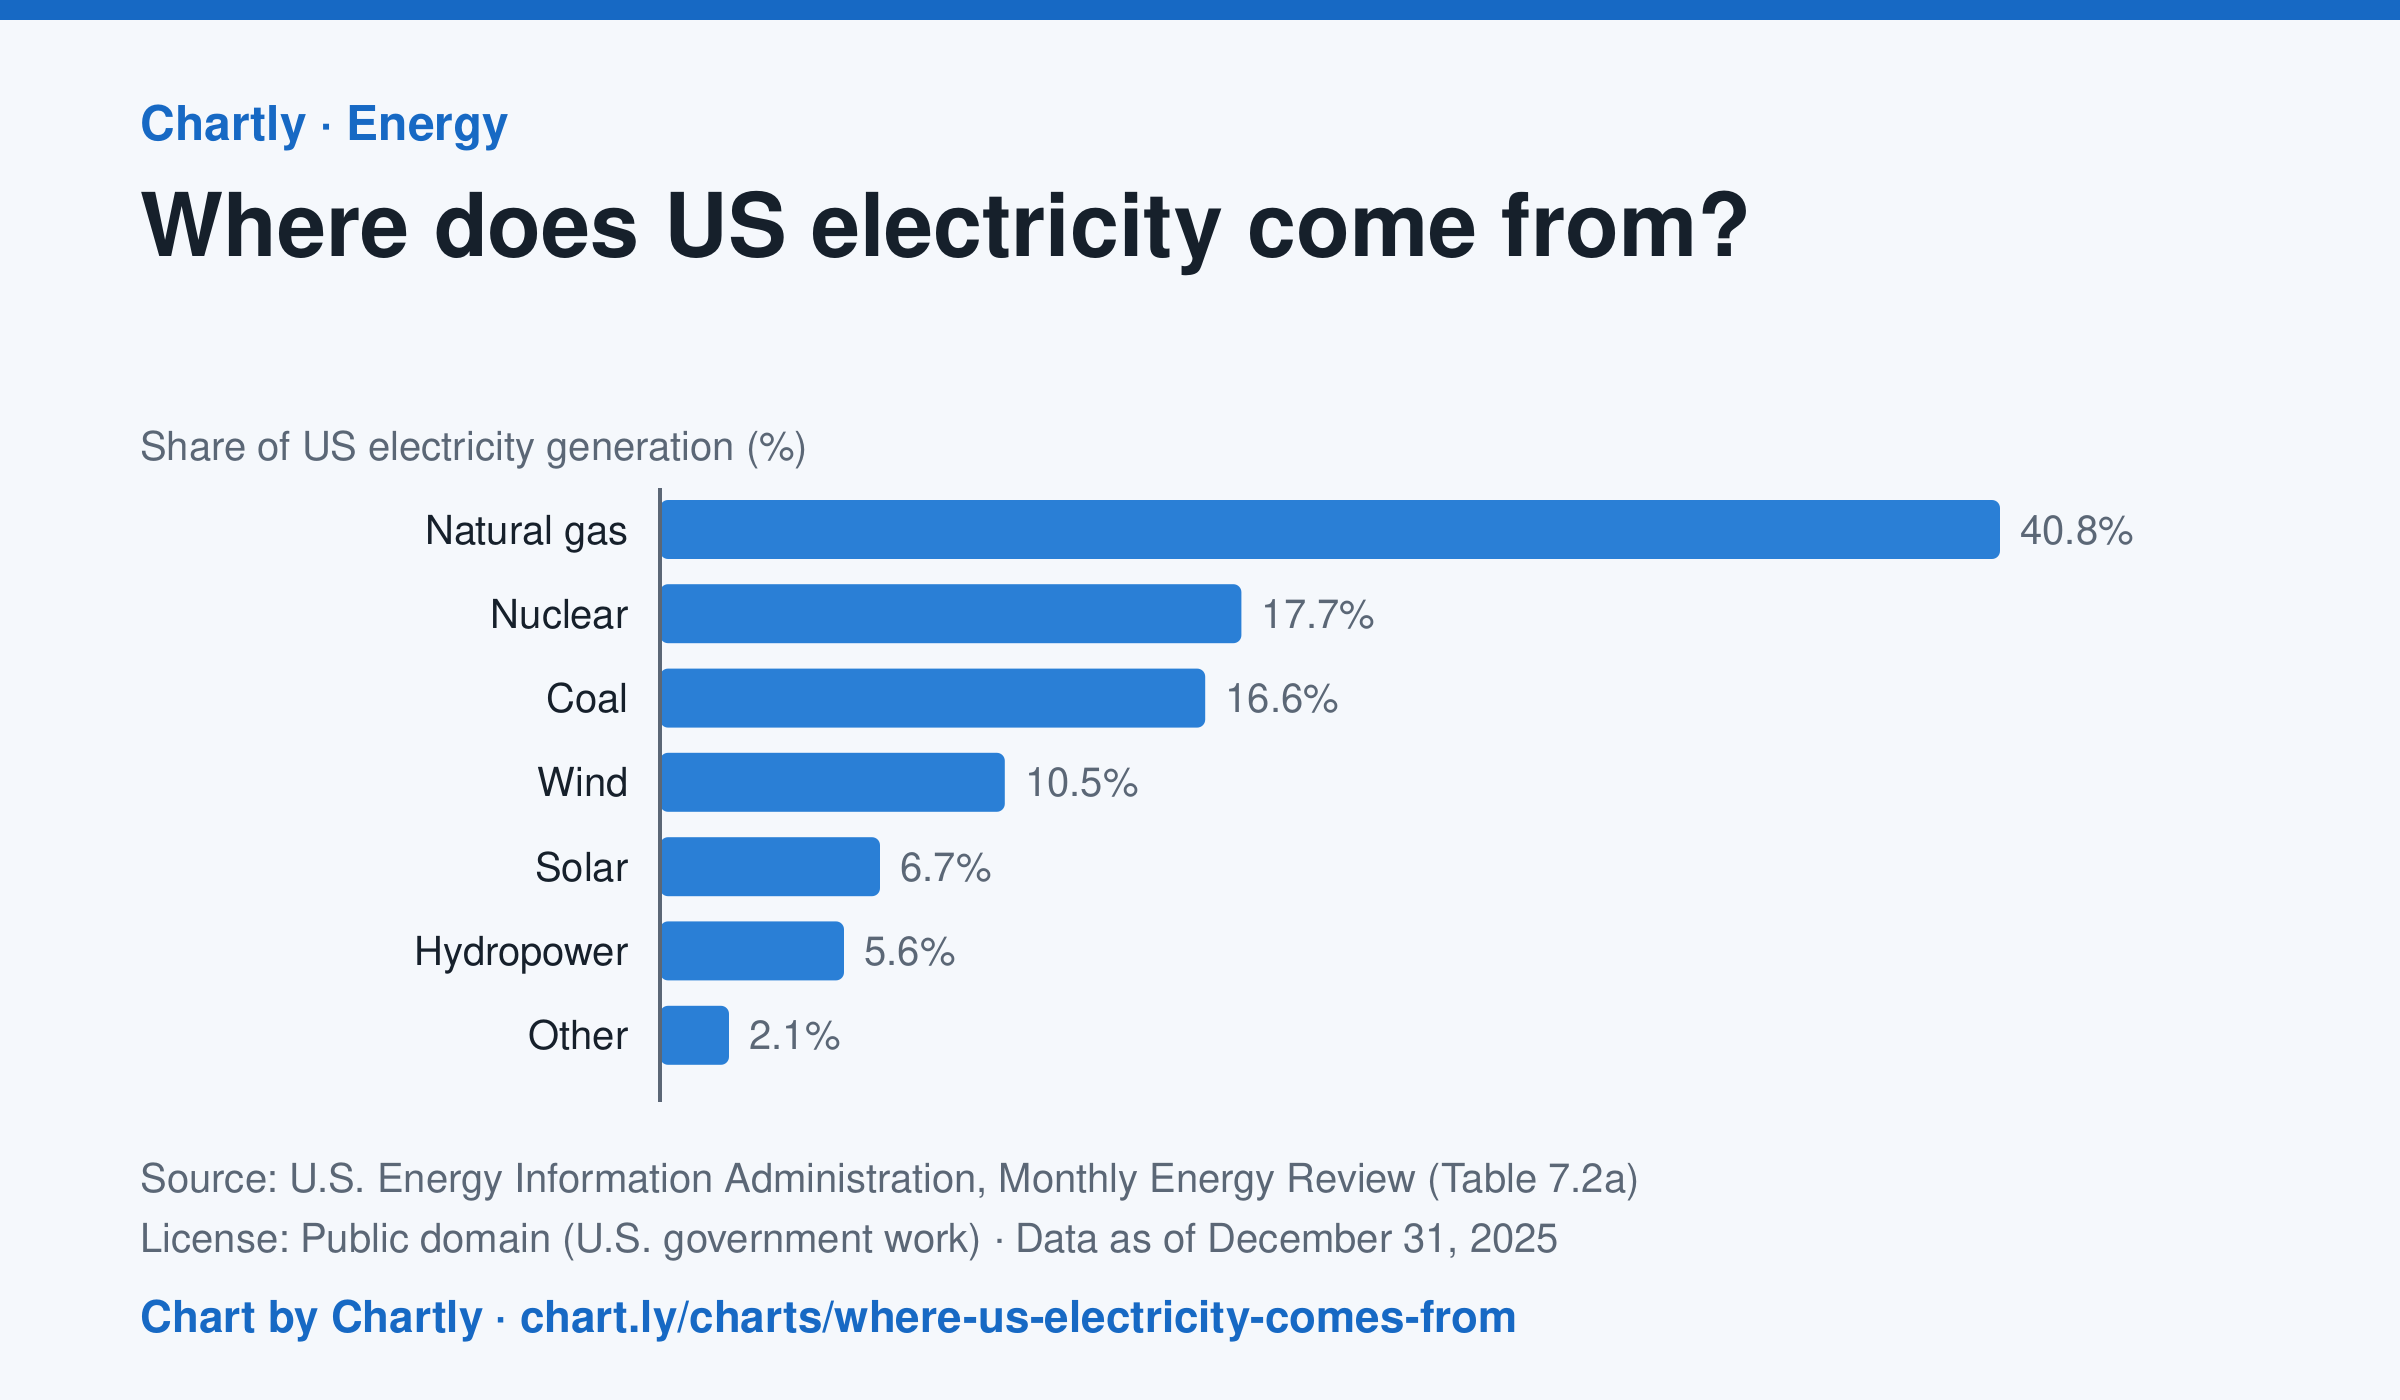
In 2025 natural gas made 40.8% of US electricity, followed by nuclear (17.7%) and coal (16.6%). Wind made 10.5% and solar 6.7%. Solar counts only utility-scale plants, not rooftop panels, and the 2025 figures are preliminary.
Source: U.S. Energy Information Administration, Monthly Energy Review (Table 7.2a) (Public domain (U.S. government work)) · Data as of Dec 31, 2025
How to read this chart
Each bar is one energy source's share of all the electricity made in the U.S. in a year, so the bars add up to about 100%. The bars start at zero, so a bar twice as long means twice the share. Solar counts only large power plants, not panels on rooftops.
Questions
- Which source makes the most electricity? About how many times more than the smallest bar?
- Which of these sources burn fuel and which don't? What share of electricity comes from each group?
- Why might a chart of this kind look different in your state than for the whole country?
Chart and numbers: chart.ly/charts/where-us-electricity-comes-from · More free charts at chart.ly
Chart 2 of 2 · Federal budget
Where does federal spending go?
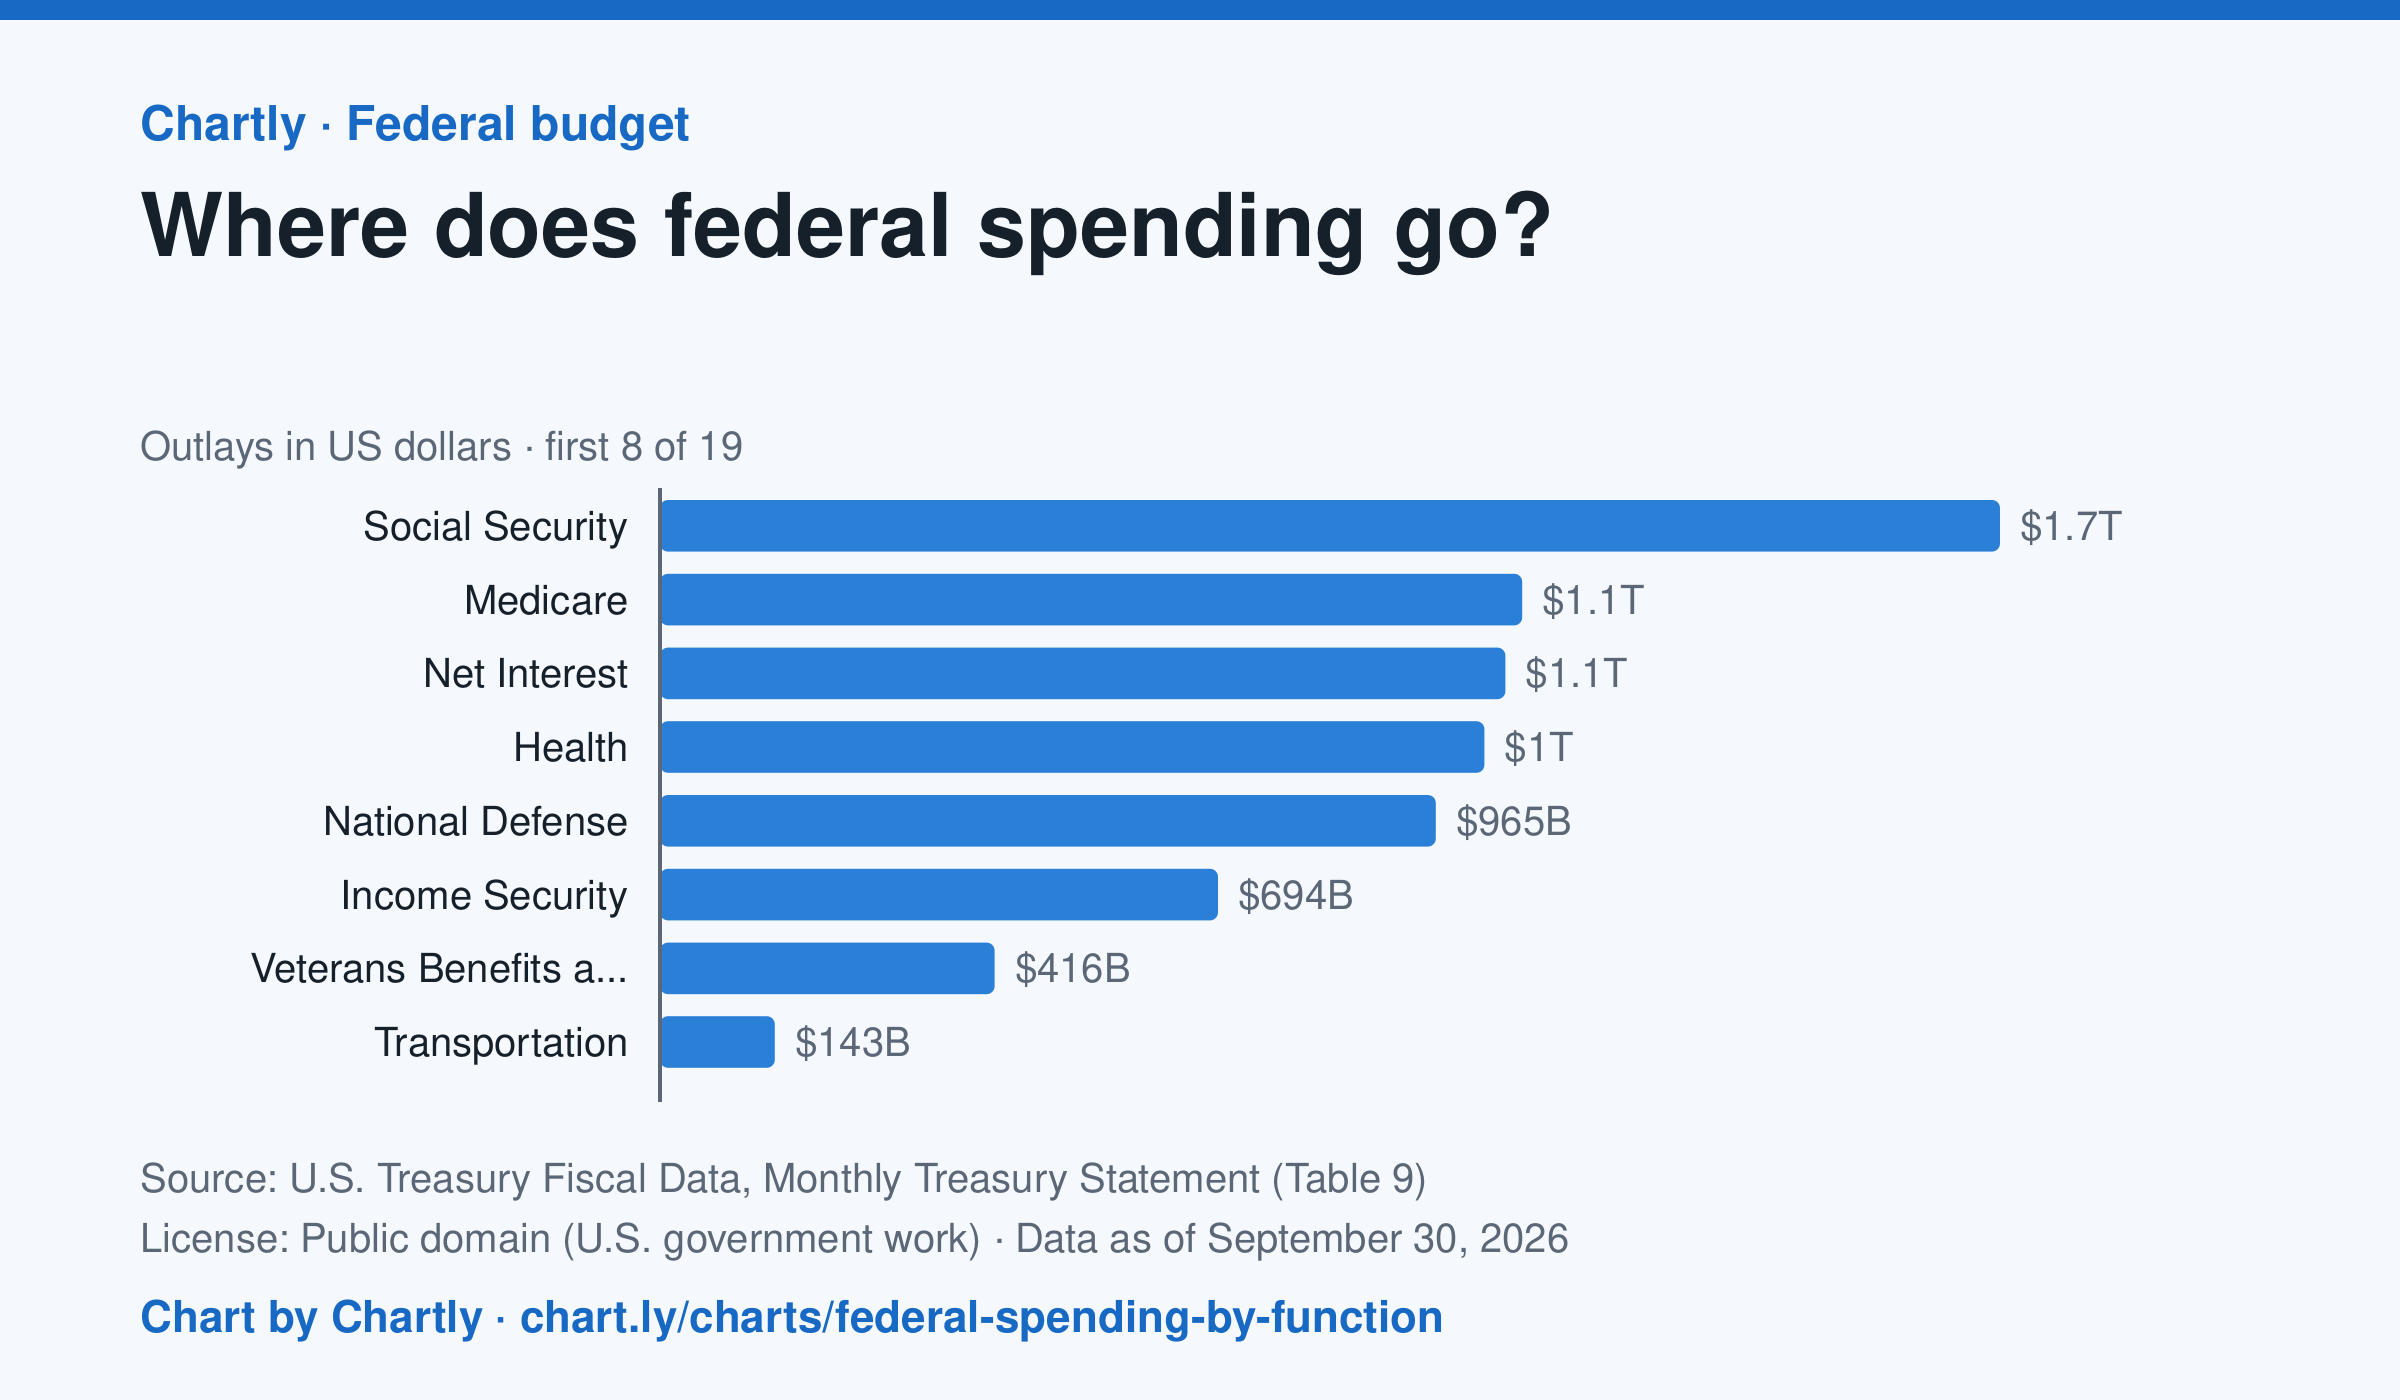
Social Security was the biggest item in fiscal 2026 at $1.67 trillion, out of $7.4 trillion in total. Next came Medicare ($1.07 trillion), Net Interest ($1.05 trillion), Health ($1.03 trillion) and National Defense ($965 billion). Two accounting lines are below zero, so the bars add up to the total.
Source: U.S. Treasury Fiscal Data, Monthly Treasury Statement (Table 9) (Public domain (U.S. government work)) · Data as of Sep 30, 2026
How to read this chart
Each bar is how much the federal government spent on one area in a fiscal year, which runs from October to September. The axis shows dollars: 1T is a trillion dollars, a thousand billion. One bar is below zero because it counts money the government takes back in, such as payments agencies make to each other, which lowers the total.
Questions
- Which area gets the most money? About how many times more than the smallest positive bar?
- Which of the biggest areas are paid to people directly, like retirees and patients, and which pay for services?
- If Congress wanted to cut spending by a lot, which bars would it have to change, and why is that hard?
Chart and numbers: chart.ly/charts/federal-spending-by-function · More free charts at chart.ly