Print this worksheet, or choose "Save as PDF" in the print window to share a file.
Chart worksheet
AP Statistics chart assignment
Name:
Class:
Date:
Chart 1 of 1 · Crime
Which big U.S. cities have the most violent crime?
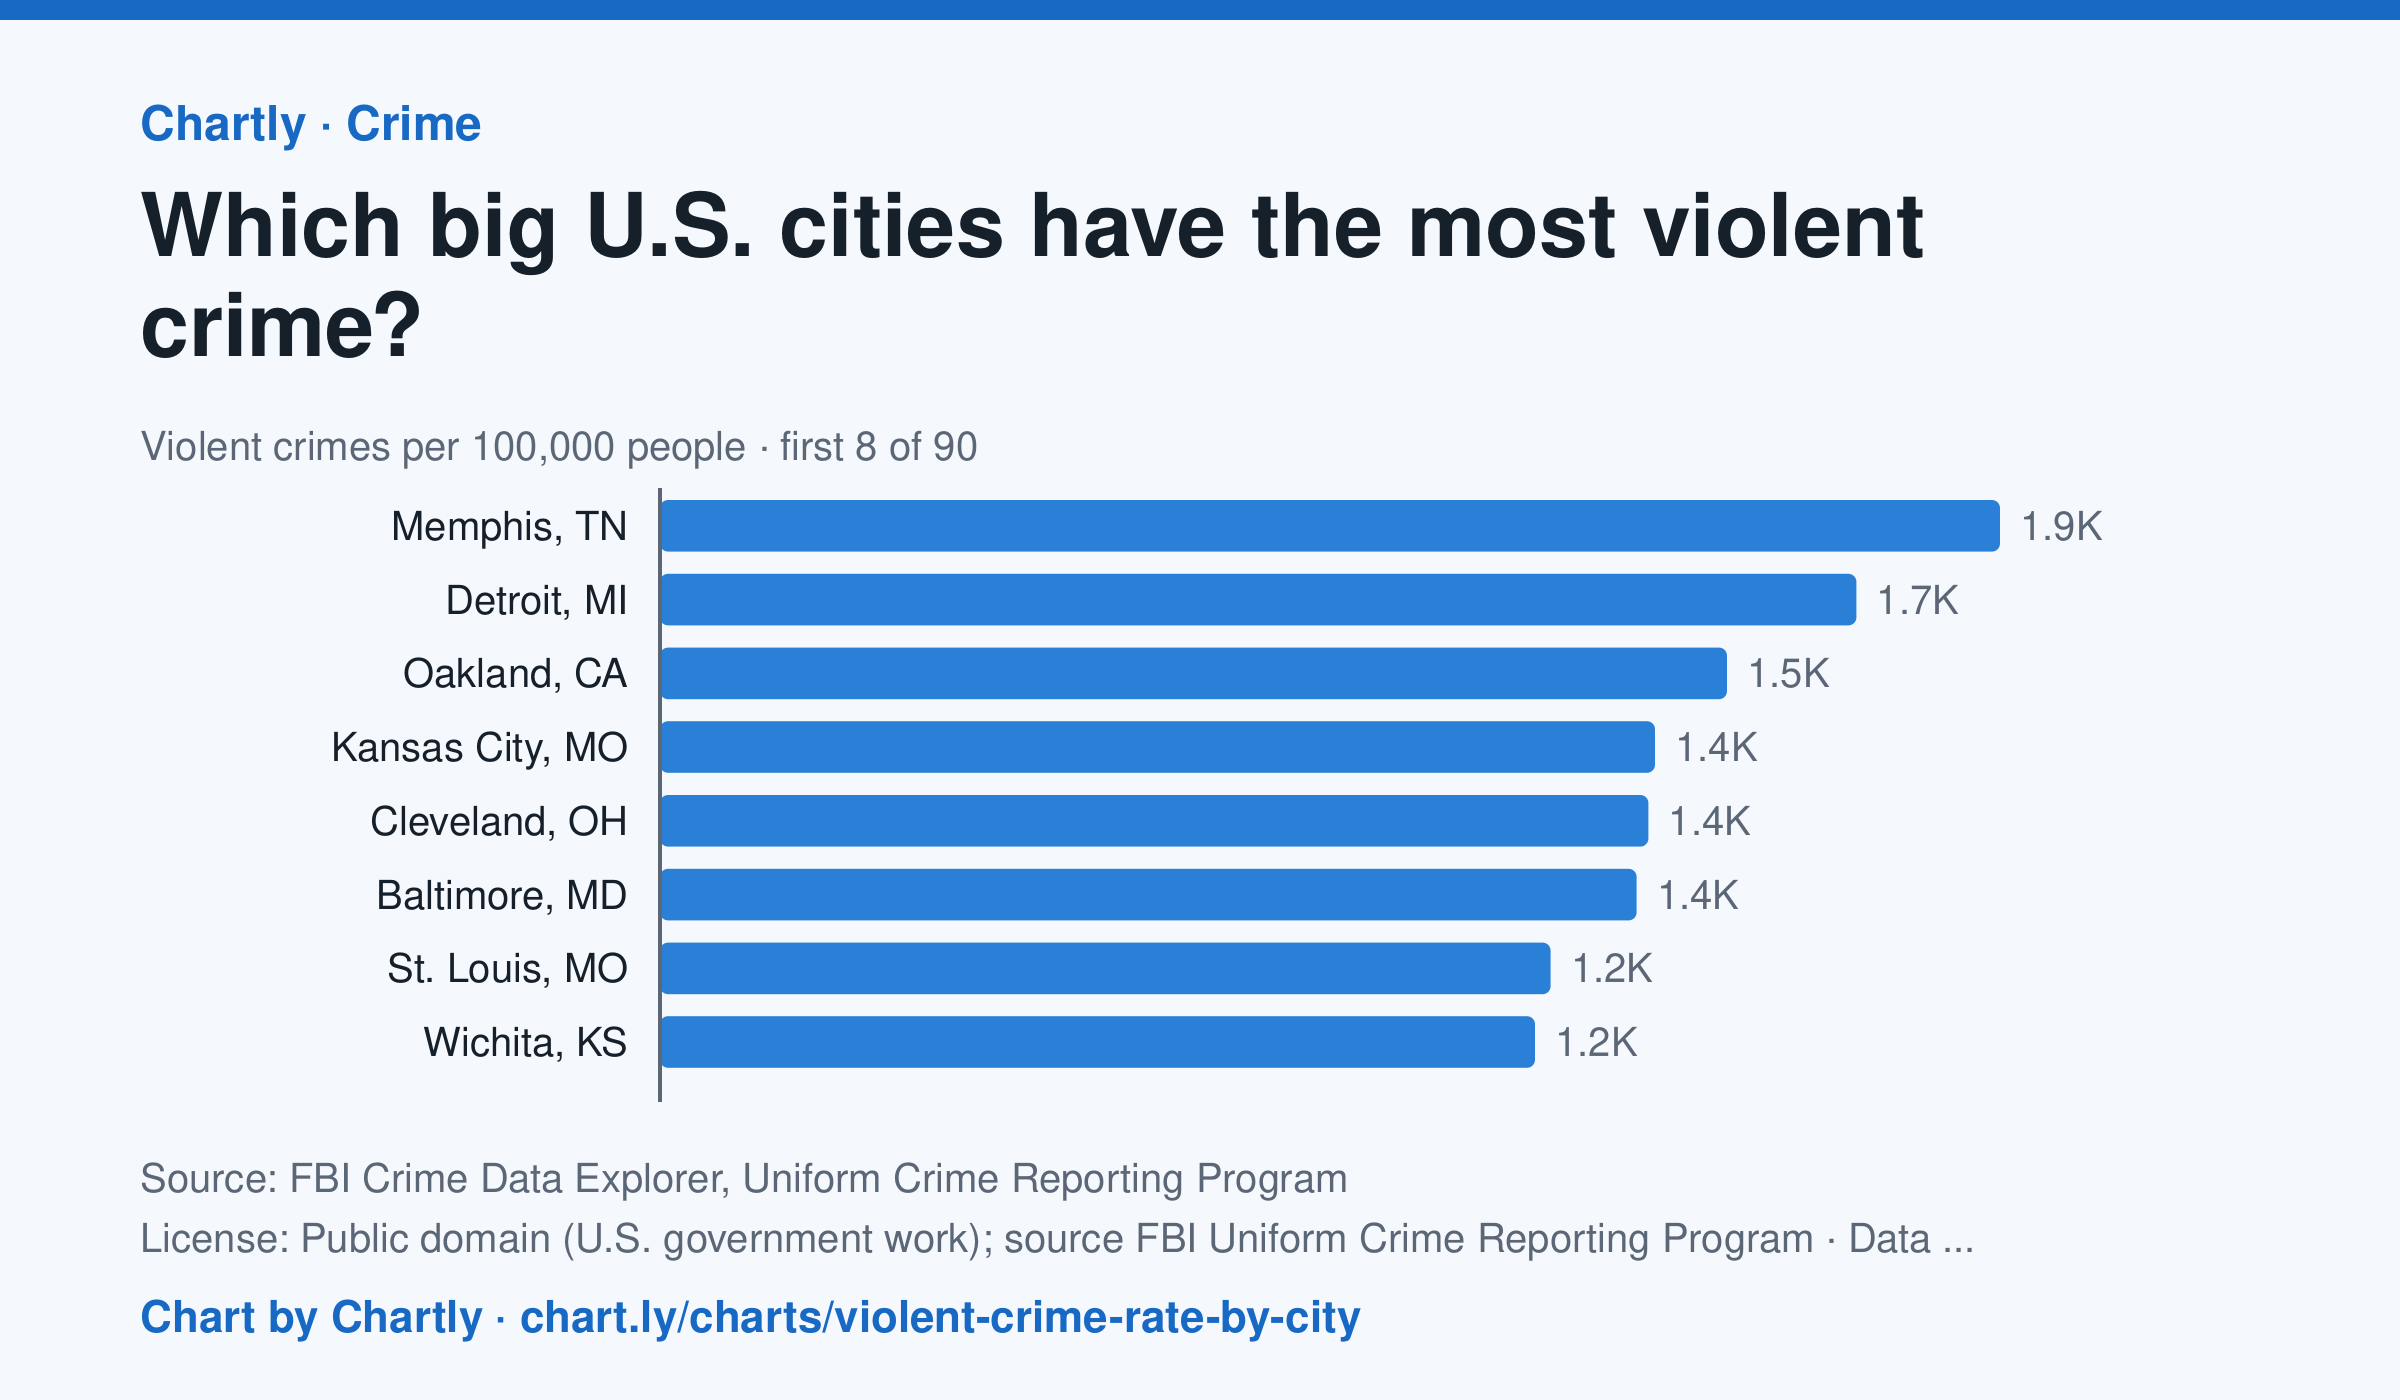
In 2025, Memphis, TN had the highest violent crime rate of the 89 biggest U.S. cities whose police reported a full year to the FBI, about 1,853 per 100,000 people, followed by Detroit, MI (1,654) and Oakland, CA (1,475). Irvine, CA (79) and Virginia Beach, VA (101) had the lowest; the U.S. rate was about 330. Violent crime is murder, rape, robbery and aggravated assault. In 2025 the police in New Orleans, Orlando and St. Petersburg, Florida, didn't report a full year of crimes, so they are left out. Each rate is per person the department serves, and a few, such as Las Vegas, Honolulu, Jacksonville and Louisville, serve their whole county. A city's rate also depends on where its borders fall, so compare cities with care.
Source: FBI Crime Data Explorer, Uniform Crime Reporting Program (Public domain (U.S. government work); source FBI Uniform Crime Reporting Program) · Data as of Dec 31, 2025
How to read this chart
Each bar is one big city's violent crimes reported to the FBI in a year (murder, rape, robbery and aggravated assault) for every 100,000 people its police department serves. The dashed line is the rate for the whole U.S. Dividing by population makes big and small cities fair to compare, but a city's rate also depends on where its borders fall.
Questions
- Find the city with the highest rate and the one with the lowest. About how many times higher is the top rate?
- Some departments police a whole county, suburbs included. How could that change a city's rate compared with one that covers only its downtown?
- These are crimes reported to police. What kinds of crime might never show up in these numbers, and why?
Chart and numbers: chart.ly/charts/violent-crime-rate-by-city · More free charts at chart.ly