Print this worksheet, or choose "Save as PDF" in the print window to share a file.
Chart worksheet
Charts to read and discuss
Name:
Class:
Date:
Chart 1 of 3 · Crime
Is violent crime in the U.S. going up or down?
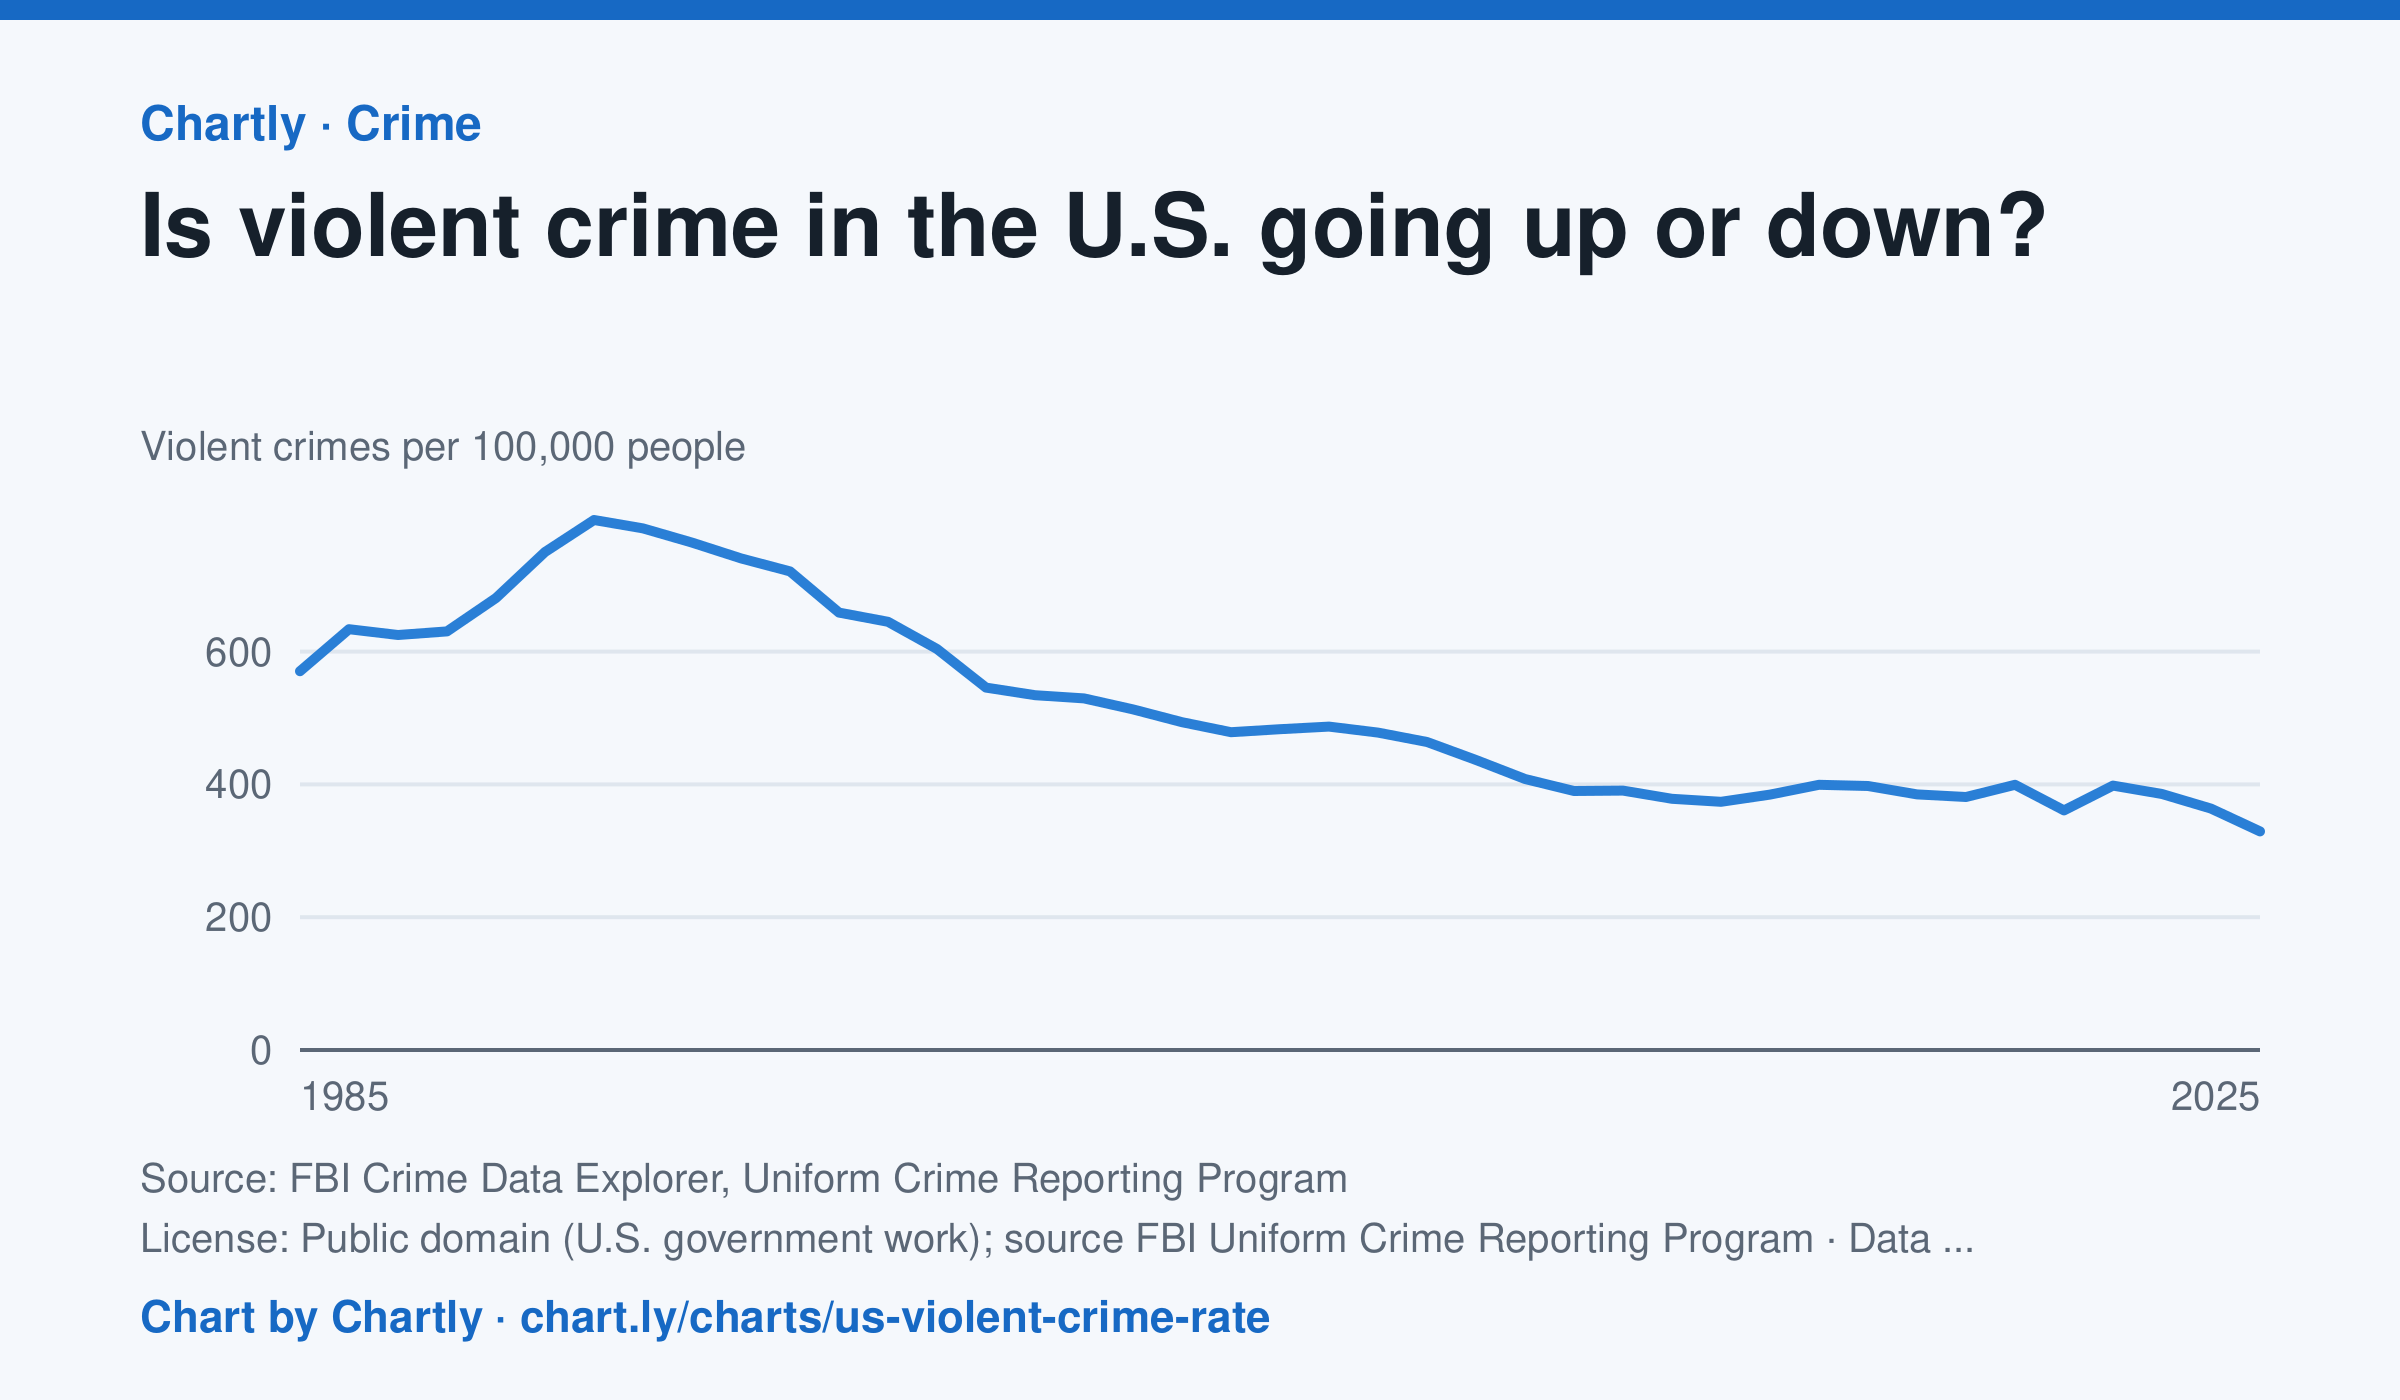
Down, over the long run. Police reported about 329 violent crimes per 100,000 people in 2025, about 59% below the 1991 peak of about 798, and the lowest since at least 1985. The rate rose in 2020 and 2022, then fell in 2023, 2024 and 2025. In 2021 the FBI stopped taking its old summary reports and accepted only its newer, more detailed system (NIBRS); many police departments hadn't switched yet, so agencies covering only about 77% of Americans reported, against 88 to 98% in other years, and 2021's number is less certain. Rates count only the agencies that reported, so they differ a little from the FBI's national estimates, and the FBI widened its definition of rape in 2013.
Source: FBI Crime Data Explorer, Uniform Crime Reporting Program (Public domain (U.S. government work); source FBI Uniform Crime Reporting Program) · Data as of Dec 31, 2025
How to read this chart
Each point is the number of violent crimes police reported for every 100,000 Americans that year. The line starts at zero, so its height shows the true size. In 2021 the FBI changed how it collects reports and fewer police departments sent numbers, so that year is less certain than the others.
Questions
- Find the year with the highest rate. About how much lower is the rate in the latest year?
- Many people say they think crime is rising. How could that belief and this chart both seem true to different people?
- Why might a change in how crimes are counted, like the one in 2021, make one year hard to compare with the rest?
Chart and numbers: chart.ly/charts/us-violent-crime-rate · More free charts at chart.ly
Chart 2 of 3 · World
How long do people around the world live, and how has that changed since 1960?
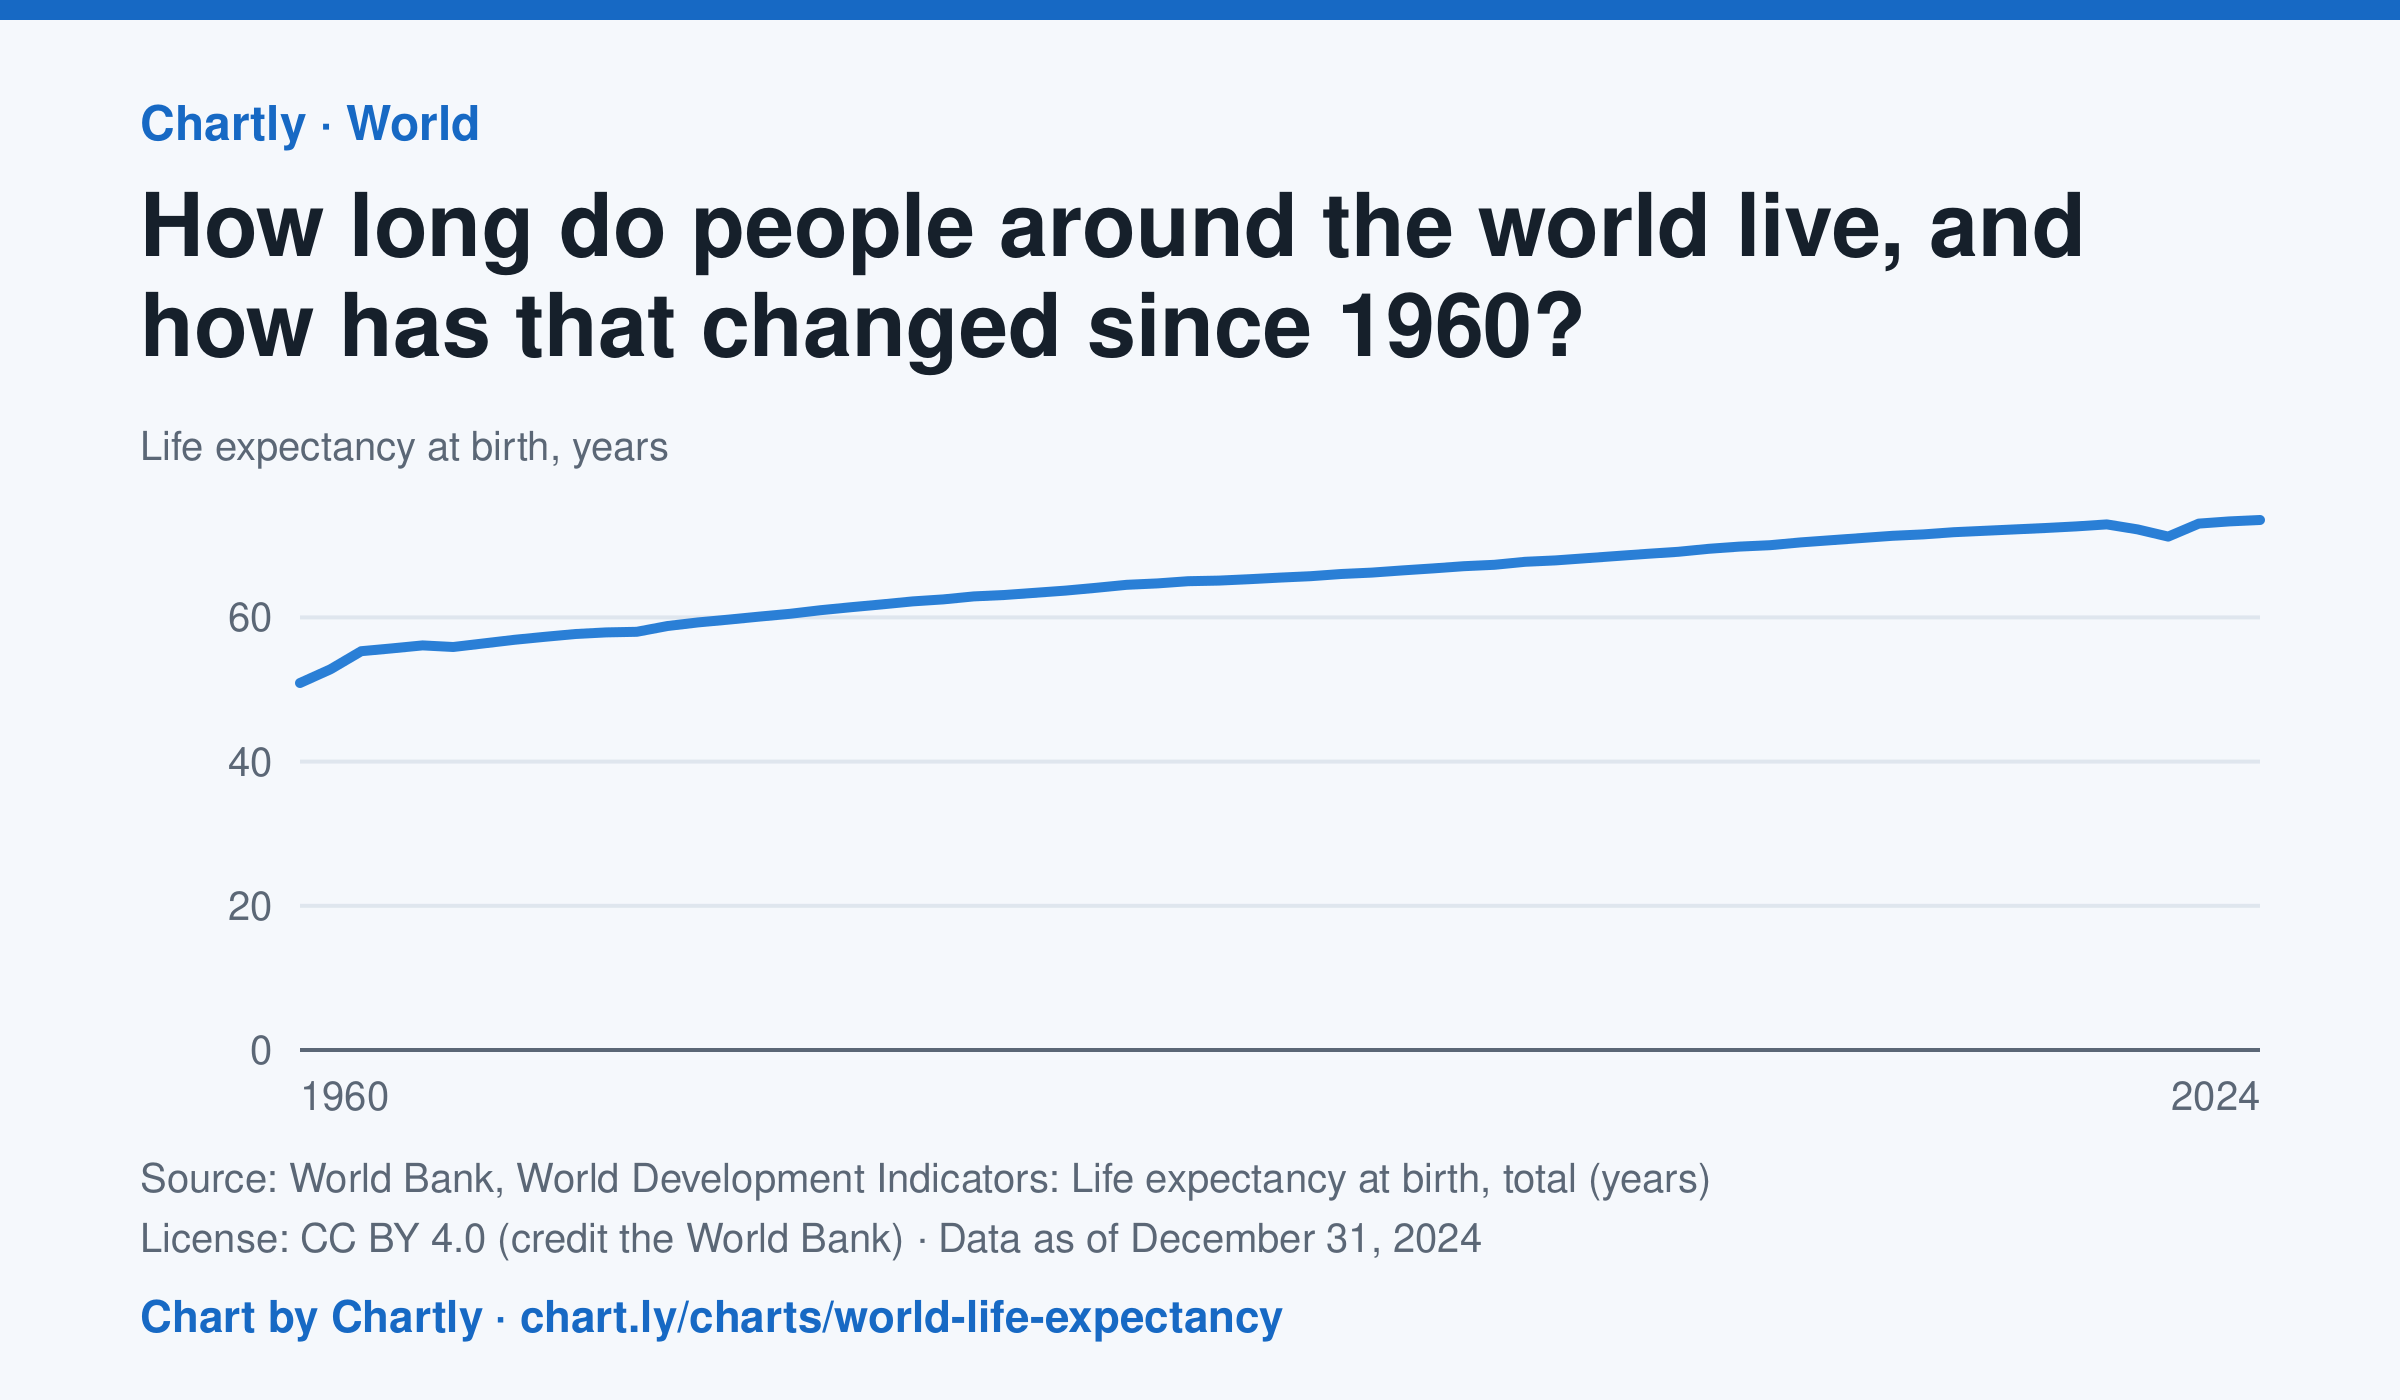
A baby born in 2024 could expect to live 73.5 years on average across the world, up from 50.9 in 1960. The very low early-1960s figures include the famine in China. Life expectancy fell to 71.2 years in 2021, during the COVID-19 pandemic, then recovered. These are United Nations estimates.
Source: World Bank, World Development Indicators: Life expectancy at birth, total (years) (CC BY 4.0 (credit the World Bank)) · Data as of Dec 31, 2024
How to read this chart
Each point is how long a baby born that year could expect to live, on average, across the whole world, if death rates stayed as they were. Because it averages every country, it rises when poorer countries cut deaths of babies and young children. The World Bank publishes the numbers.
Questions
- How many years did world life expectancy rise between the first year on the chart and the newest?
- Find a year when the line dipped. What happened in the world then?
- Compare this chart with the U.S. life expectancy lesson. Why might the world's average have risen faster?
Chart and numbers: chart.ly/charts/world-life-expectancy · More free charts at chart.ly
Chart 3 of 3 · World
How has the world's population grown since 1960?
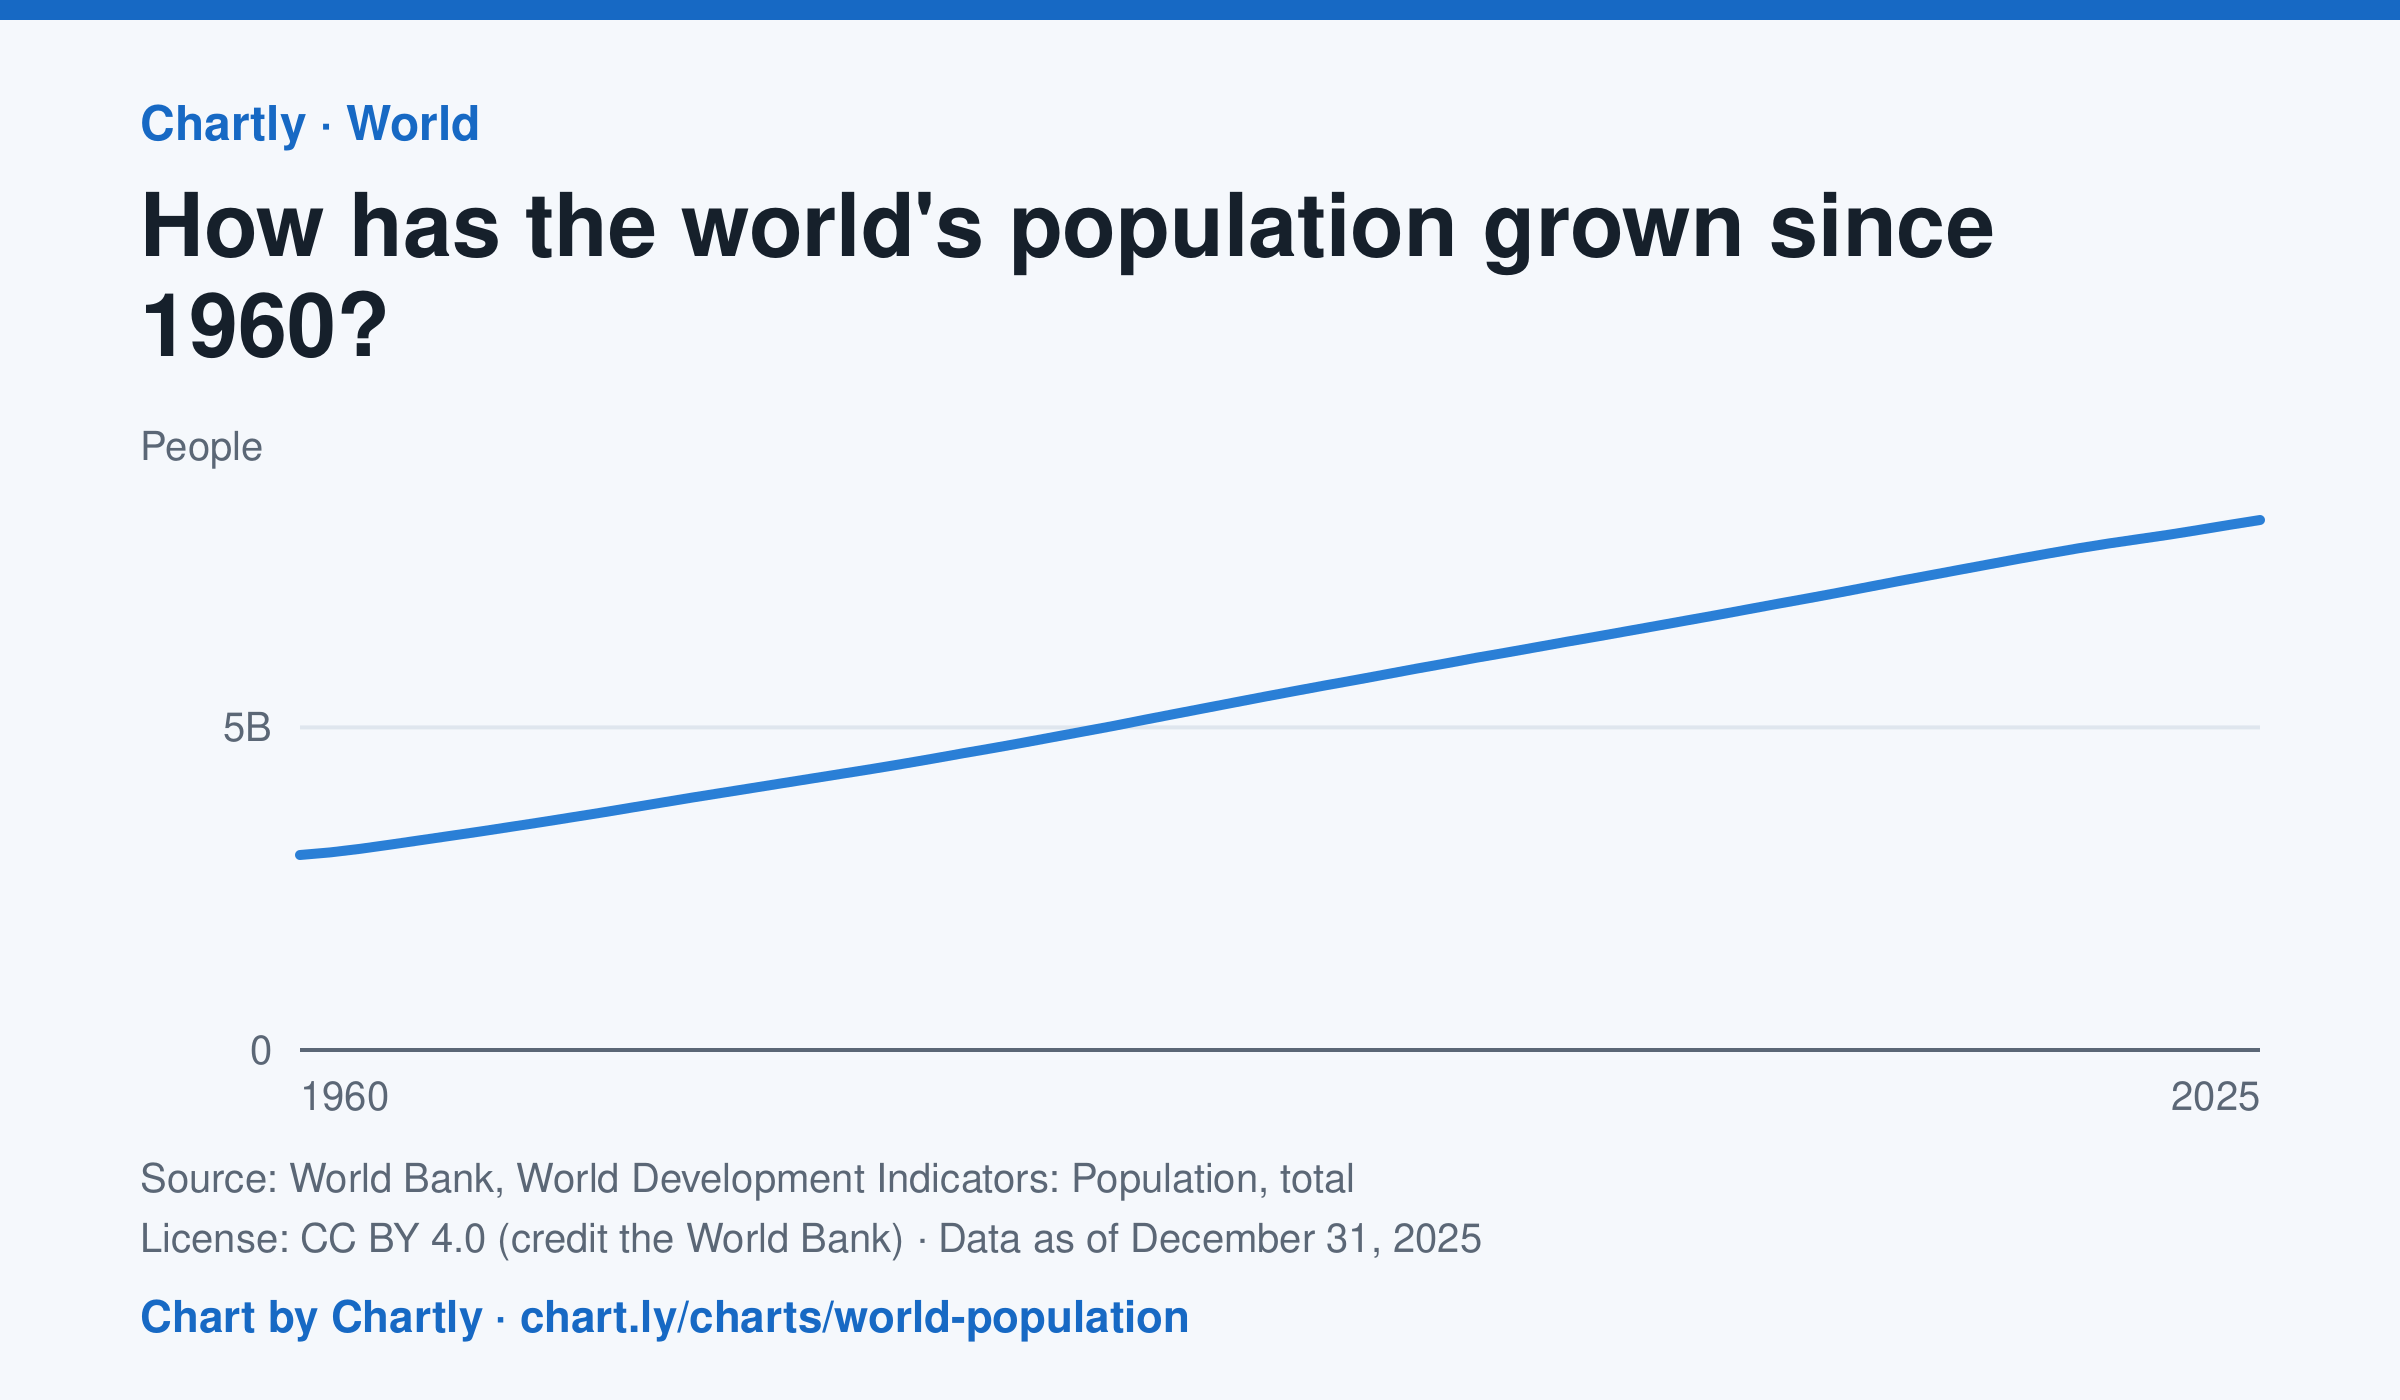
The world had 8.22 billion people in 2025, about 2.7 times the 3.02 billion of 1960. It passed 8 billion in 2023. Figures are mid-year estimates from the United Nations, which revises them as new censuses come in.
Source: World Bank, World Development Indicators: Population, total (CC BY 4.0 (credit the World Bank)) · Data as of Dec 31, 2025
How to read this chart
Each point is the number of people alive in the world in the middle of that year, estimated by the United Nations. The axis starts at zero, so the height of the line shows the true size. Look at how steep the line is to see how fast the population grew.
Questions
- Judging from the chart, about how many years did it take the world to add its most recent billion people?
- Is the line getting steeper or flatter in recent years? What does that tell you about the growth rate?
- These numbers are estimates that the UN revises. Why is it hard to count every person on Earth?
Chart and numbers: chart.ly/charts/world-population · More free charts at chart.ly