Print this worksheet, or choose "Save as PDF" in the print window to share a file.
Chart worksheet
Charts to read and discuss
Name:
Class:
Date:
Chart 1 of 3 · Health
How long do Americans live, and how has that changed since 1900?
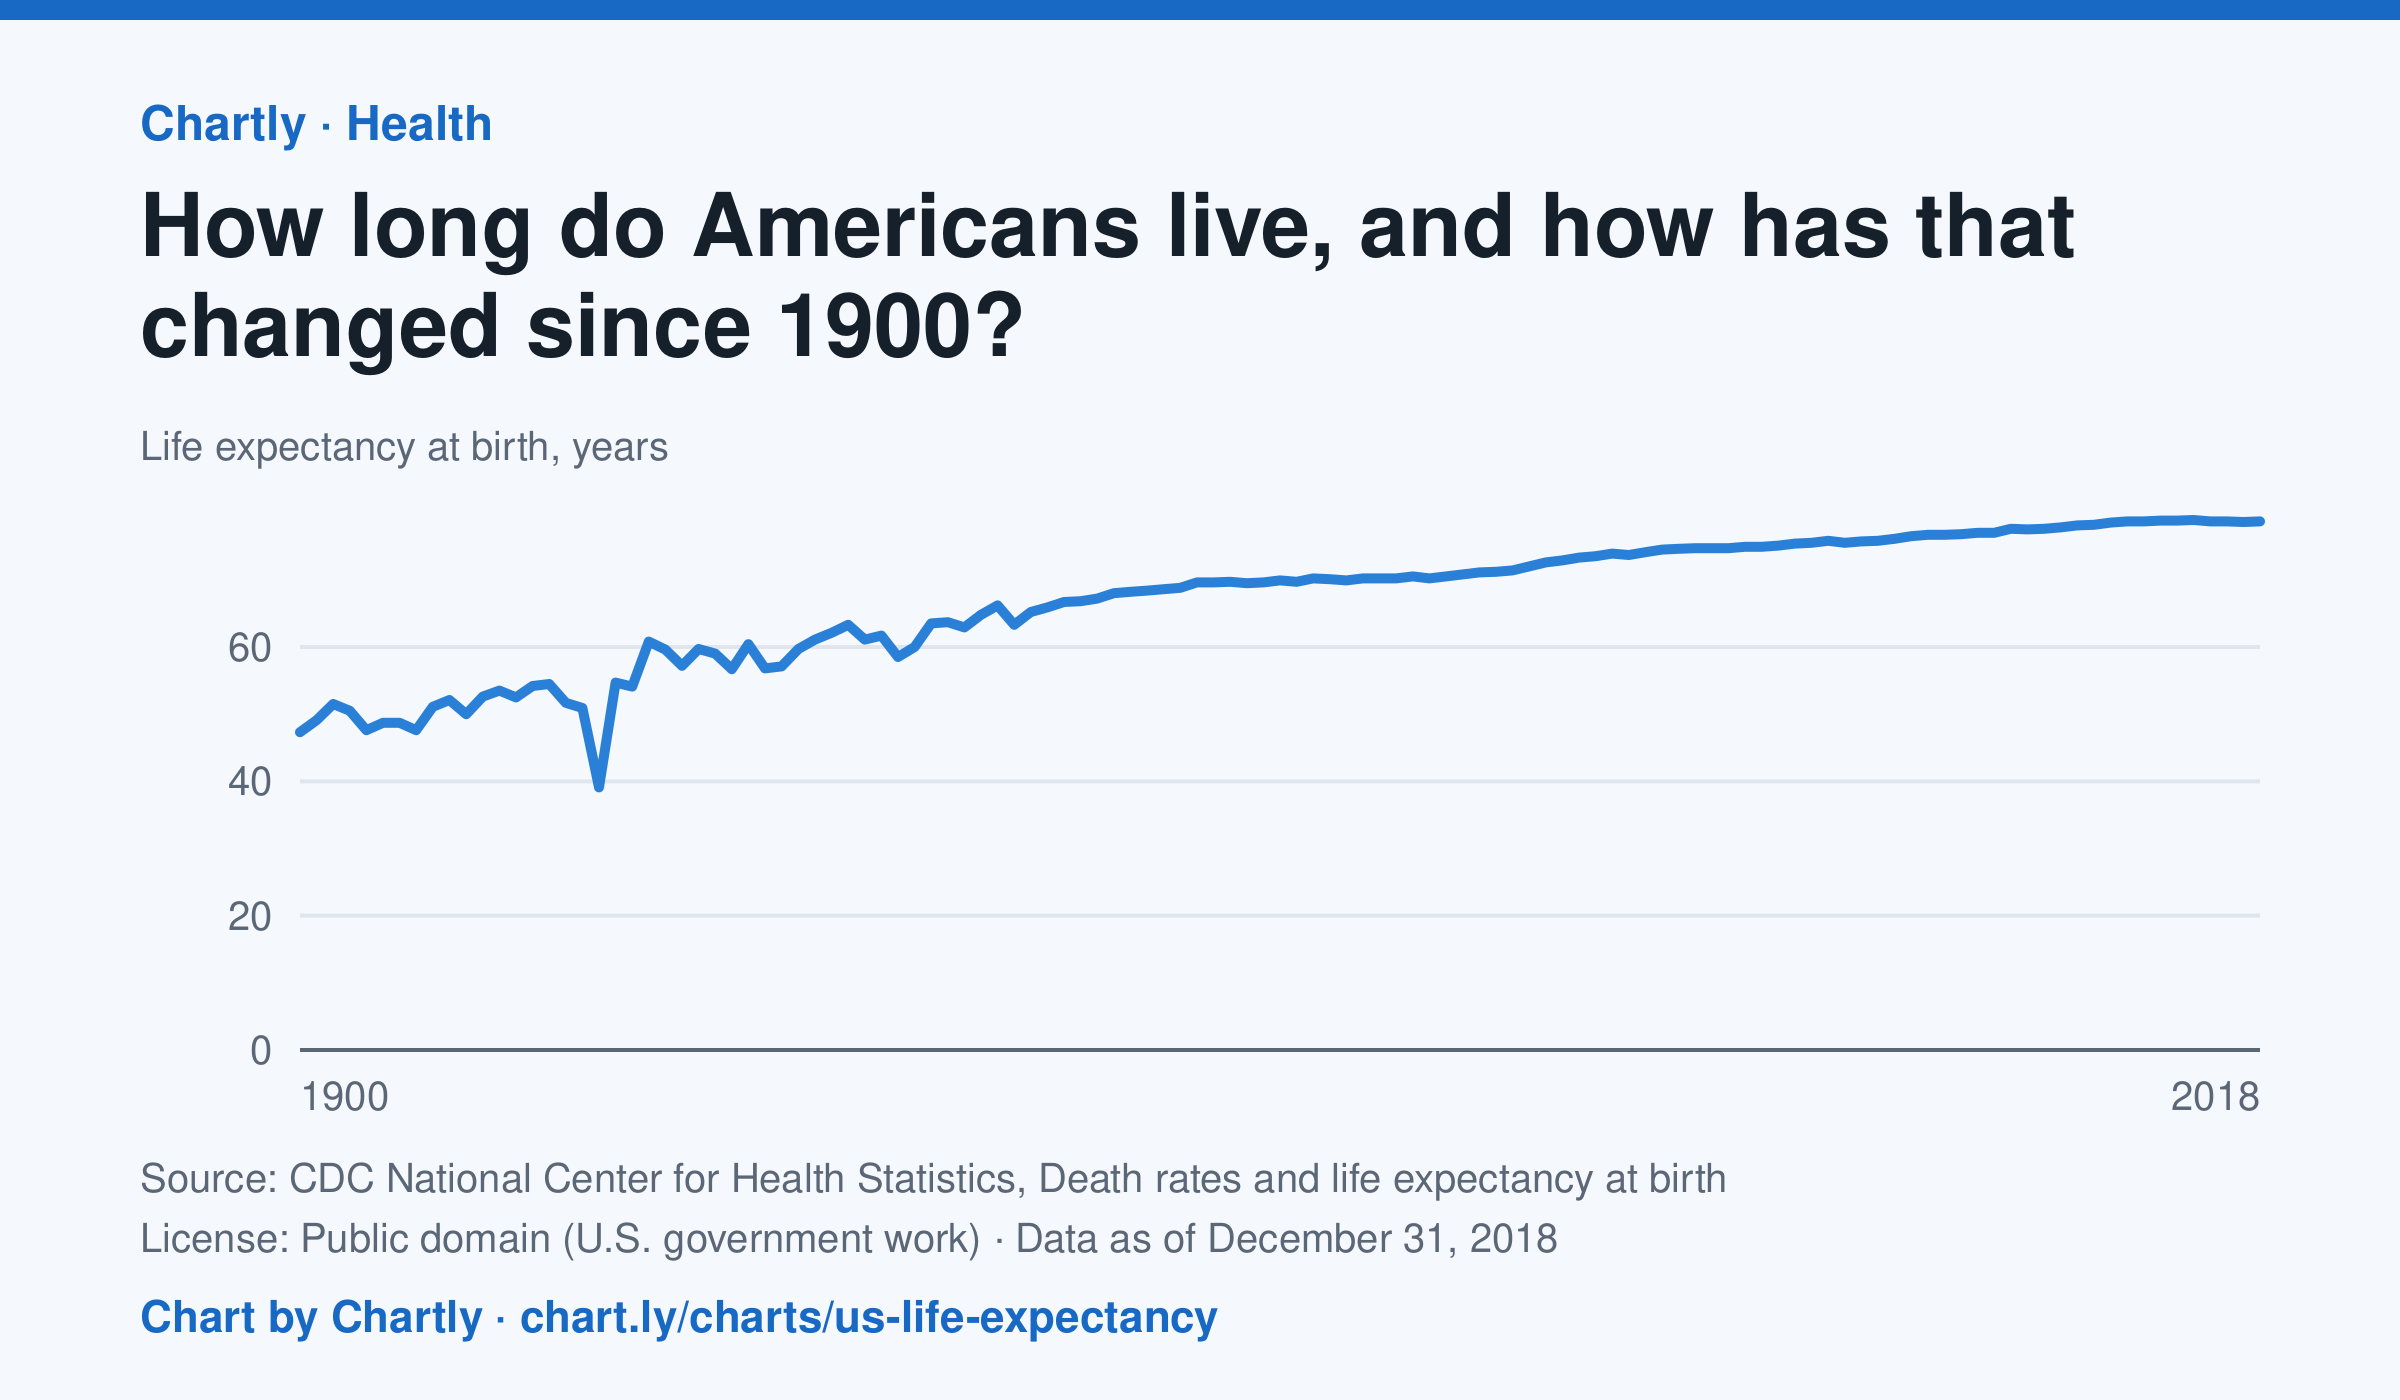
A baby born in the US in 2018 could expect to live 78.7 years, up from 47.3 in 1900. The sharpest drop was in 1918, to 39.1 years, during the influenza pandemic. This CDC dataset stops at 2018; later NCHS reports put life expectancy at 78.4 years in 2023 and 79.0 in 2024, after a fall during the COVID-19 pandemic.
Source: CDC National Center for Health Statistics, Death rates and life expectancy at birth (Public domain (U.S. government work)) · Data as of Dec 31, 2018
How to read this chart
Each point is how long a baby born in that year could expect to live, if death rates stayed as they were that year. It is an average, so it is pulled down a lot when many babies and young people die. Hover or tap a point to read its year and value.
Questions
- Find the sharpest drop on the chart. What happened in the world that year?
- Life expectancy in 1900 was under 50. Does that mean most adults died in their 40s? What else could lower the average?
- What changes in medicine, food or public health could explain the long rise?
Chart and numbers: chart.ly/charts/us-life-expectancy · More free charts at chart.ly
Chart 2 of 3 · World
How many people live in each country?
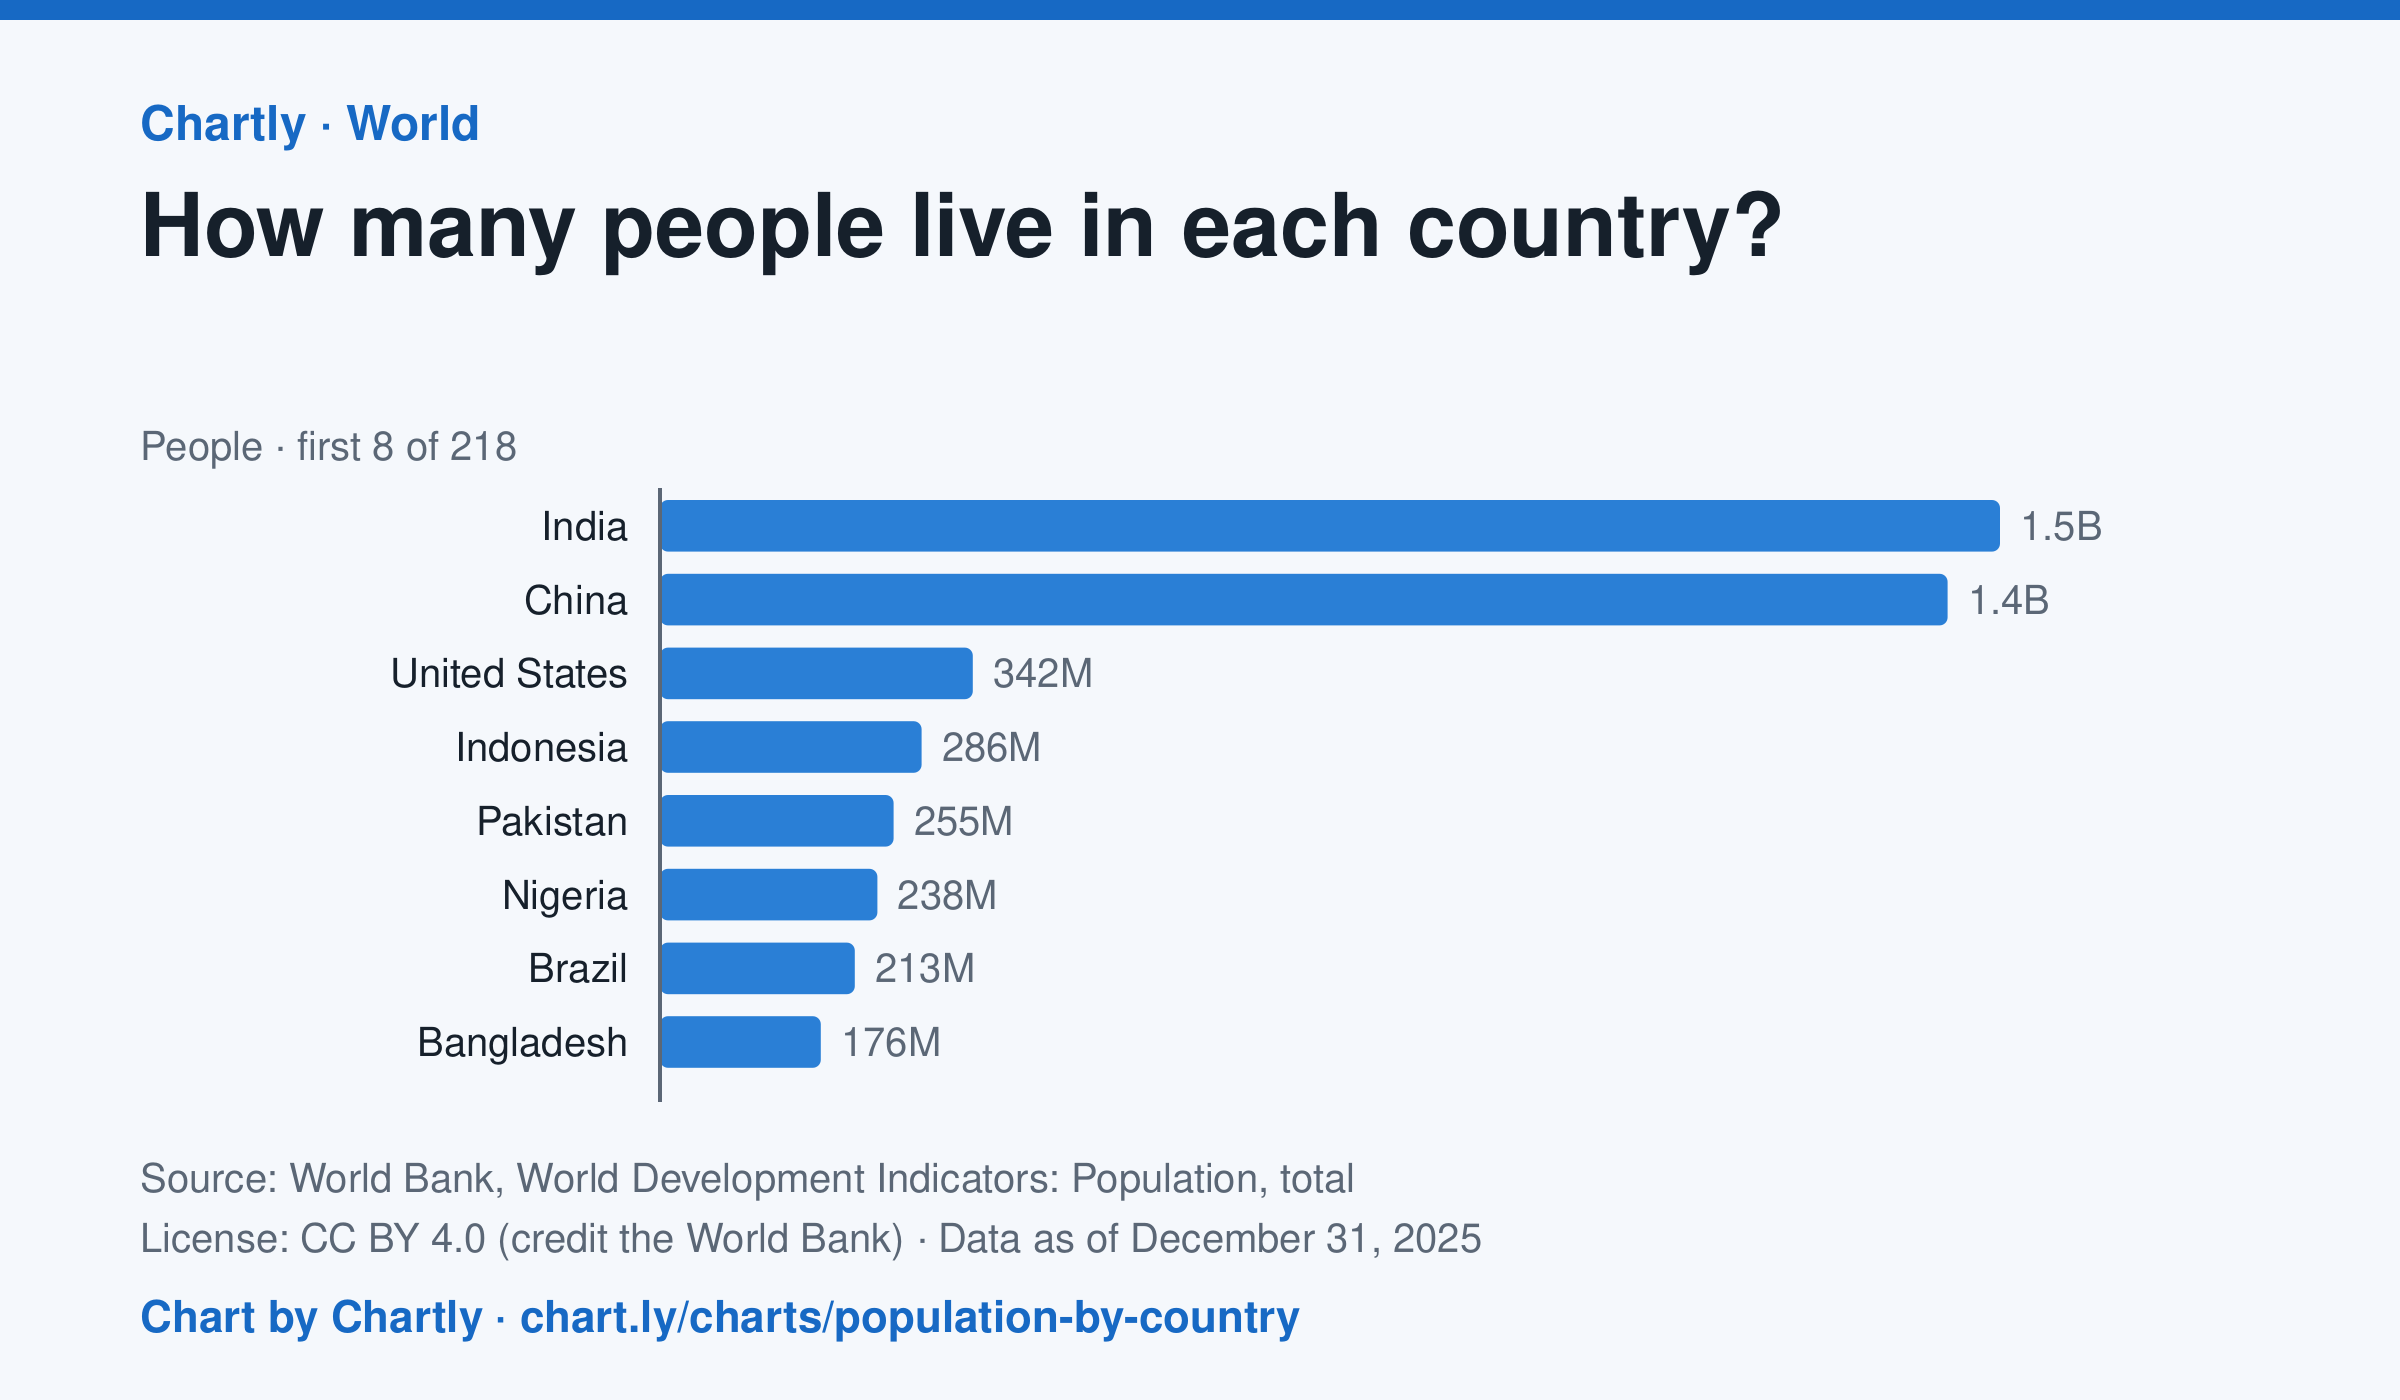
India, with 1.46 billion people in 2025, and China, with 1.41 billion, are far larger than any other country; the United States is third with 342 million. The smallest, Tuvalu, had about 9,500 people. Search 217 countries and territories. Figures are mid-year estimates, many from the United Nations.
Source: World Bank, World Development Indicators: Population, total (CC BY 4.0 (credit the World Bank)) · Data as of Dec 31, 2025
How to read this chart
Each bar is how many people lived in a country in a year, estimated by the United Nations and reported by the World Bank. On a phone the chart opens on the 10 biggest and smallest; search for any country. The bars start at zero, so a bar twice as long means twice as many people.
Questions
- Which two countries have the most people, and how far ahead are they of the third?
- About what share of the world's people live in the top two countries?
- A country with many people isn't always crowded. What other number would you need to know how crowded it is?
Chart and numbers: chart.ly/charts/population-by-country · More free charts at chart.ly
Chart 3 of 3 · World
How fast has the world come online?
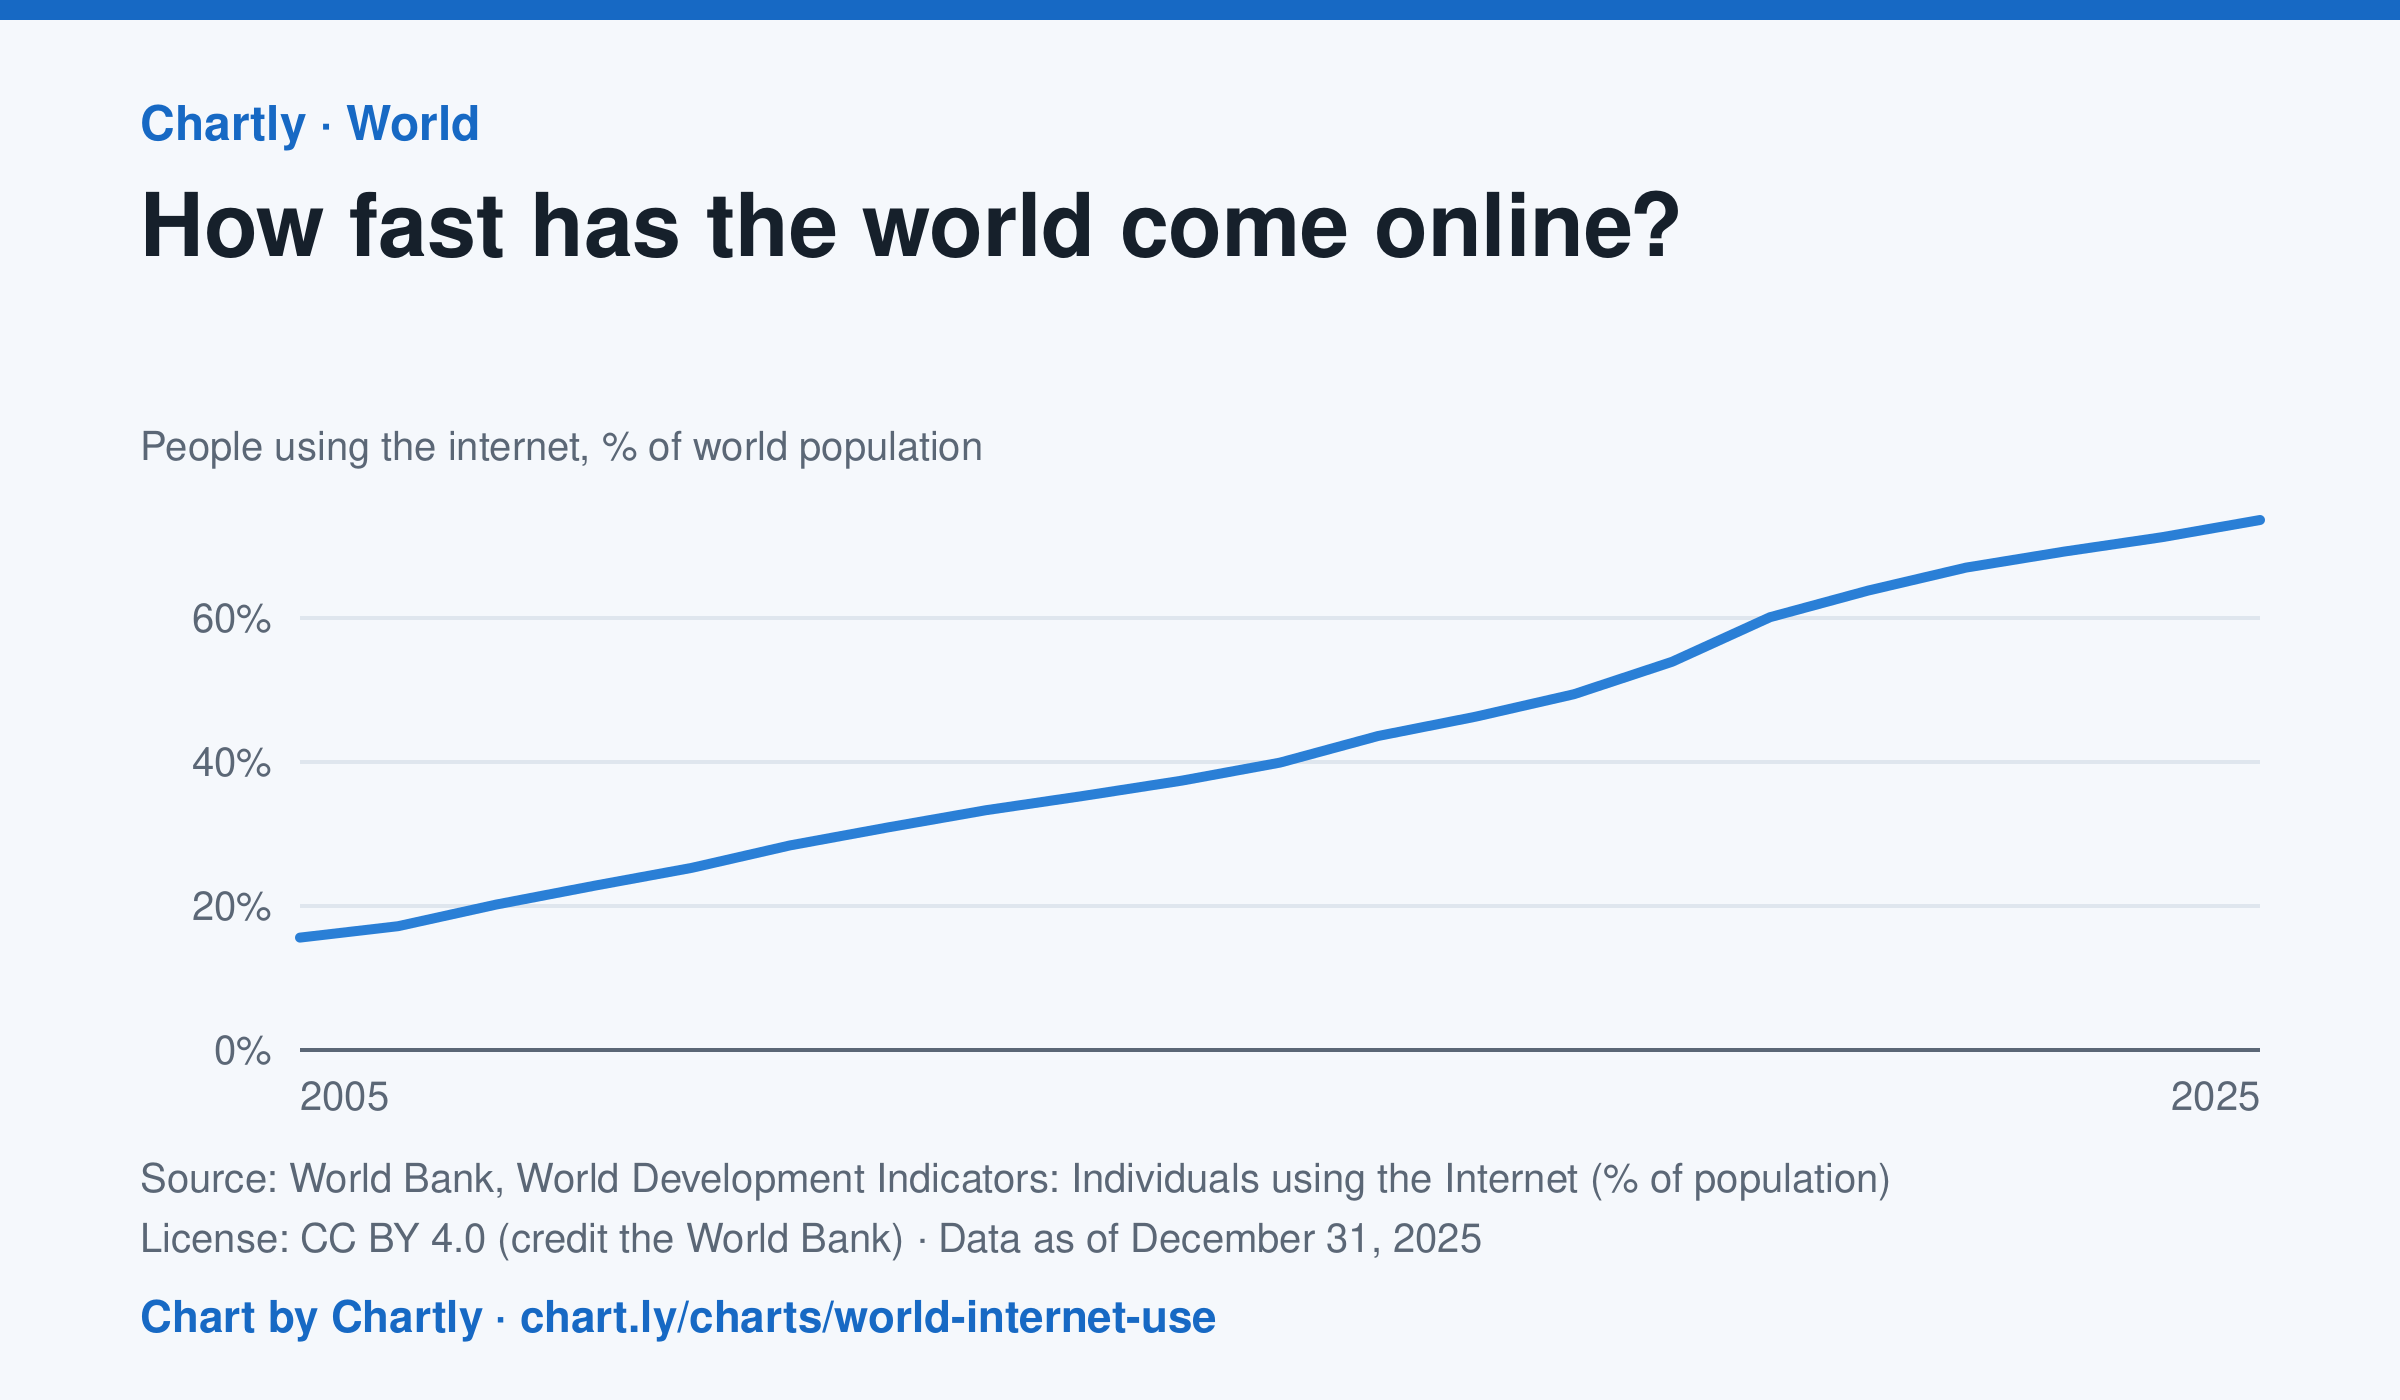
73.6% of the world's people used the internet in 2025, up from 15.6% in 2005, the first year the World Bank gives a world figure. It counts people who used the internet at least once in the previous three months. The world figures are estimates by the International Telecommunication Union.
Source: World Bank, World Development Indicators: Individuals using the Internet (% of population) (CC BY 4.0 (credit the World Bank)) · Data as of Dec 31, 2025
How to read this chart
Each point is the share of the world's people who used the internet at least once in the previous three months, as estimated by the International Telecommunication Union. The axis starts at zero, so the height shows the true share. The steeper the line, the faster people were coming online.
Questions
- About what share of the world was online in the first year on the chart, and in the latest year?
- Did the share grow faster in some years than others? What could have sped it up?
- Using the internet once in three months counts here. What does this number leave out about how people get online?
Chart and numbers: chart.ly/charts/world-internet-use · More free charts at chart.ly