Print this worksheet, or choose "Save as PDF" in the print window to share a file.
Chart worksheet
Charts to read and discuss
Name:
Class:
Date:
Chart 1 of 3 · Health
How long do Americans live, and how has that changed since 1900?
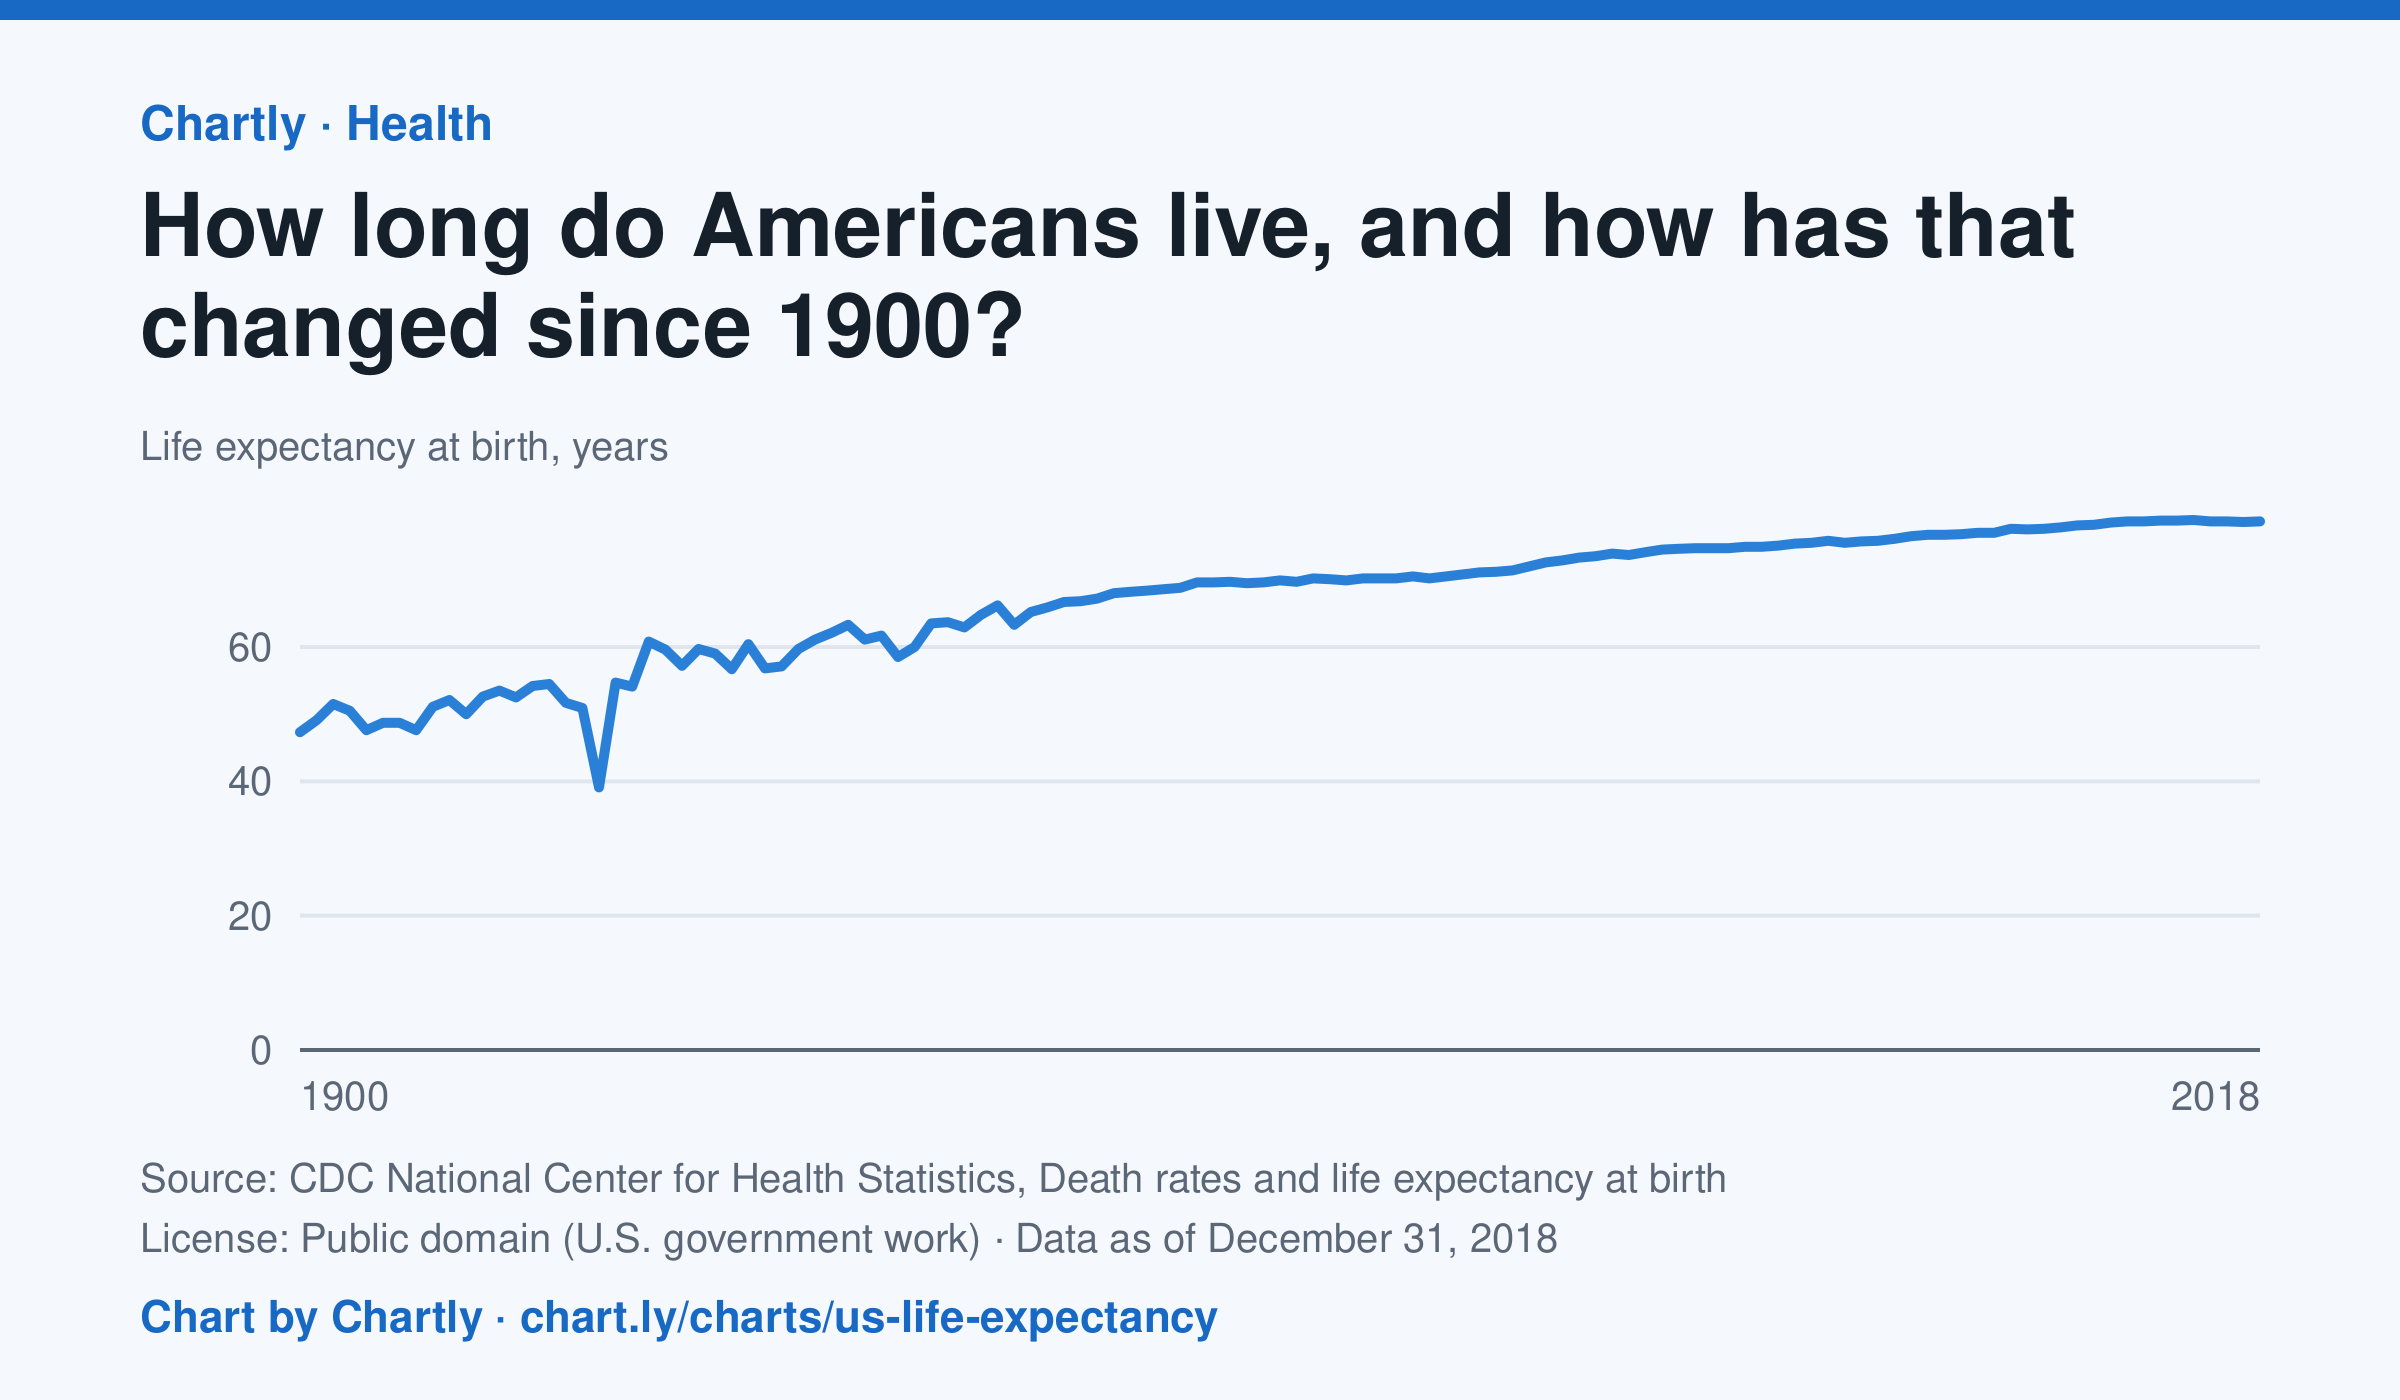
A baby born in the US in 2018 could expect to live 78.7 years, up from 47.3 in 1900. The sharpest drop was in 1918, to 39.1 years, during the influenza pandemic. This CDC dataset stops at 2018; later NCHS reports put life expectancy at 78.4 years in 2023 and 79.0 in 2024, after a fall during the COVID-19 pandemic.
Source: CDC National Center for Health Statistics, Death rates and life expectancy at birth (Public domain (U.S. government work)) · Data as of Dec 31, 2018
How to read this chart
Each point is how long a baby born in that year could expect to live, if death rates stayed as they were that year. It is an average, so it is pulled down a lot when many babies and young people die. Hover or tap a point to read its year and value.
Questions
- Find the sharpest drop on the chart. What happened in the world that year?
- Life expectancy in 1900 was under 50. Does that mean most adults died in their 40s? What else could lower the average?
- What changes in medicine, food or public health could explain the long rise?
Chart and numbers: chart.ly/charts/us-life-expectancy · More free charts at chart.ly
Chart 2 of 3 · Space
How many planets outside our solar system are discovered each year?
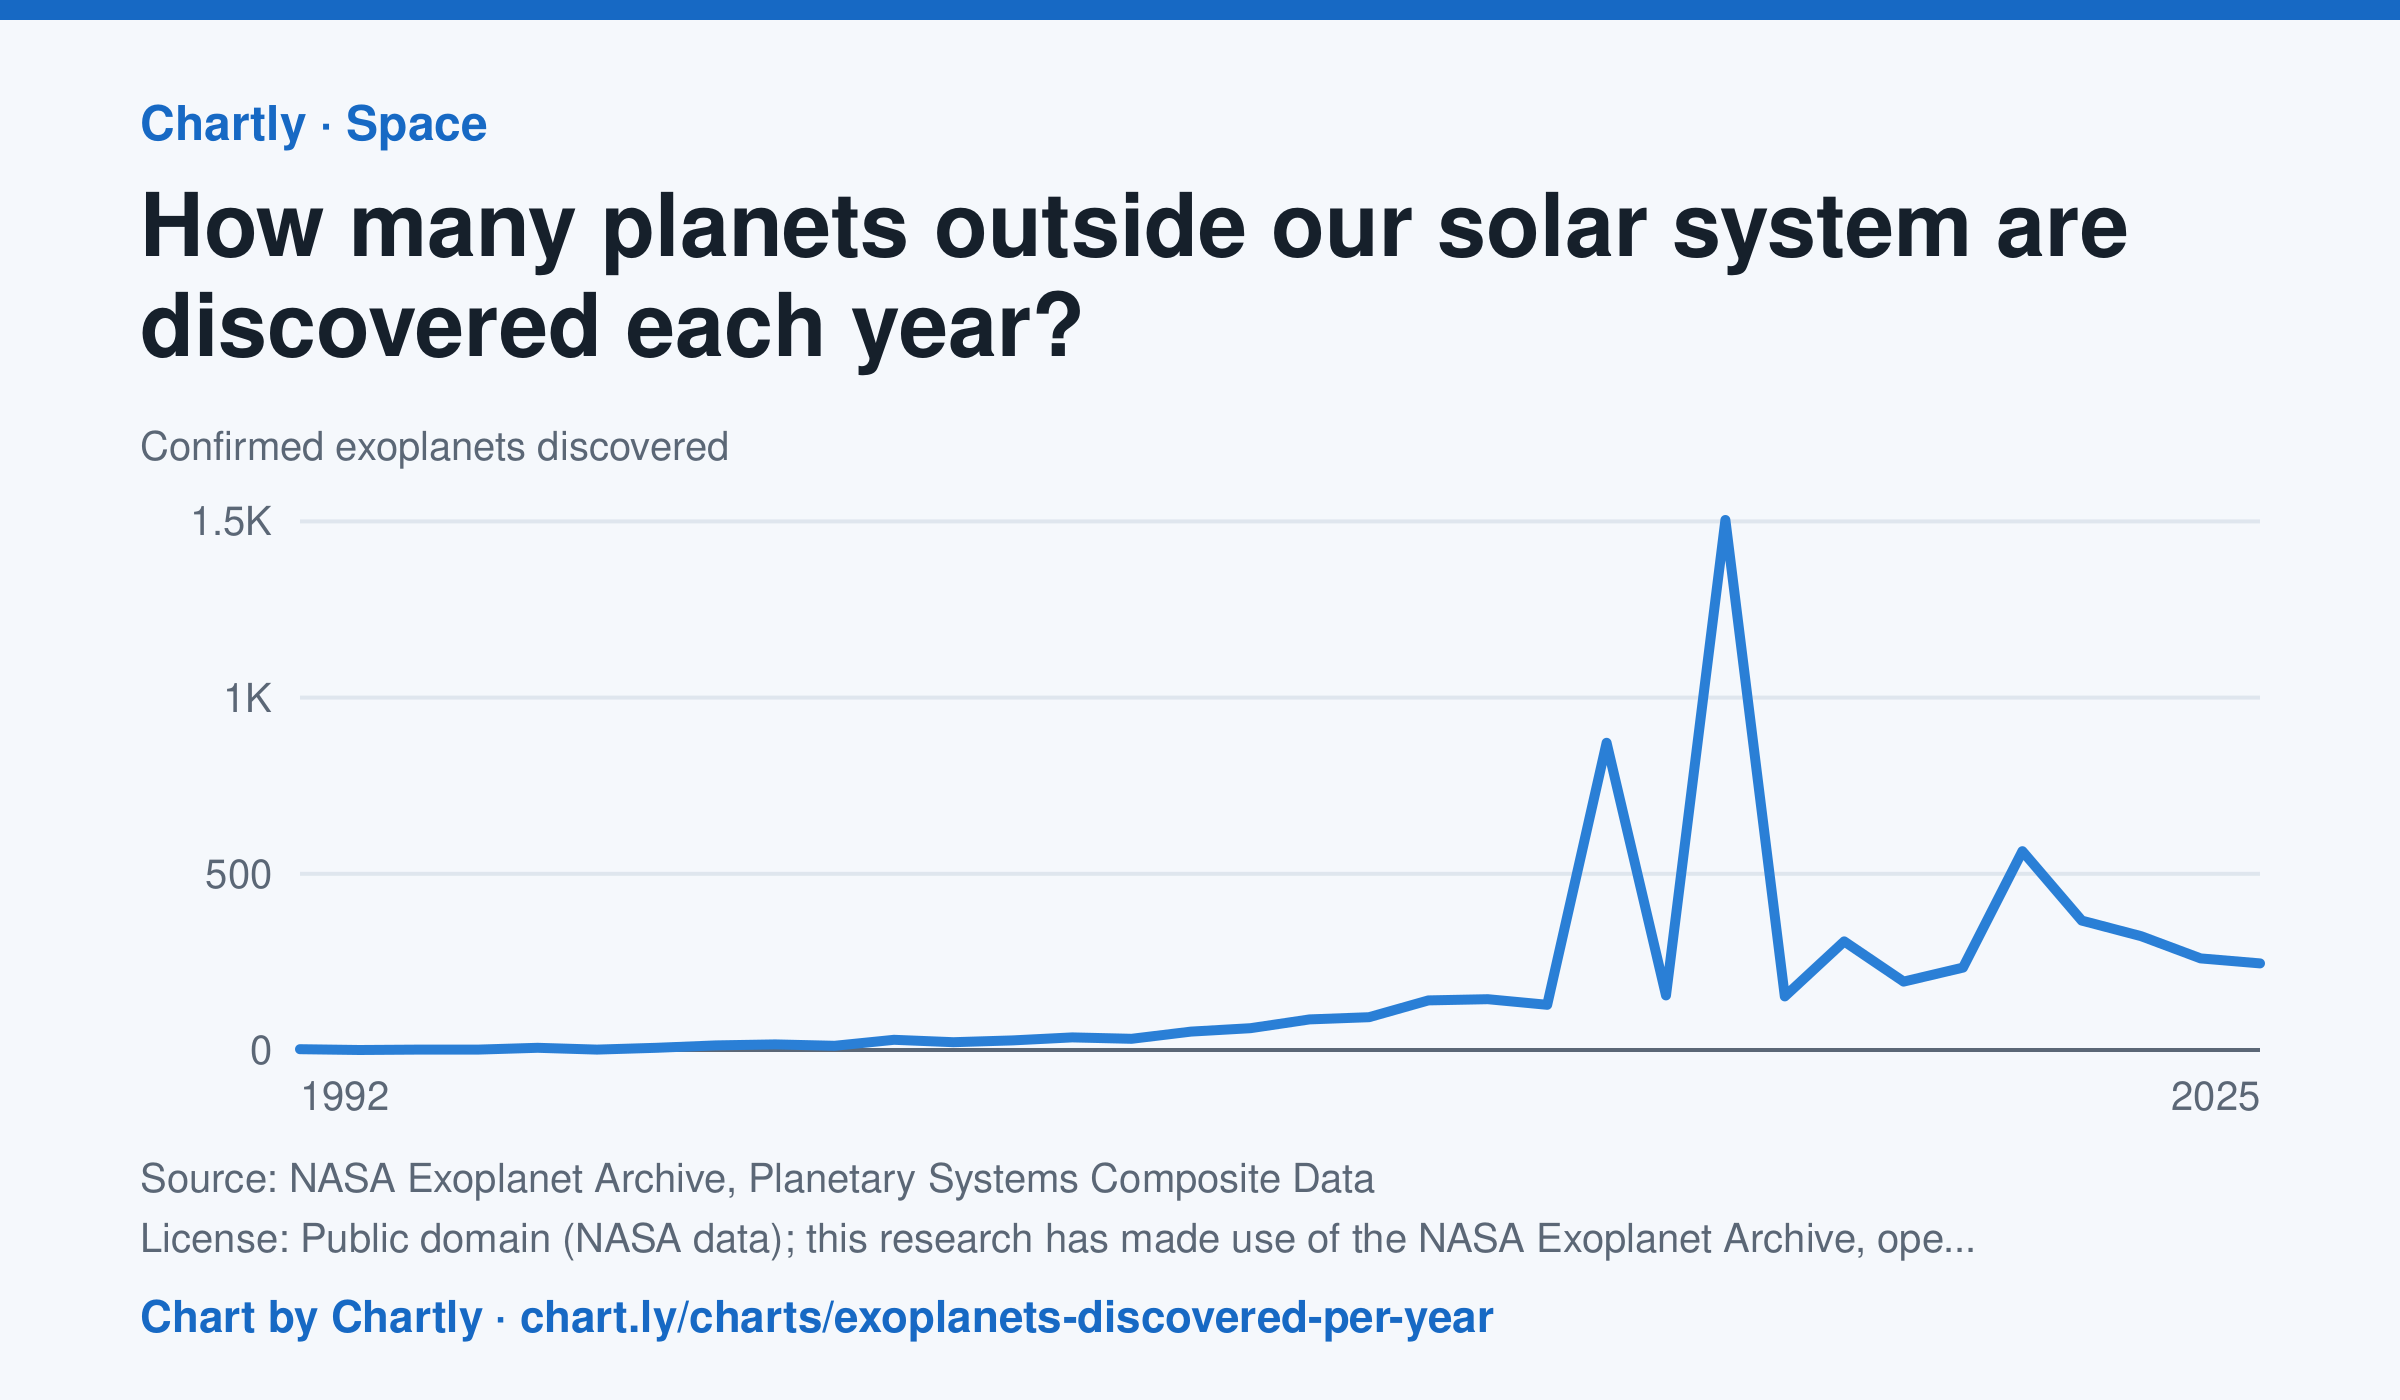
Astronomers confirmed 245 new planets around other stars in 2025. The first were found in 1992, and the count leaped in 2014 and 2016 (872 and 1,504), when NASA's Kepler team confirmed hundreds of its candidates at once. The archive counts a planet in the year its discovery was published and keeps adding late confirmations, so recent years can still rise.
Source: NASA Exoplanet Archive, Planetary Systems Composite Data (Public domain (NASA data); this research has made use of the NASA Exoplanet Archive, operated by Caltech under contract with NASA) · Data as of Dec 31, 2025
How to read this chart
Each point is how many planets around other stars, called exoplanets, astronomers confirmed in a year. The count depends on telescopes as much as on the sky: a new space telescope can confirm hundreds at once. The numbers come from NASA's Exoplanet Archive.
Questions
- Find the two biggest jumps on the chart. What could cause so many planets to be confirmed in one year?
- How many planets were confirmed in the first year on the chart, and how many in the newest year?
- Does a big year on this chart mean there were more planets in space that year? What does it really measure?
Chart and numbers: chart.ly/charts/exoplanets-discovered-per-year · More free charts at chart.ly
Chart 3 of 3 · Jobs and wages
What is the US unemployment rate?
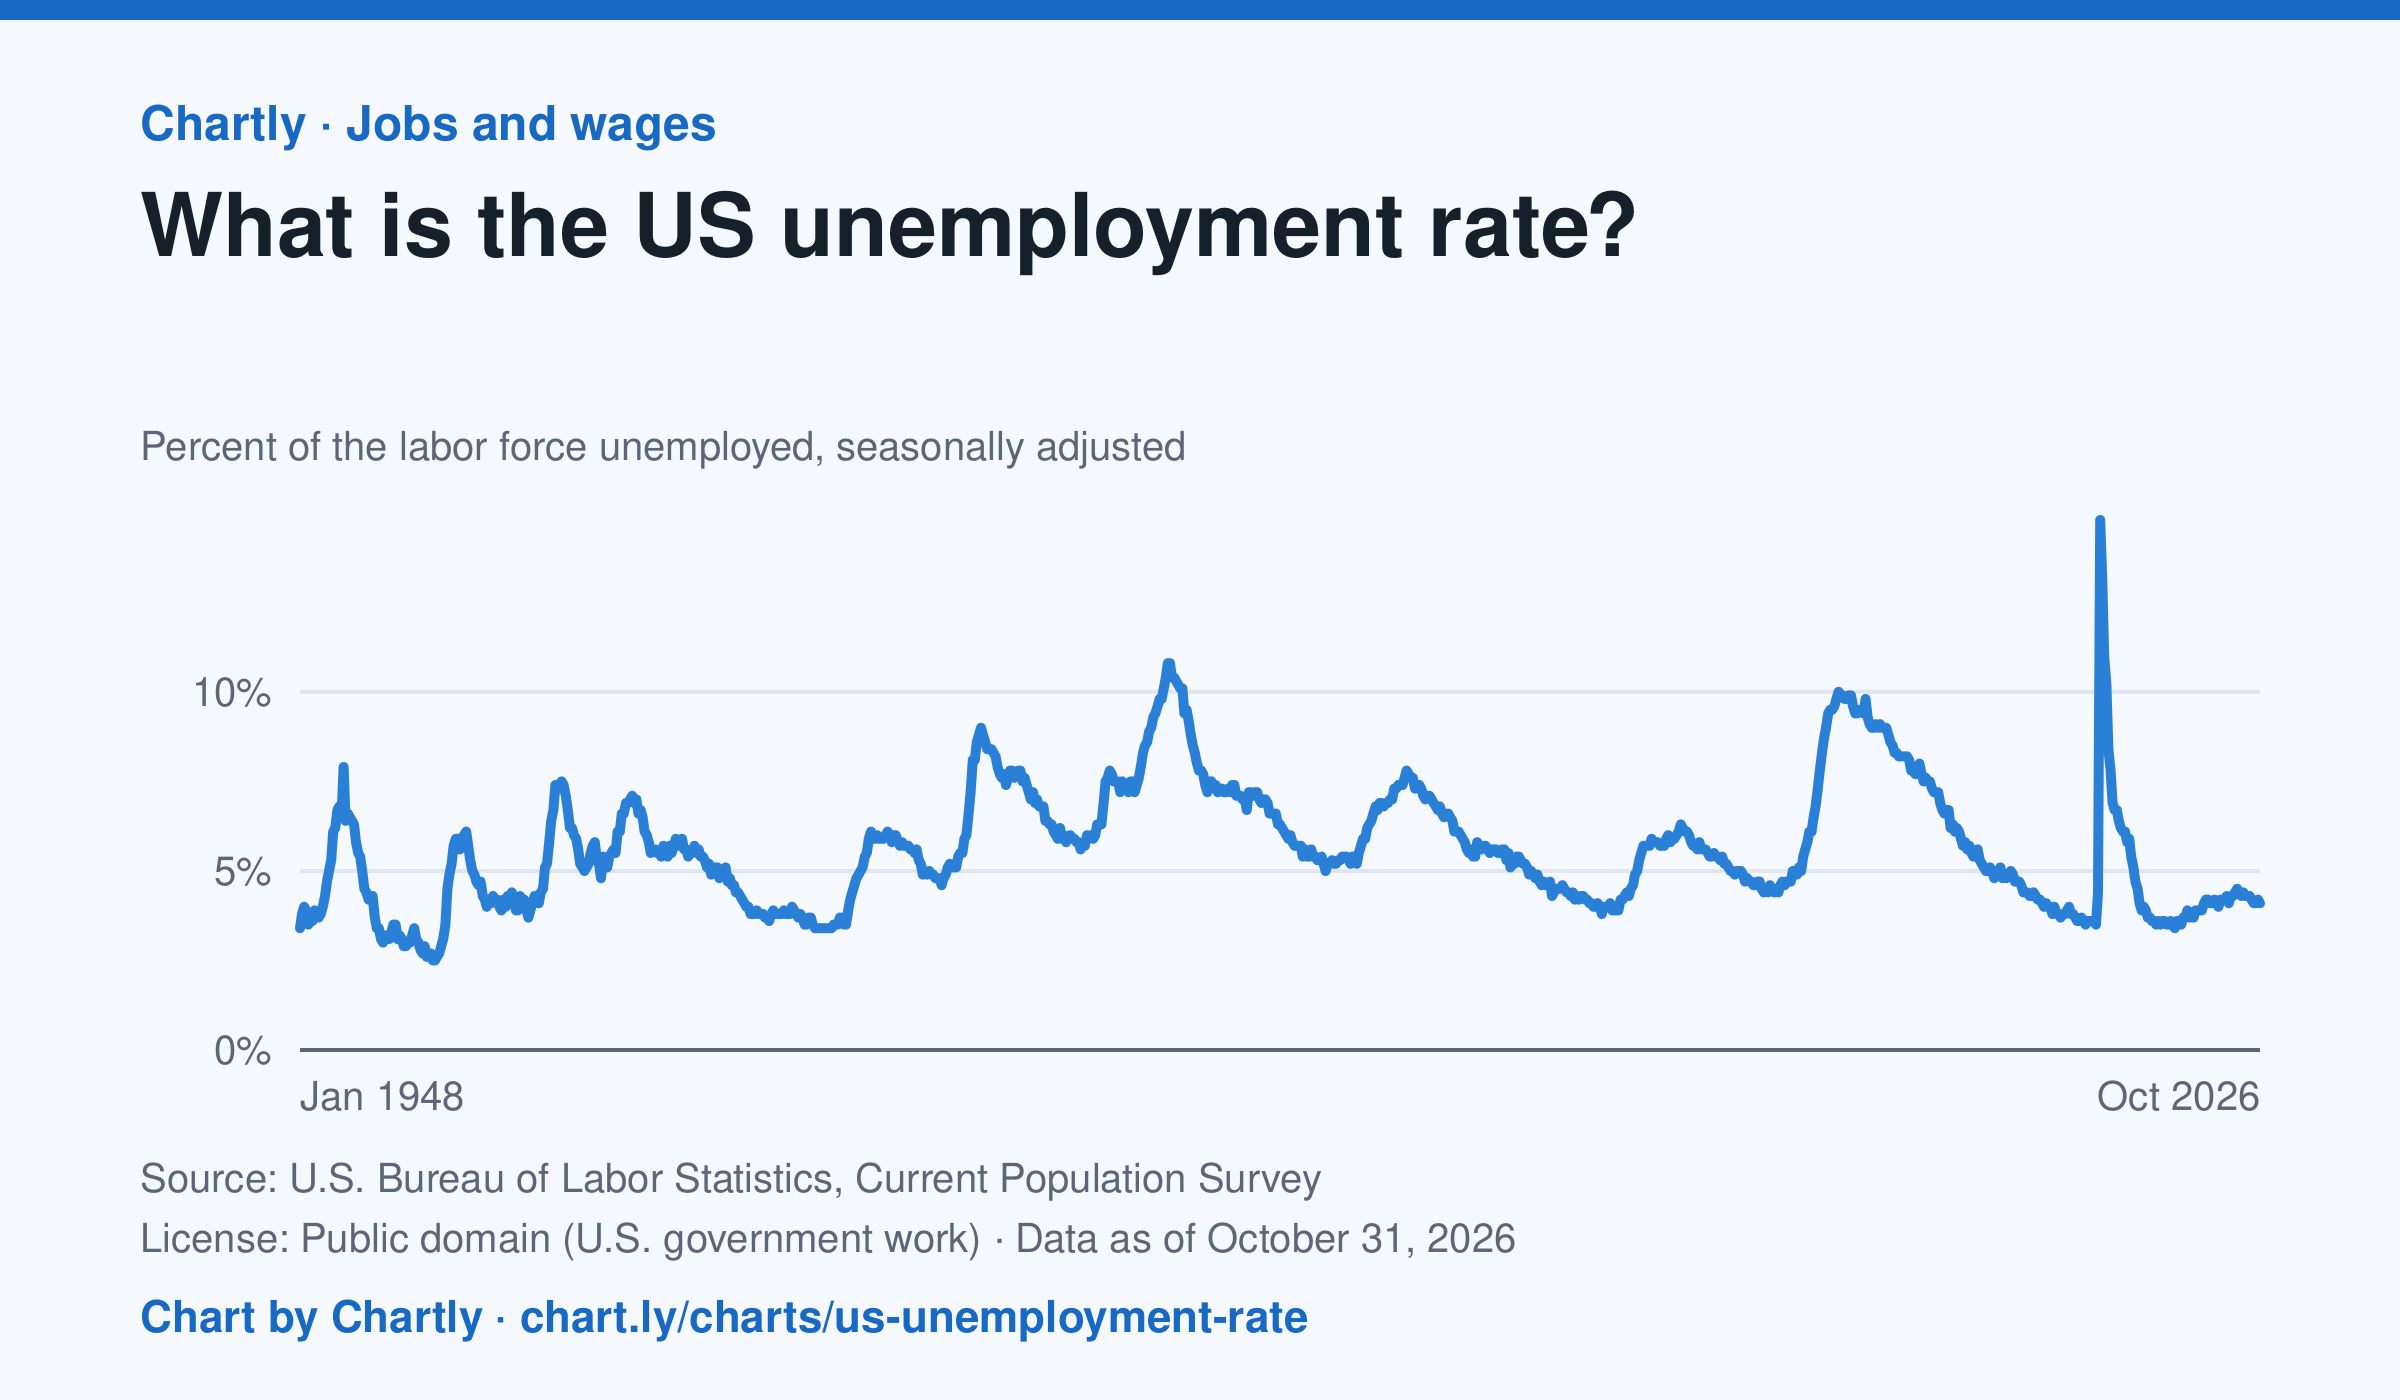
4.1% of the US labor force was unemployed in October 2026, against 4.4% in September 2025. Since the monthly rate began in 1948 it peaked at 14.8% in April 2020, at the start of the pandemic, and was lowest at 2.5% in May 1953. October 2025 is missing because a lapse in federal funding stopped the survey.
Source: U.S. Bureau of Labor Statistics, Current Population Survey (Public domain (U.S. government work)) · Data as of Oct 31, 2026
How to read this chart
Each point is the share of the labor force without a job in one month: people who have no work, are available and looked for a job in the past four weeks. People who aren't looking, such as retirees and most students, aren't in the labor force, so they don't count as unemployed. The numbers are seasonally adjusted, so the usual jump when school ends doesn't show up as bad news.
Questions
- Find the three highest peaks on the chart. What was happening in the economy at each one?
- How long did it take the rate to come back down after each peak? Was the recovery faster or slower than the rise?
- Someone who gives up looking for work stops counting as unemployed. How could that make the rate look better than things really are?
Chart and numbers: chart.ly/charts/us-unemployment-rate · More free charts at chart.ly