Print this worksheet, or choose "Save as PDF" in the print window to share a file.
Chart worksheet
Charts to read and discuss
Name:
Class:
Date:
Chart 1 of 2 · Jobs and wages
How many jobs did the US add each month?
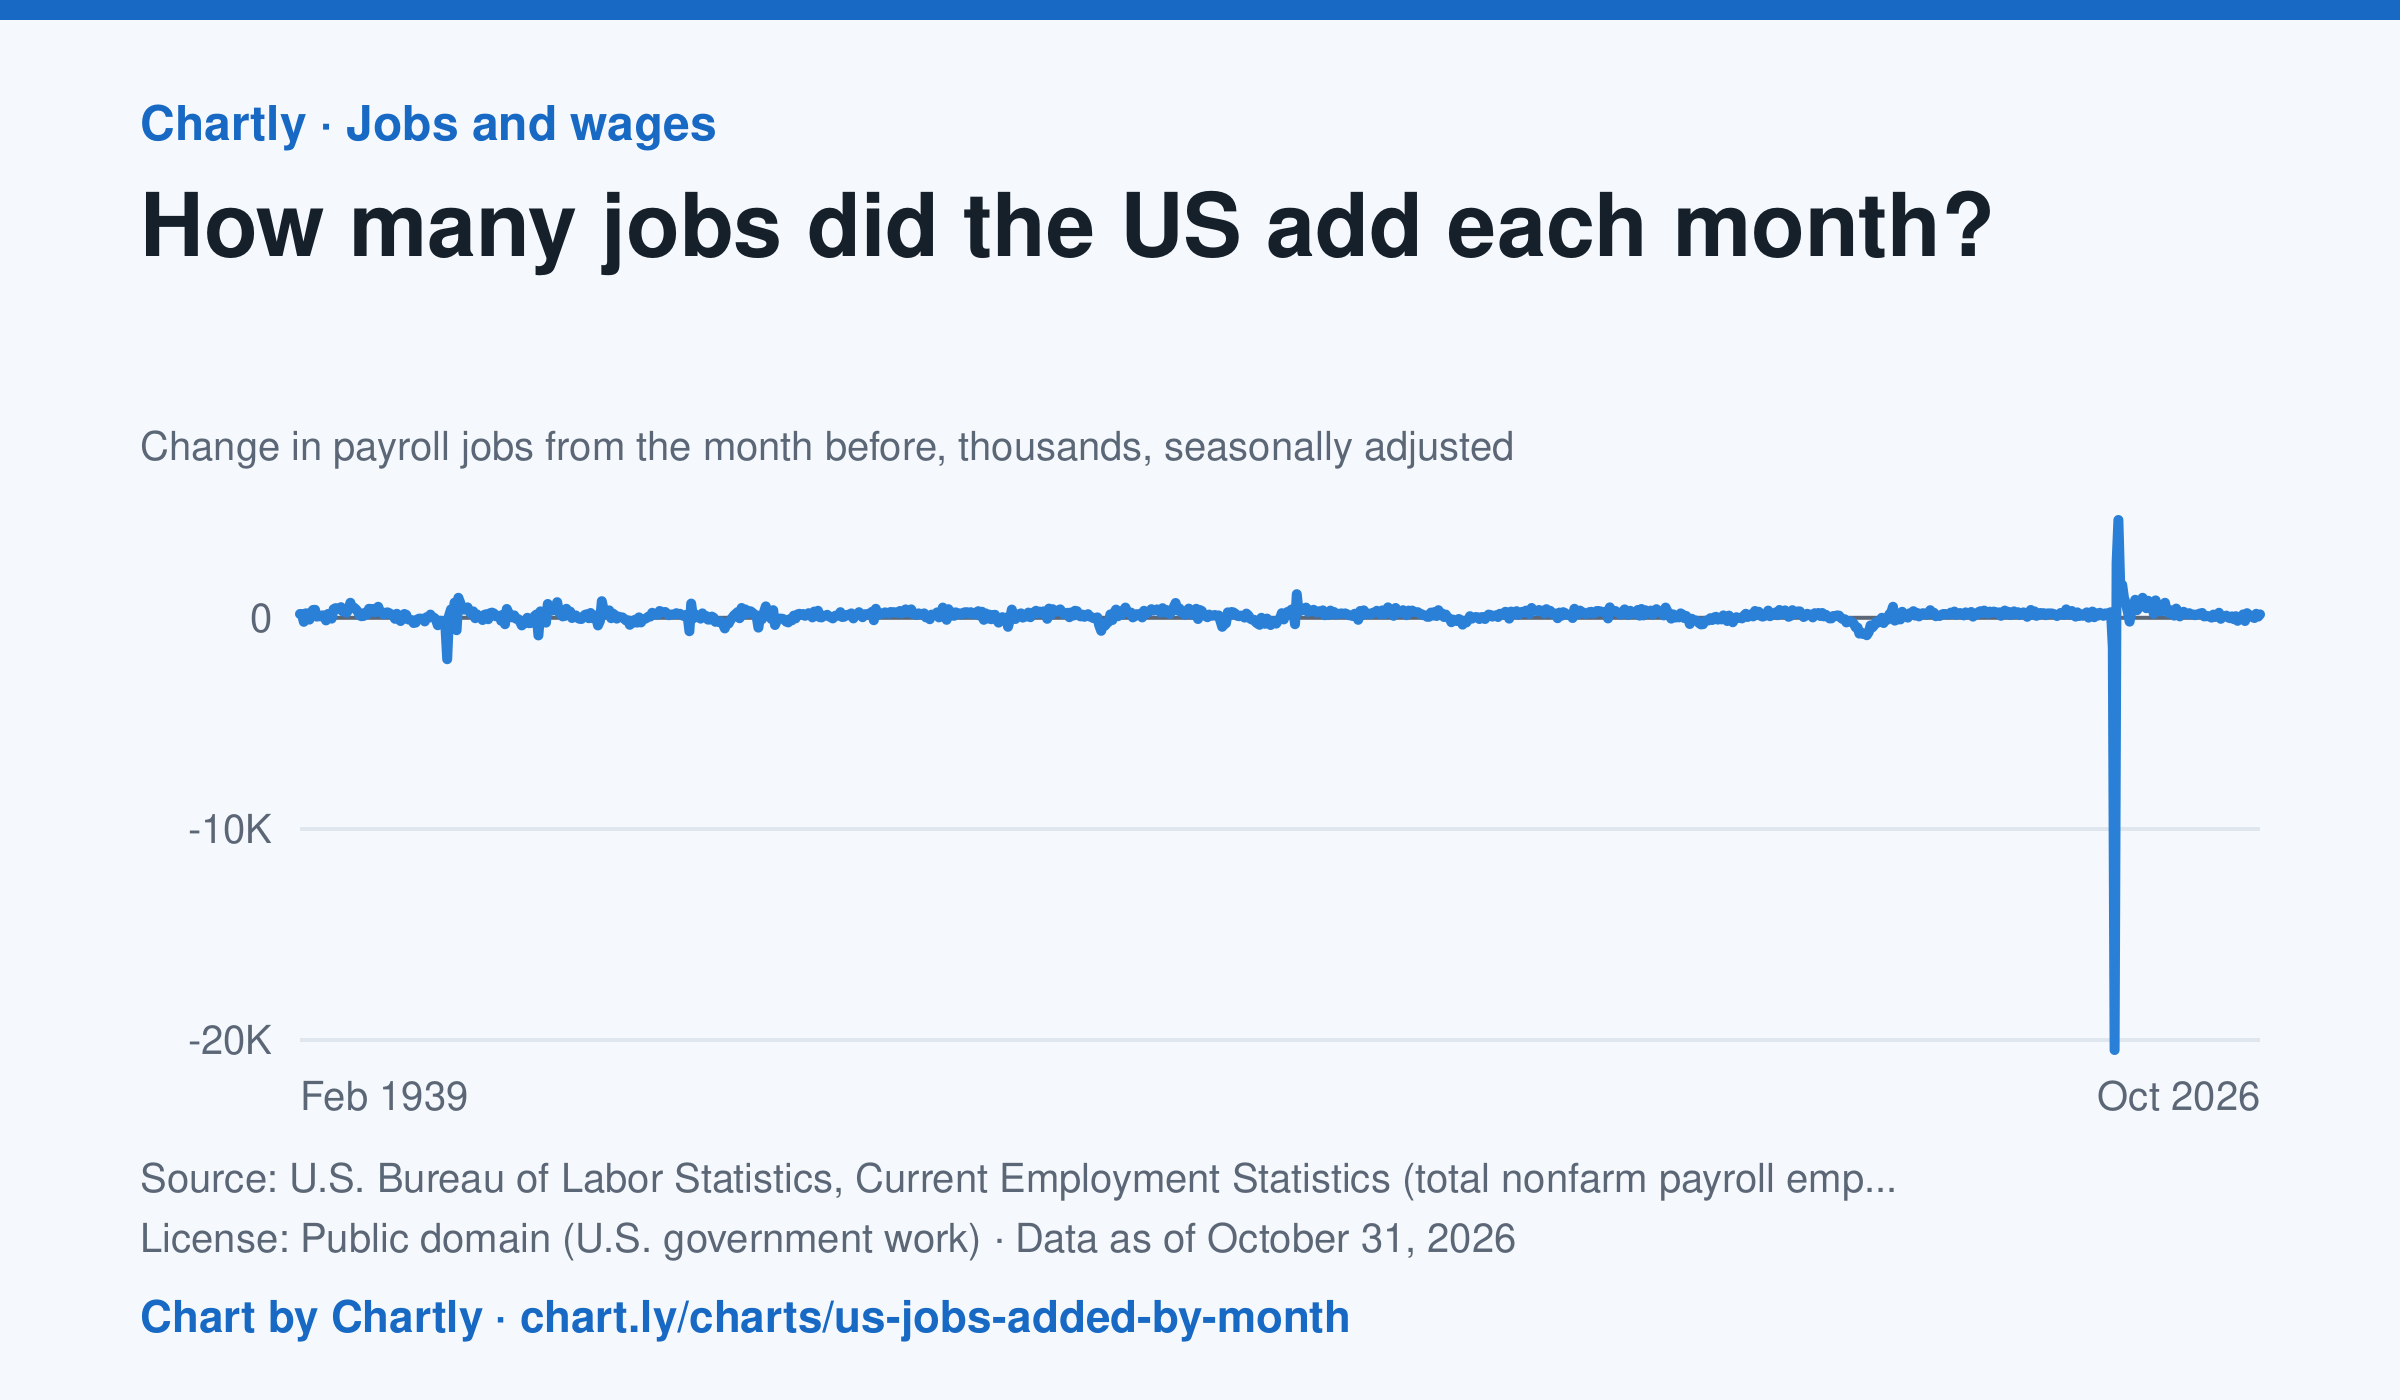
U.S. employers added 165 thousand jobs in October 2026, by the latest estimate, after adding 60 thousand in September 2026. Each point is the change in the number of jobs on payrolls from the month before, the headline figure of the monthly jobs report. Since 1939 the biggest loss was 20,469 thousand jobs in April 2020, when the pandemic closed businesses, and the biggest gain was 4,631 thousand in June 2020, as they reopened. BLS revises each month's figure in each of the next two reports as more employers answer, and once a year against unemployment insurance tax records.
Source: U.S. Bureau of Labor Statistics, Current Employment Statistics (total nonfarm payroll employment) (Public domain (U.S. government work)) · Data as of Oct 31, 2026
How to read this chart
Each point is how many jobs U.S. employers added or cut in one month, in thousands, compared with the month before. Points above zero mean more jobs; points below zero mean jobs were lost. This is the headline number of the monthly jobs report, and the newest months are estimates that get revised as more surveys come in.
Questions
- Find the lowest point on the chart. What happened that month, and how quickly did jobs come back?
- Count how many of the last 12 months were above zero. What does that tell you about the economy right now?
- Why do you think the government revises the newest months later, and why does it publish an estimate first anyway?
Chart and numbers: chart.ly/charts/us-jobs-added-by-month · More free charts at chart.ly
Chart 2 of 2 · World
How many people live in each country?
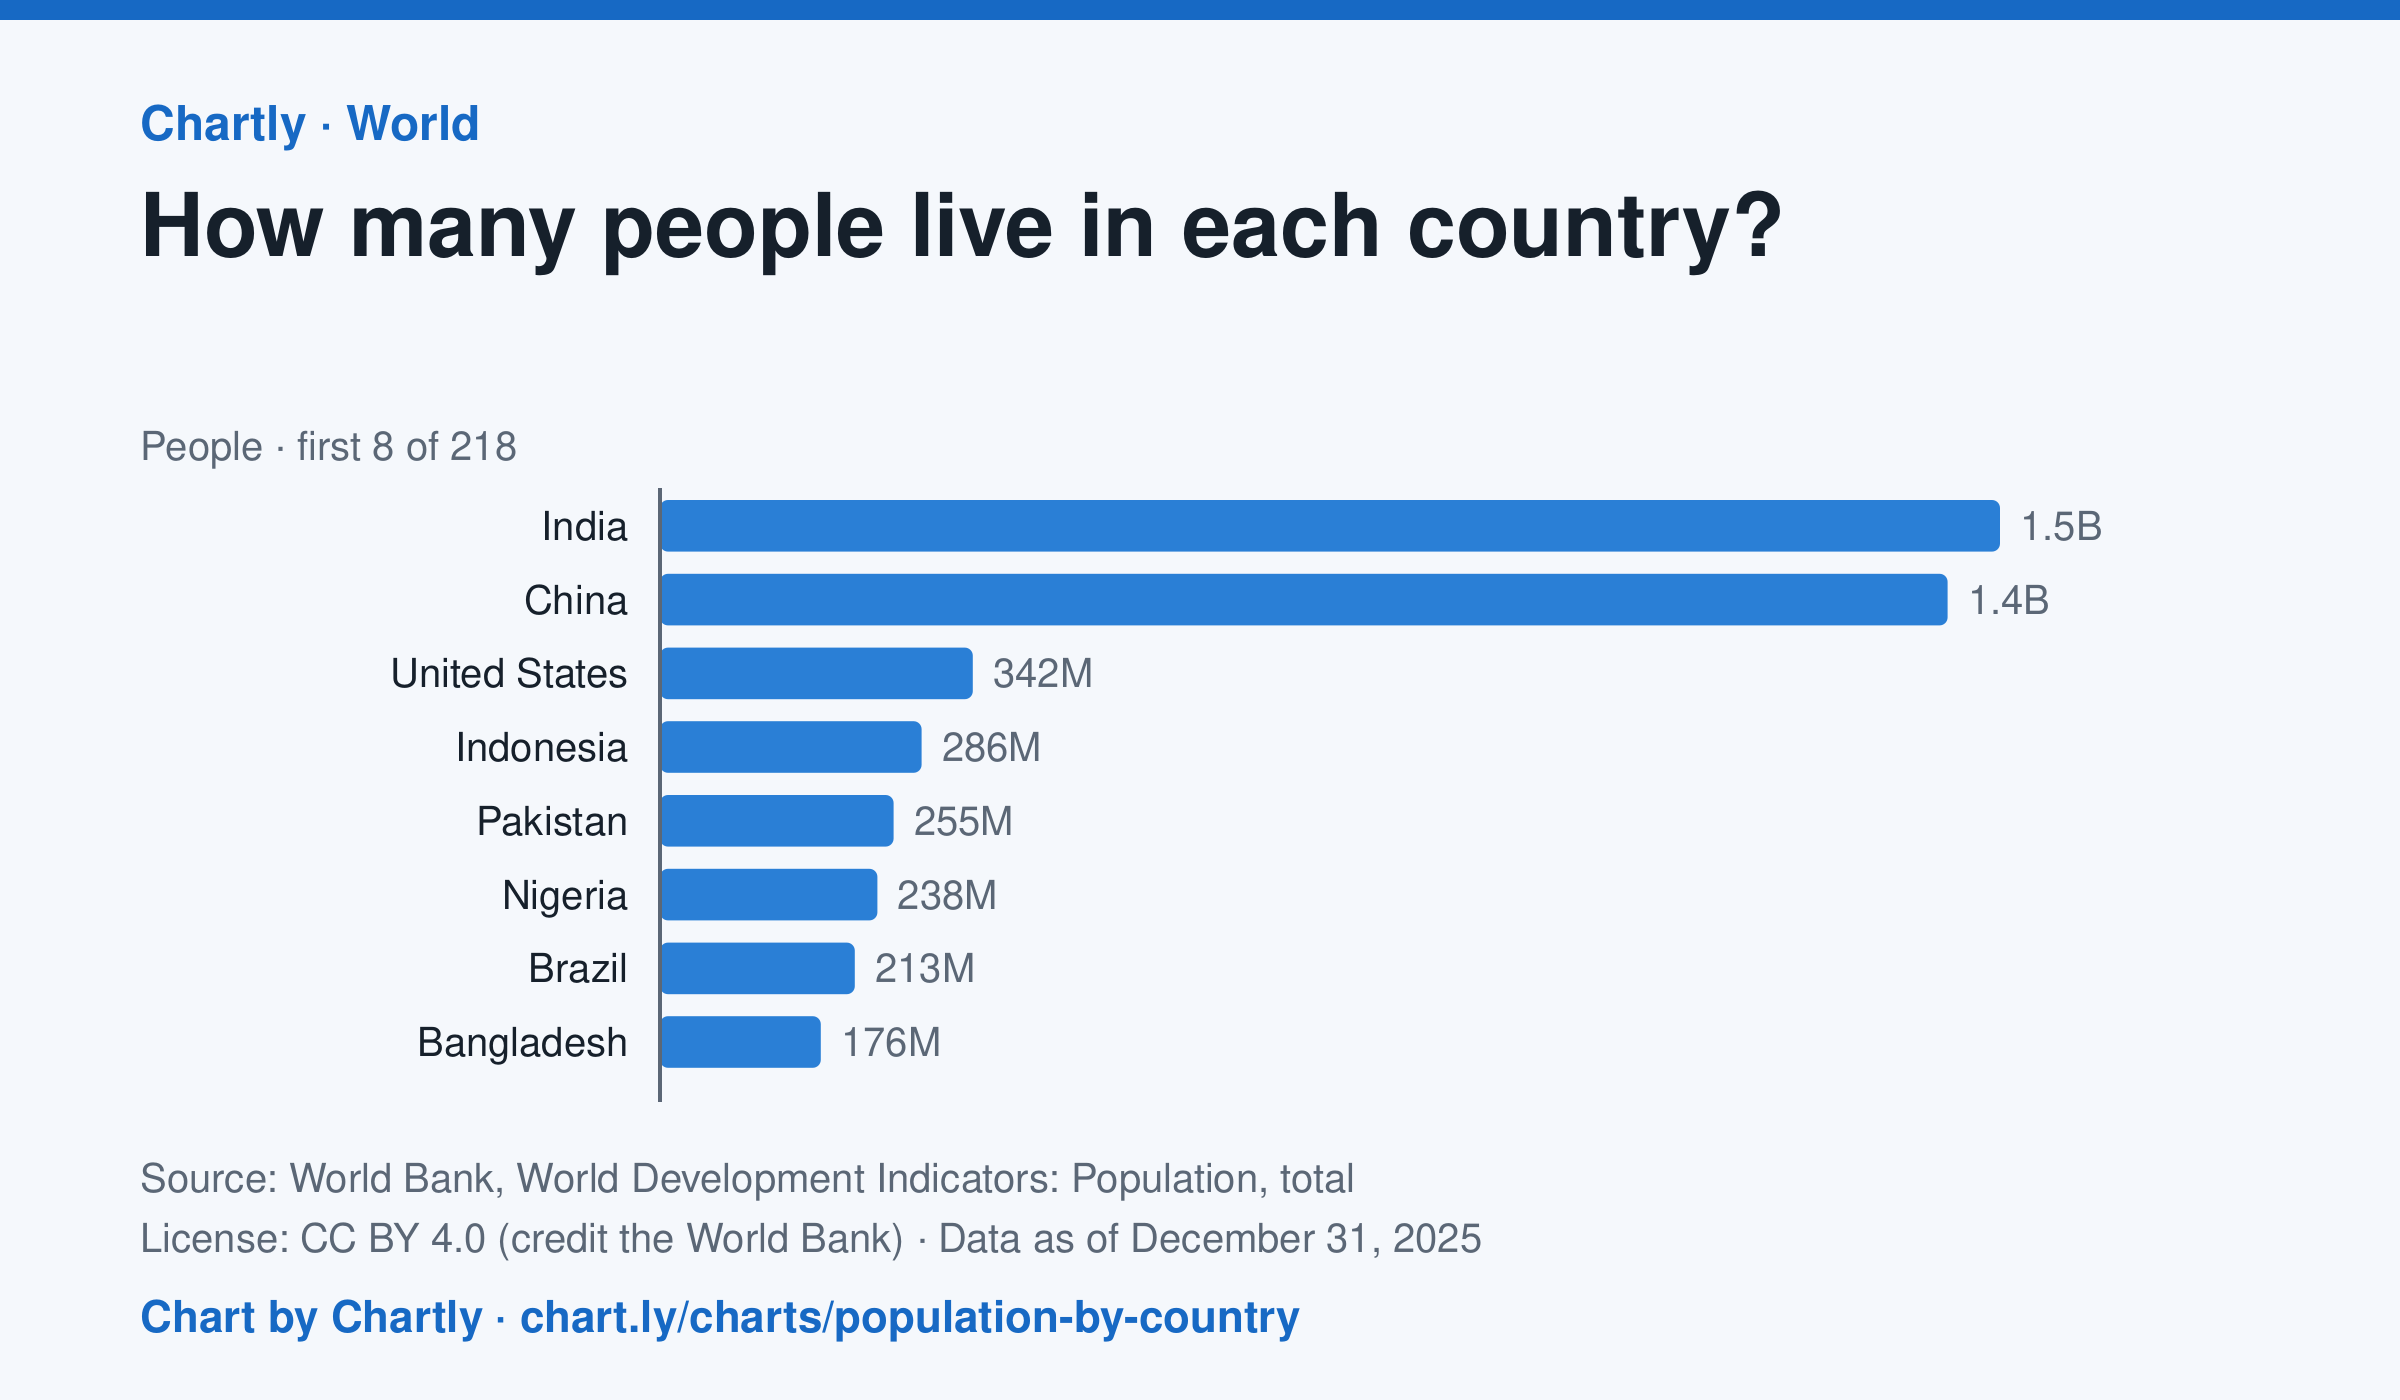
India, with 1.46 billion people in 2025, and China, with 1.41 billion, are far larger than any other country; the United States is third with 342 million. The smallest, Tuvalu, had about 9,500 people. Search 217 countries and territories. Figures are mid-year estimates, many from the United Nations.
Source: World Bank, World Development Indicators: Population, total (CC BY 4.0 (credit the World Bank)) · Data as of Dec 31, 2025
How to read this chart
Each bar is how many people lived in a country in a year, estimated by the United Nations and reported by the World Bank. On a phone the chart opens on the 10 biggest and smallest; search for any country. The bars start at zero, so a bar twice as long means twice as many people.
Questions
- Which two countries have the most people, and how far ahead are they of the third?
- About what share of the world's people live in the top two countries?
- A country with many people isn't always crowded. What other number would you need to know how crowded it is?
Chart and numbers: chart.ly/charts/population-by-country · More free charts at chart.ly