Print this worksheet, or choose "Save as PDF" in the print window to share a file.
Chart worksheet
Environmental science chart assignment
Name:
Class:
Date:
Chart 1 of 1 · Inflation
How fast are US prices rising?
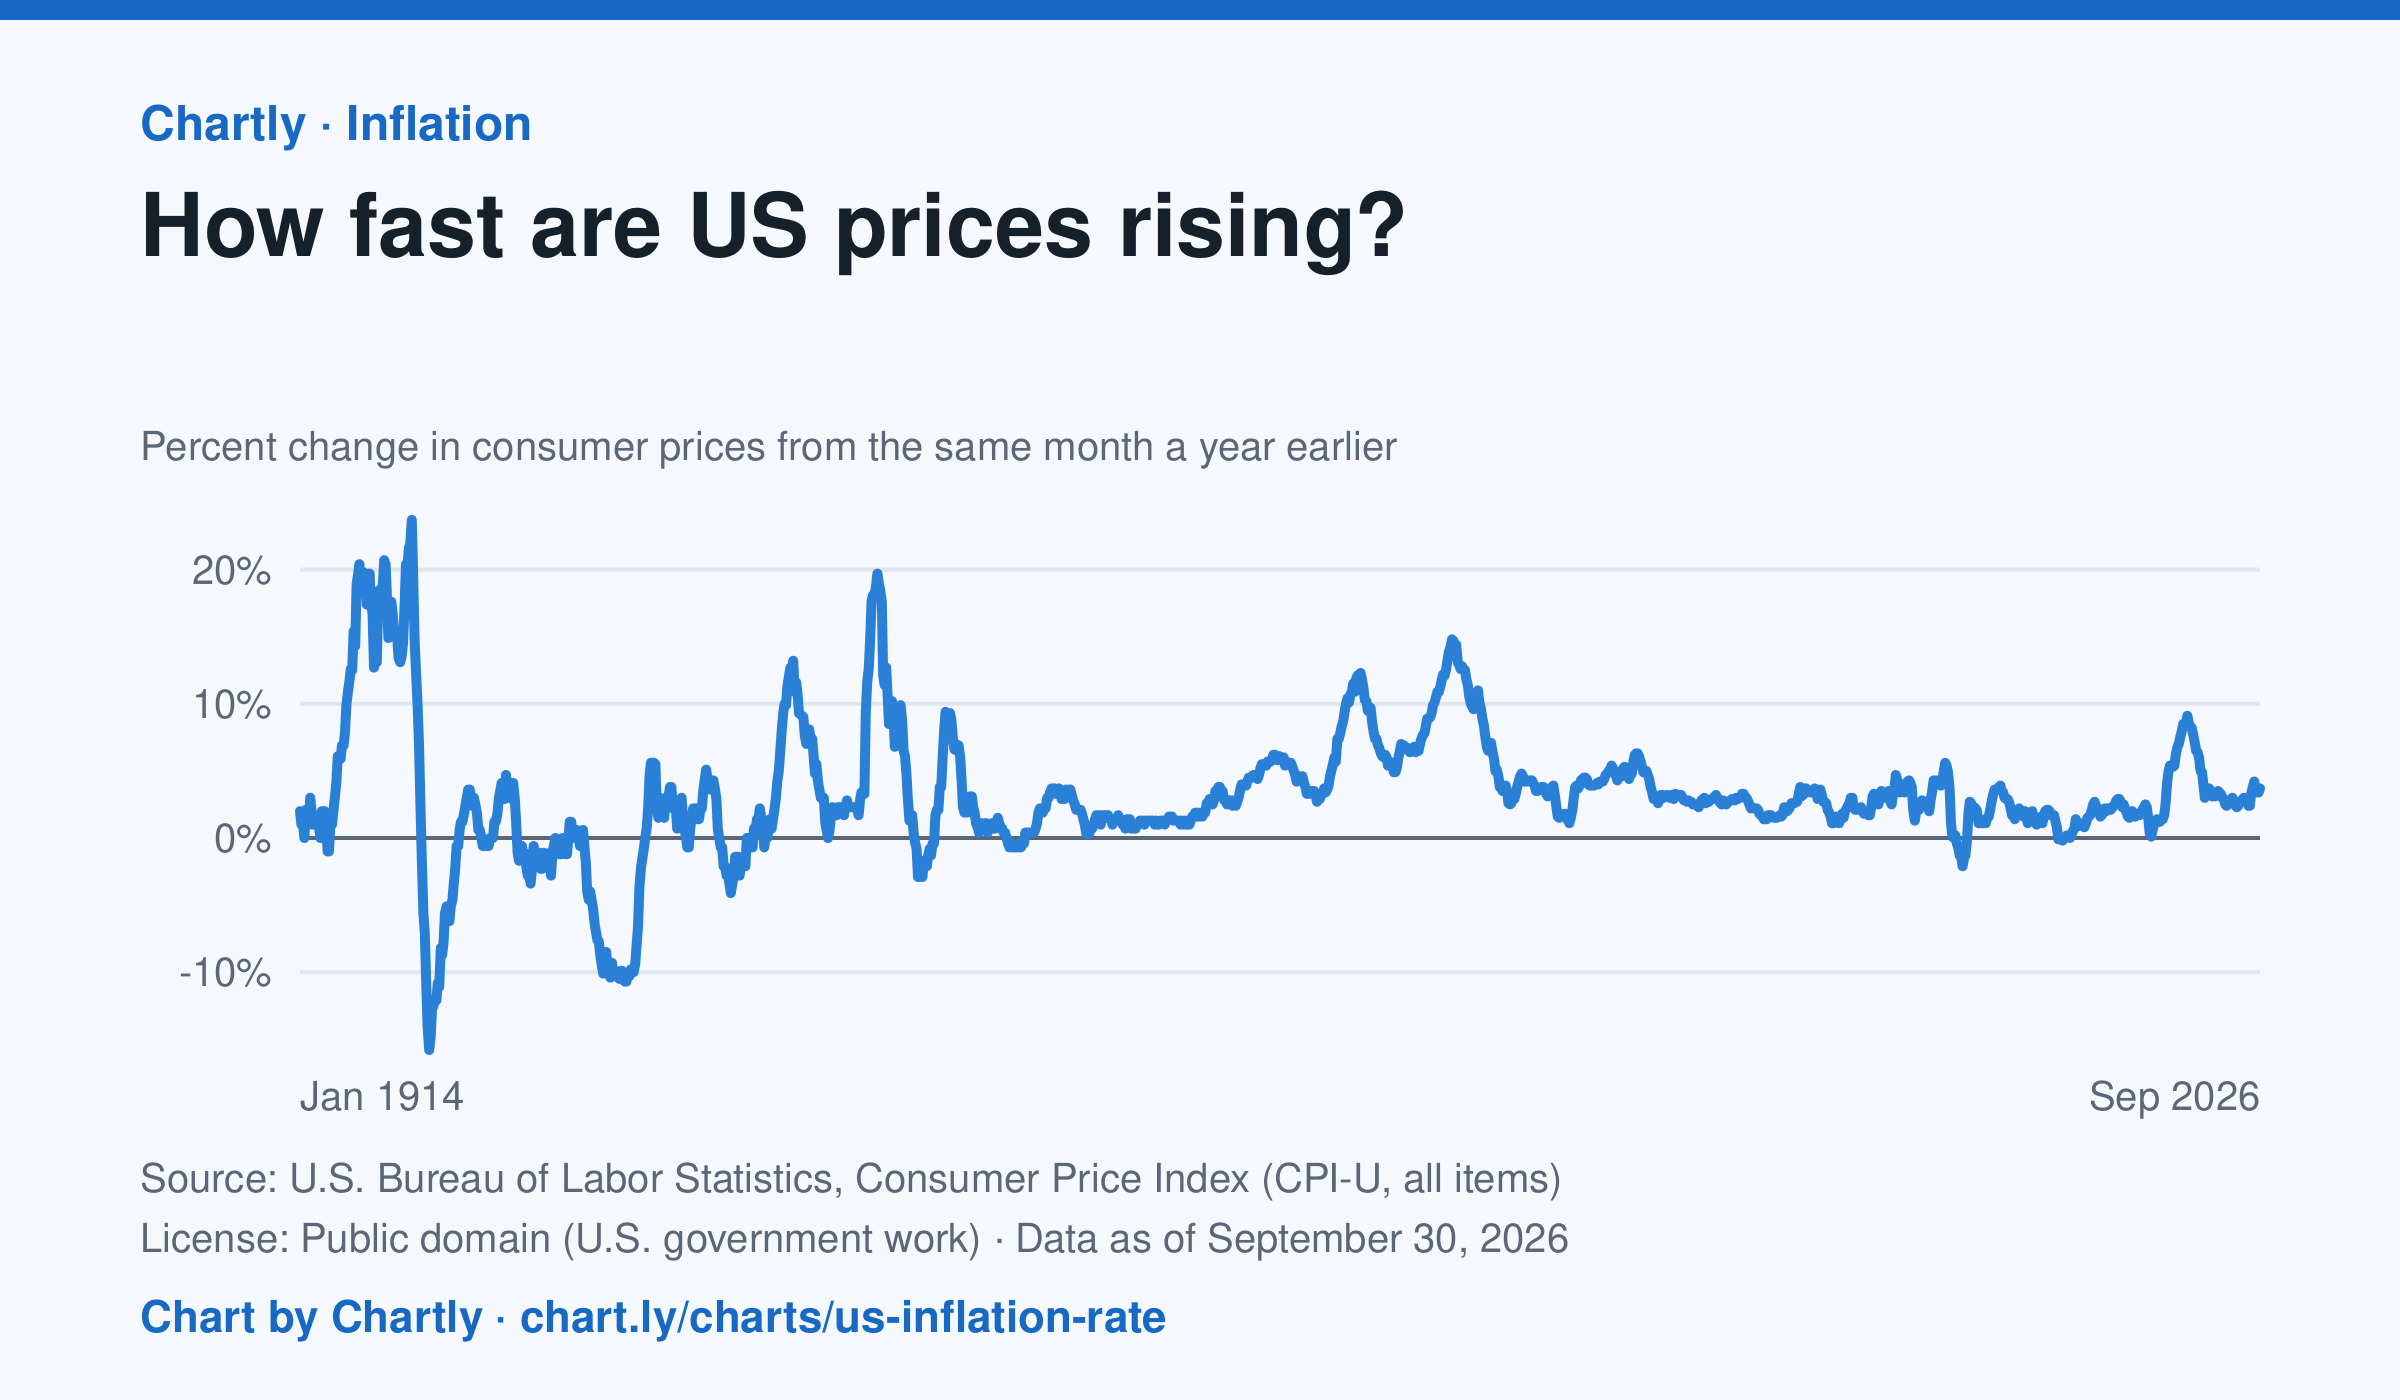
The inflation rate was 3.7% in September 2026: how much consumer prices changed from the same month a year earlier. Each point makes that comparison, back to 1914, the first year BLS can compare. Inflation peaked at 23.7% in June 1920 and at 14.8% in March 1980; the 9.1% of June 2022 was the highest since 1981. Prices fell as fast as 15.8% a year in 1921 and 10.7% in 1932. BLS collected no prices in October 2025, during a lapse in federal funding, so that month and October 2026 are missing.
Source: U.S. Bureau of Labor Statistics, Consumer Price Index (CPI-U, all items) (Public domain (U.S. government work)) · Data as of Sep 30, 2026
How to read this chart
Each point compares consumer prices in a month with the same month a year earlier. A value of 3 means things cost about 3% more than a year before; below zero means prices fell. The chart shows how fast prices change, not how high they are.
Questions
- Find two times when inflation was highest. What was happening in the country then?
- If inflation falls from 8% to 3%, are prices going down, or just rising more slowly?
- Find a stretch when the line is below zero. Why might falling prices be bad news for workers and businesses?
Chart and numbers: chart.ly/charts/us-inflation-rate · More free charts at chart.ly