Print this worksheet, or choose "Save as PDF" in the print window to share a file.
Chart worksheet
Charts to read and discuss
Name:
Class:
Date:
Chart 1 of 3 · Inflation
How fast are US prices rising?
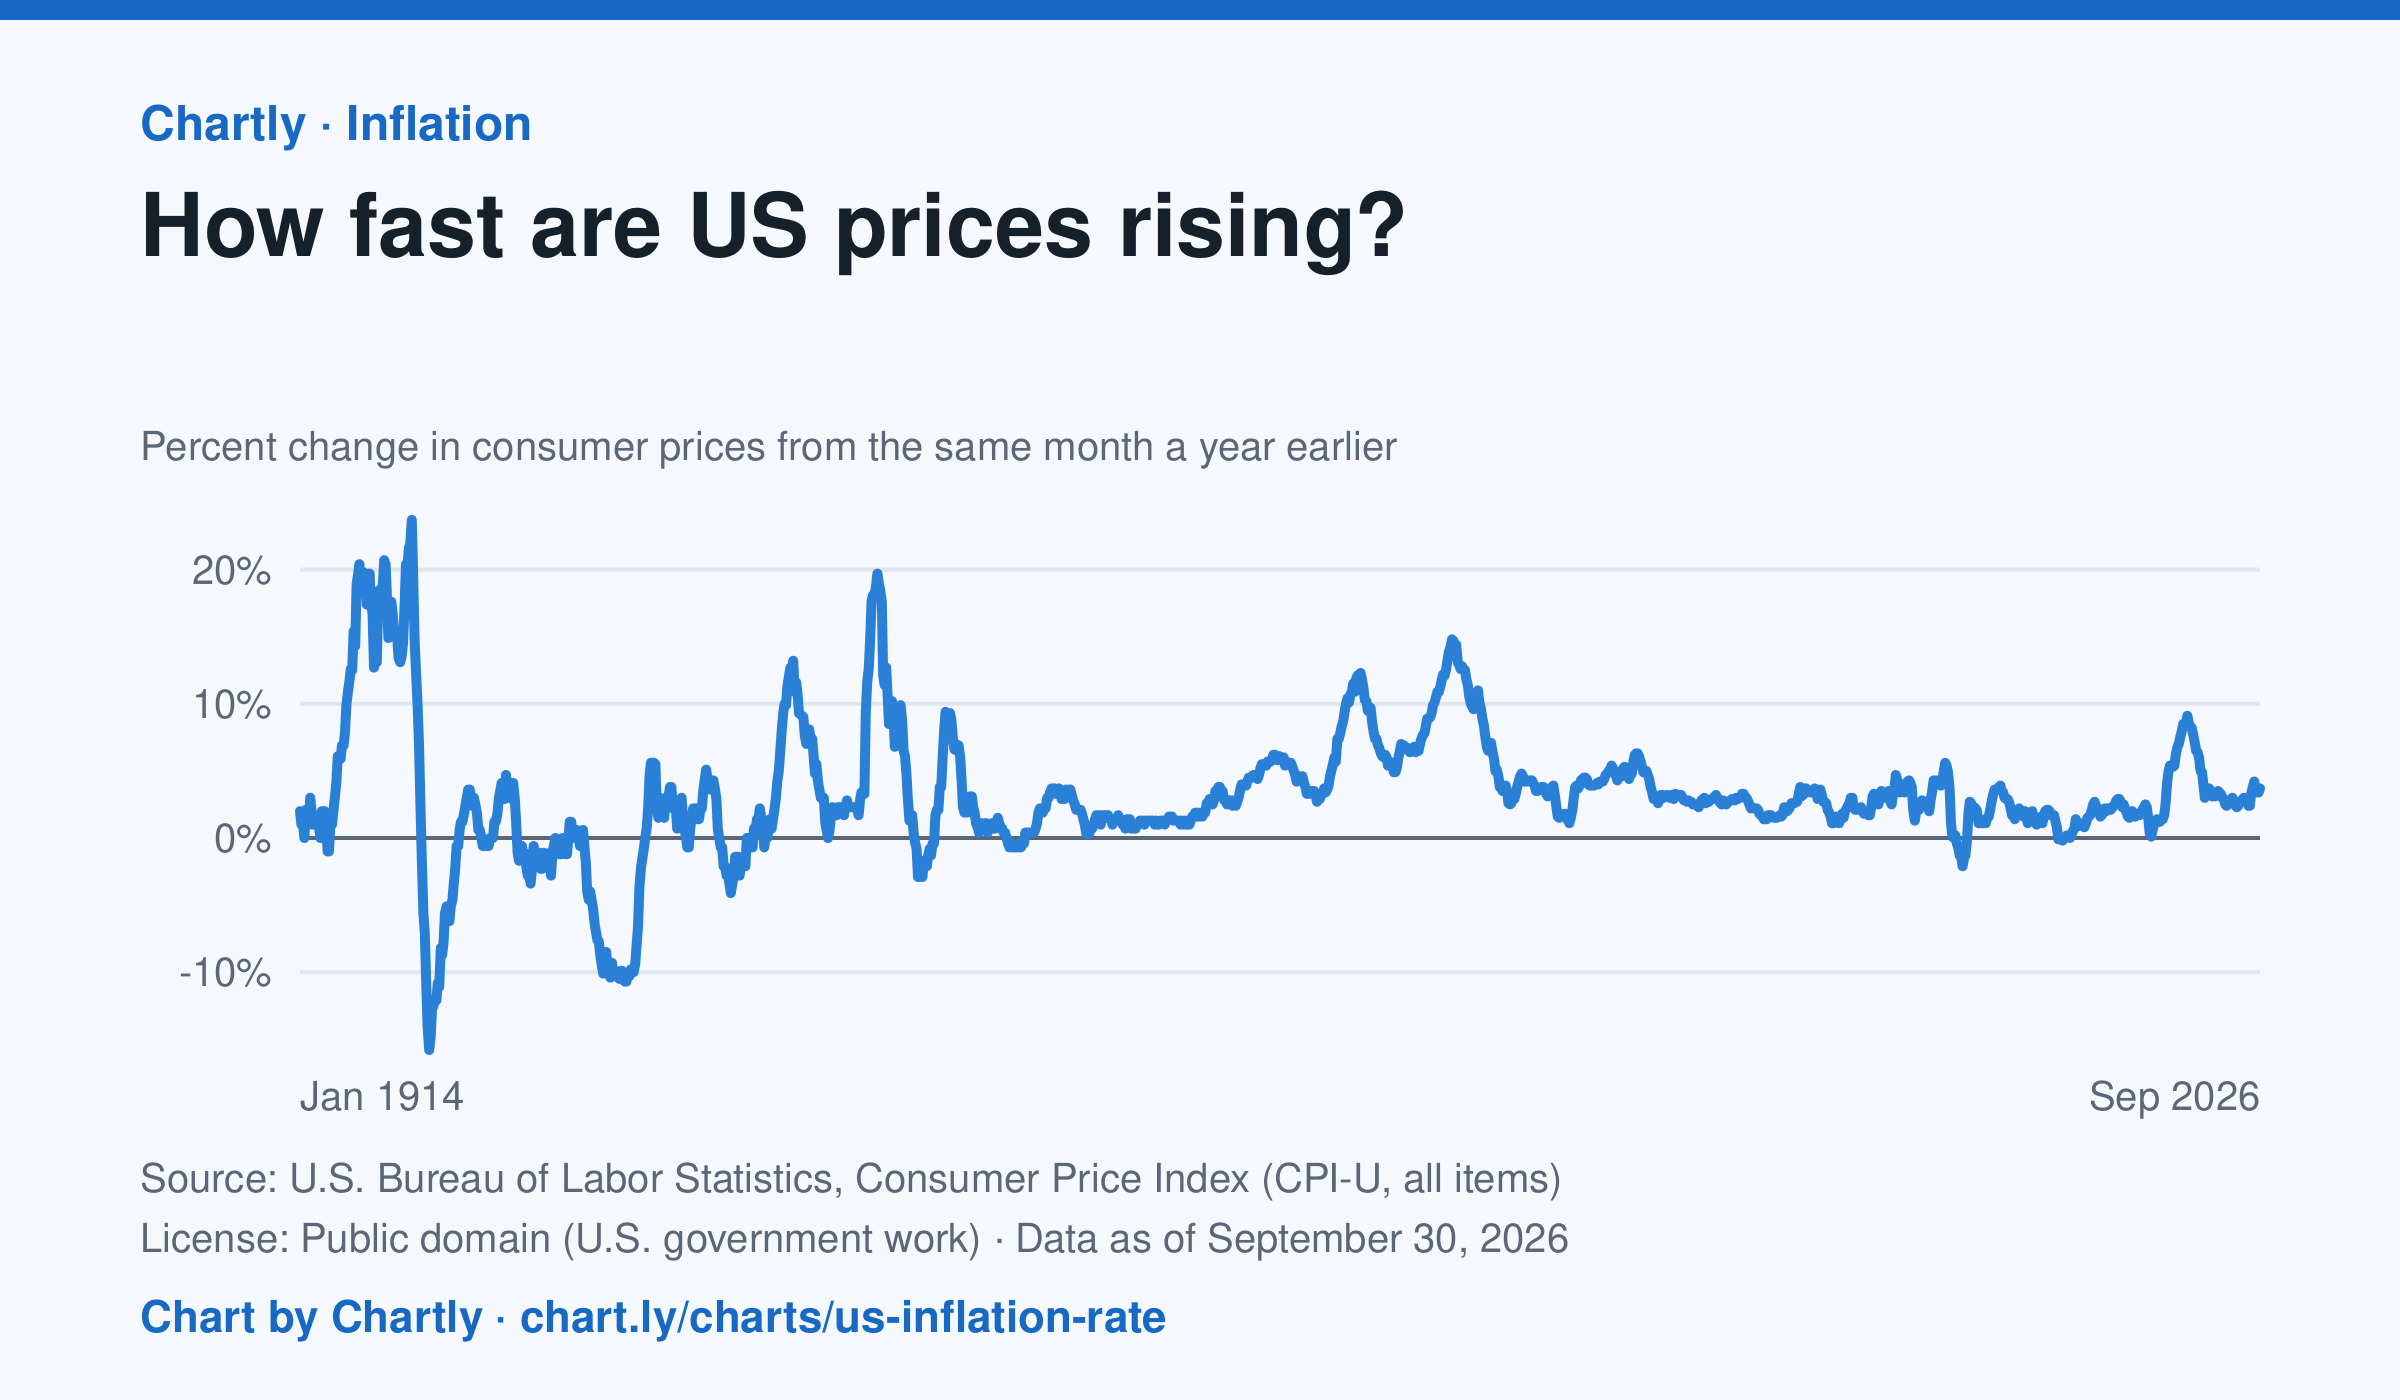
The inflation rate was 3.7% in September 2026: how much consumer prices changed from the same month a year earlier. Each point makes that comparison, back to 1914, the first year BLS can compare. Inflation peaked at 23.7% in June 1920 and at 14.8% in March 1980; the 9.1% of June 2022 was the highest since 1981. Prices fell as fast as 15.8% a year in 1921 and 10.7% in 1932. BLS collected no prices in October 2025, during a lapse in federal funding, so that month and October 2026 are missing.
Source: U.S. Bureau of Labor Statistics, Consumer Price Index (CPI-U, all items) (Public domain (U.S. government work)) · Data as of Sep 30, 2026
How to read this chart
Each point compares consumer prices in a month with the same month a year earlier. A value of 3 means things cost about 3% more than a year before; below zero means prices fell. The chart shows how fast prices change, not how high they are.
Questions
- Find two times when inflation was highest. What was happening in the country then?
- If inflation falls from 8% to 3%, are prices going down, or just rising more slowly?
- Find a stretch when the line is below zero. Why might falling prices be bad news for workers and businesses?
Chart and numbers: chart.ly/charts/us-inflation-rate · More free charts at chart.ly
Chart 2 of 3 · World
How many people live in each country?
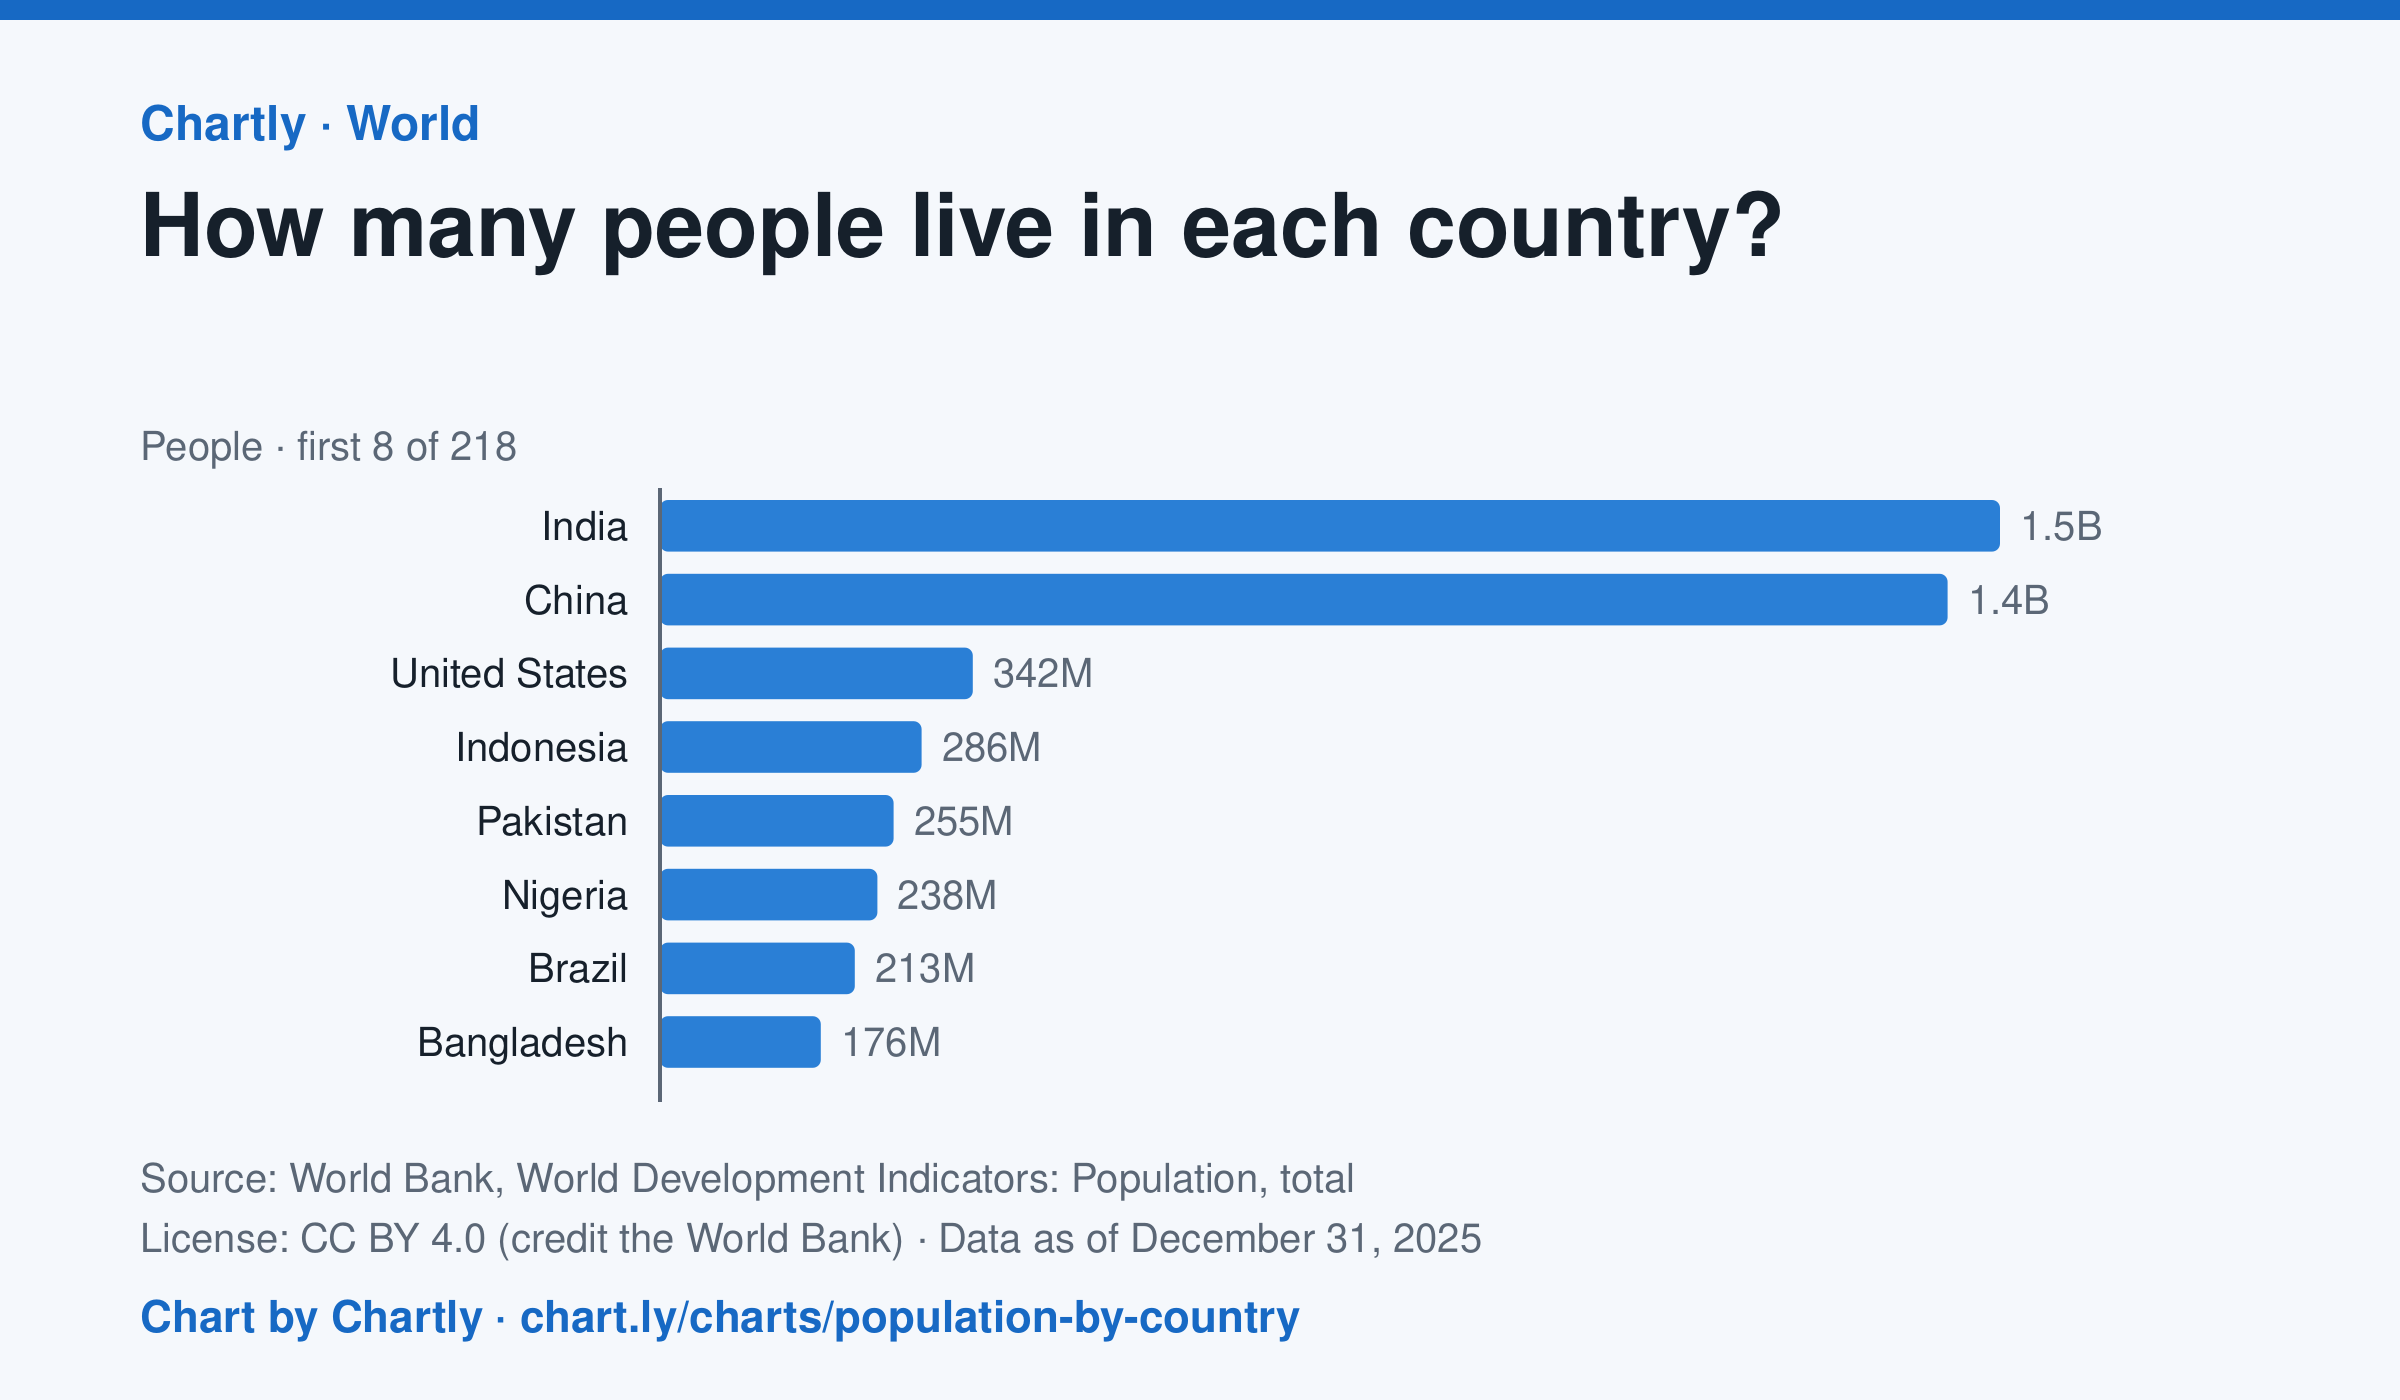
India, with 1.46 billion people in 2025, and China, with 1.41 billion, are far larger than any other country; the United States is third with 342 million. The smallest, Tuvalu, had about 9,500 people. Search 217 countries and territories. Figures are mid-year estimates, many from the United Nations.
Source: World Bank, World Development Indicators: Population, total (CC BY 4.0 (credit the World Bank)) · Data as of Dec 31, 2025
How to read this chart
Each bar is how many people lived in a country in a year, estimated by the United Nations and reported by the World Bank. On a phone the chart opens on the 10 biggest and smallest; search for any country. The bars start at zero, so a bar twice as long means twice as many people.
Questions
- Which two countries have the most people, and how far ahead are they of the third?
- About what share of the world's people live in the top two countries?
- A country with many people isn't always crowded. What other number would you need to know how crowded it is?
Chart and numbers: chart.ly/charts/population-by-country · More free charts at chart.ly
Chart 3 of 3 · Climate
How much has the US warmed since 1895?
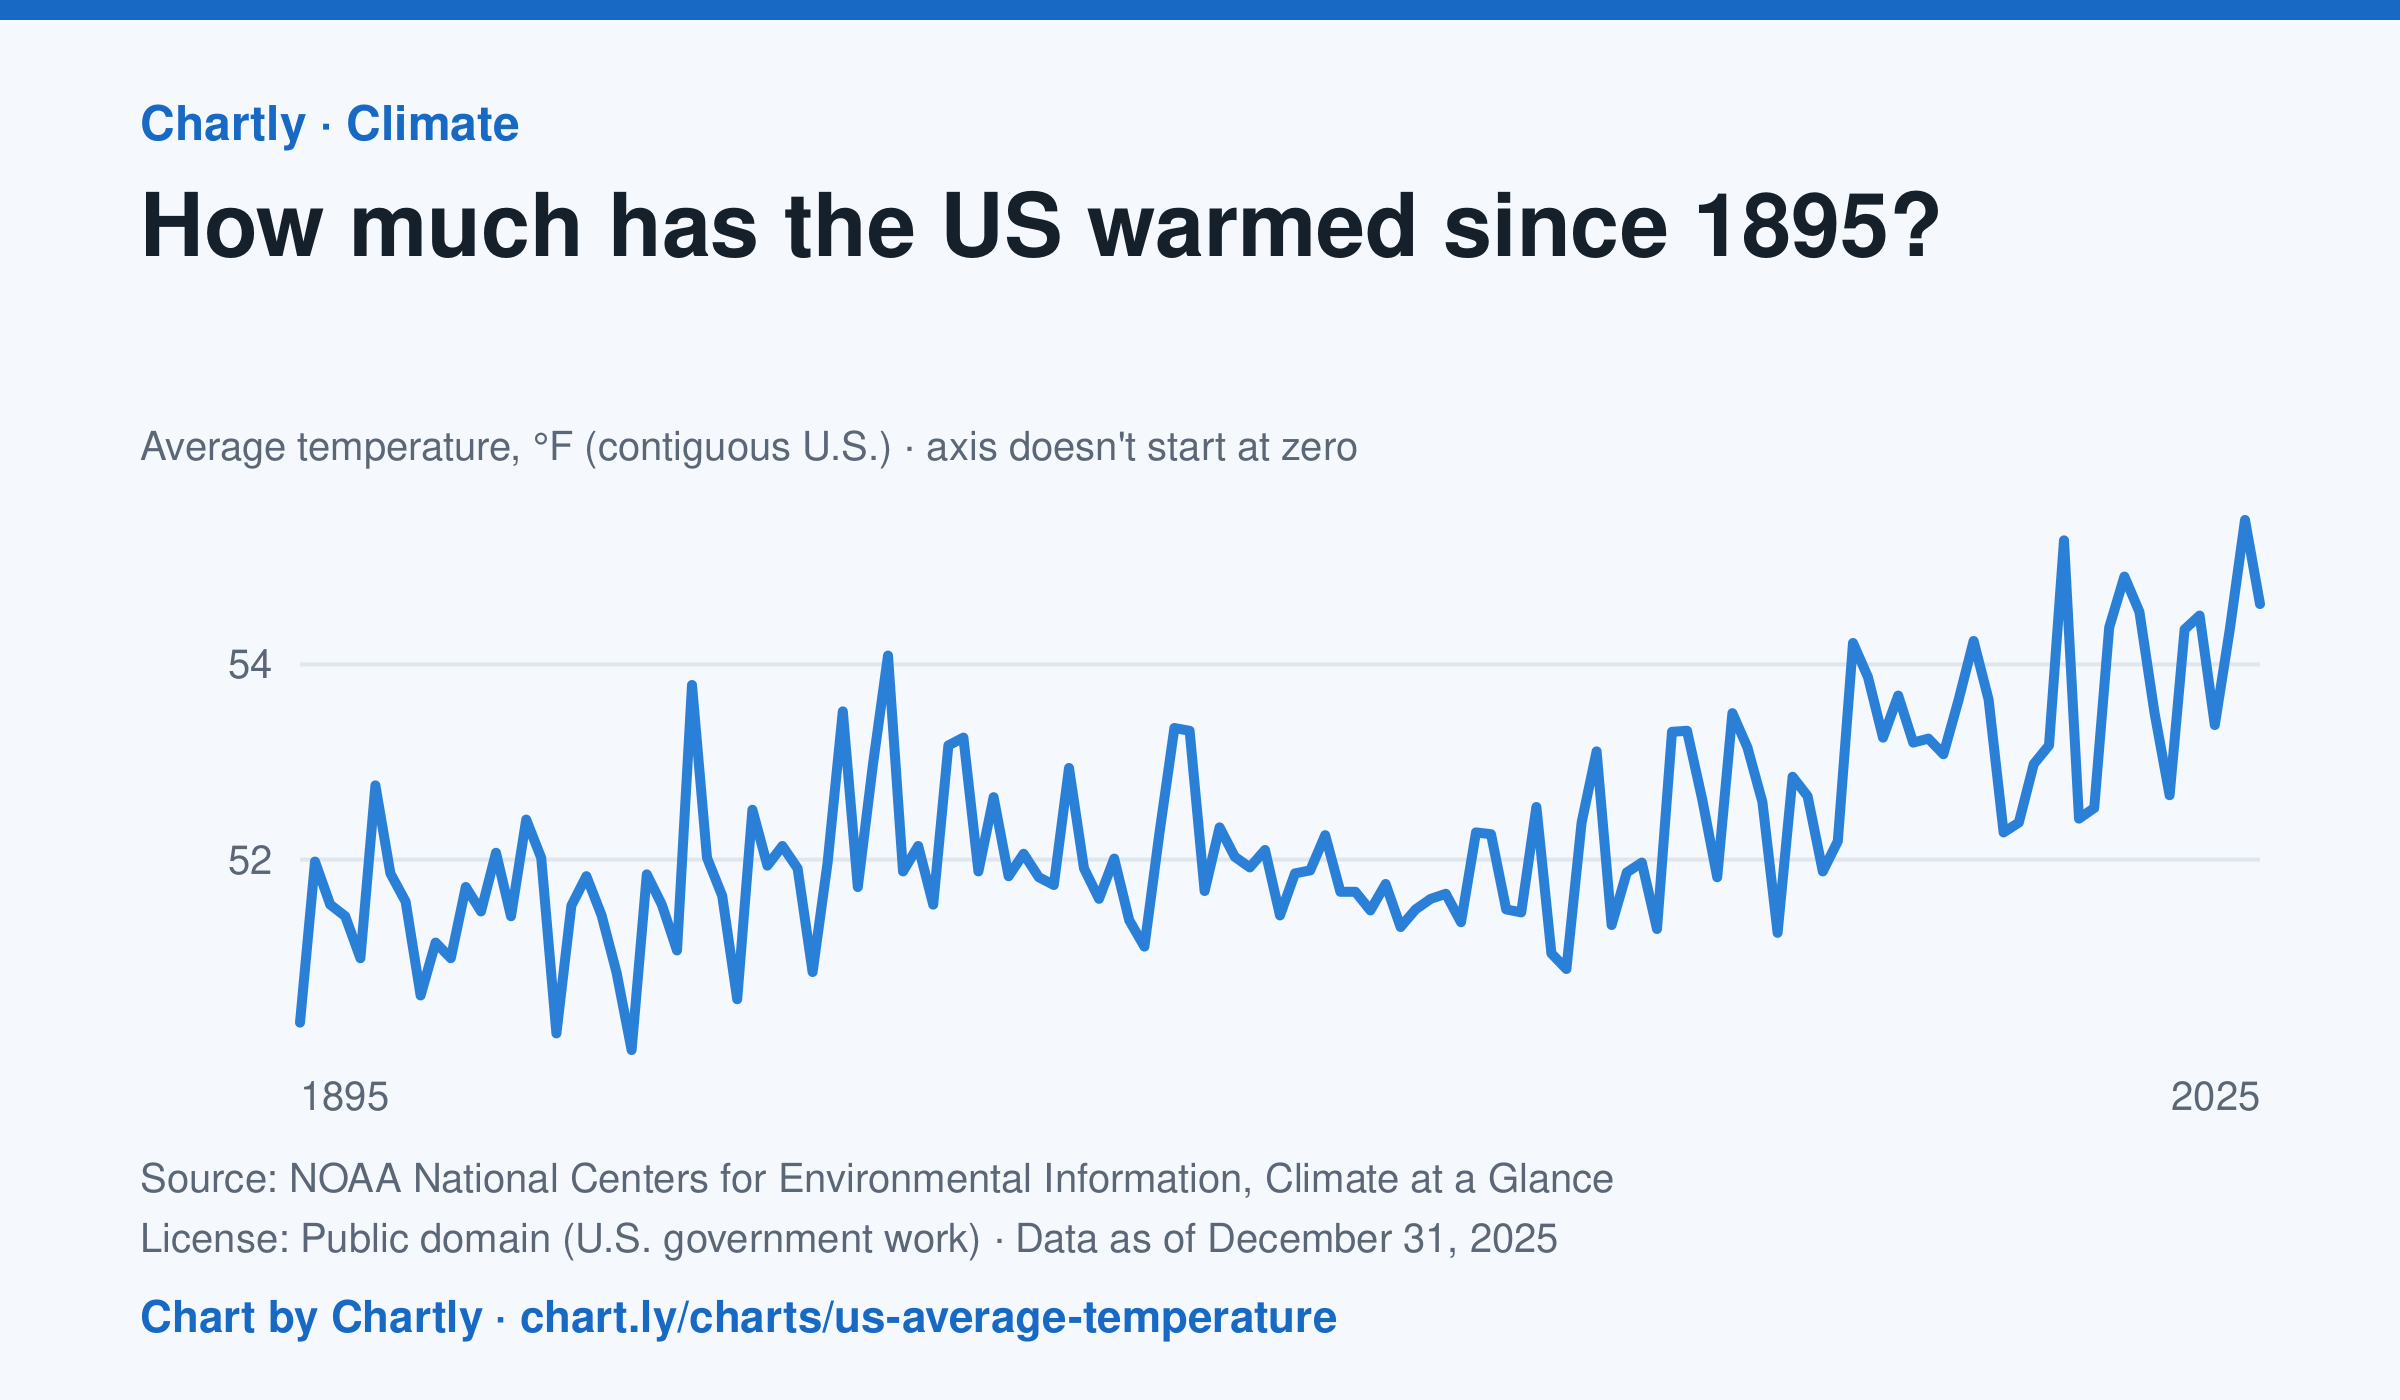
The contiguous US averaged 54.6°F in 2025. The warmest year since records began in 1895 was 2024, at 55.5°F. Through 2025, the dashed trend line, the straight line that best fits every year, rose about 0.18°F a decade, or 2.3°F since 1895, and warming had sped up to about 0.5°F a decade since 1970. Alaska and Hawaii aren't included.
Source: NOAA National Centers for Environmental Information, Climate at a Glance (Public domain (U.S. government work)) · Data as of Dec 31, 2025
How to read this chart
Each point is one year's average temperature across the lower 48 states, in degrees Fahrenheit. The axis doesn't start at zero, so a small rise looks steep: read the numbers on the axis, not the height of the line. The dashed line is the trend, the straight line that best fits every year; single years bounce above and below it.
Questions
- Find the warmest and coolest years on the chart. How many degrees apart are they?
- Why might one year be much cooler than the year before, even while the trend line keeps rising?
- The axis doesn't start at zero here, but bar charts always do. Why is that fair for temperatures but not for bars?
Chart and numbers: chart.ly/charts/us-average-temperature · More free charts at chart.ly