Print this worksheet, or choose "Save as PDF" in the print window to share a file.
Chart worksheet
Charts to read and discuss
Name:
Class:
Date:
Chart 1 of 3 · Energy
How much has a gallon of gas cost in the US since 1990?
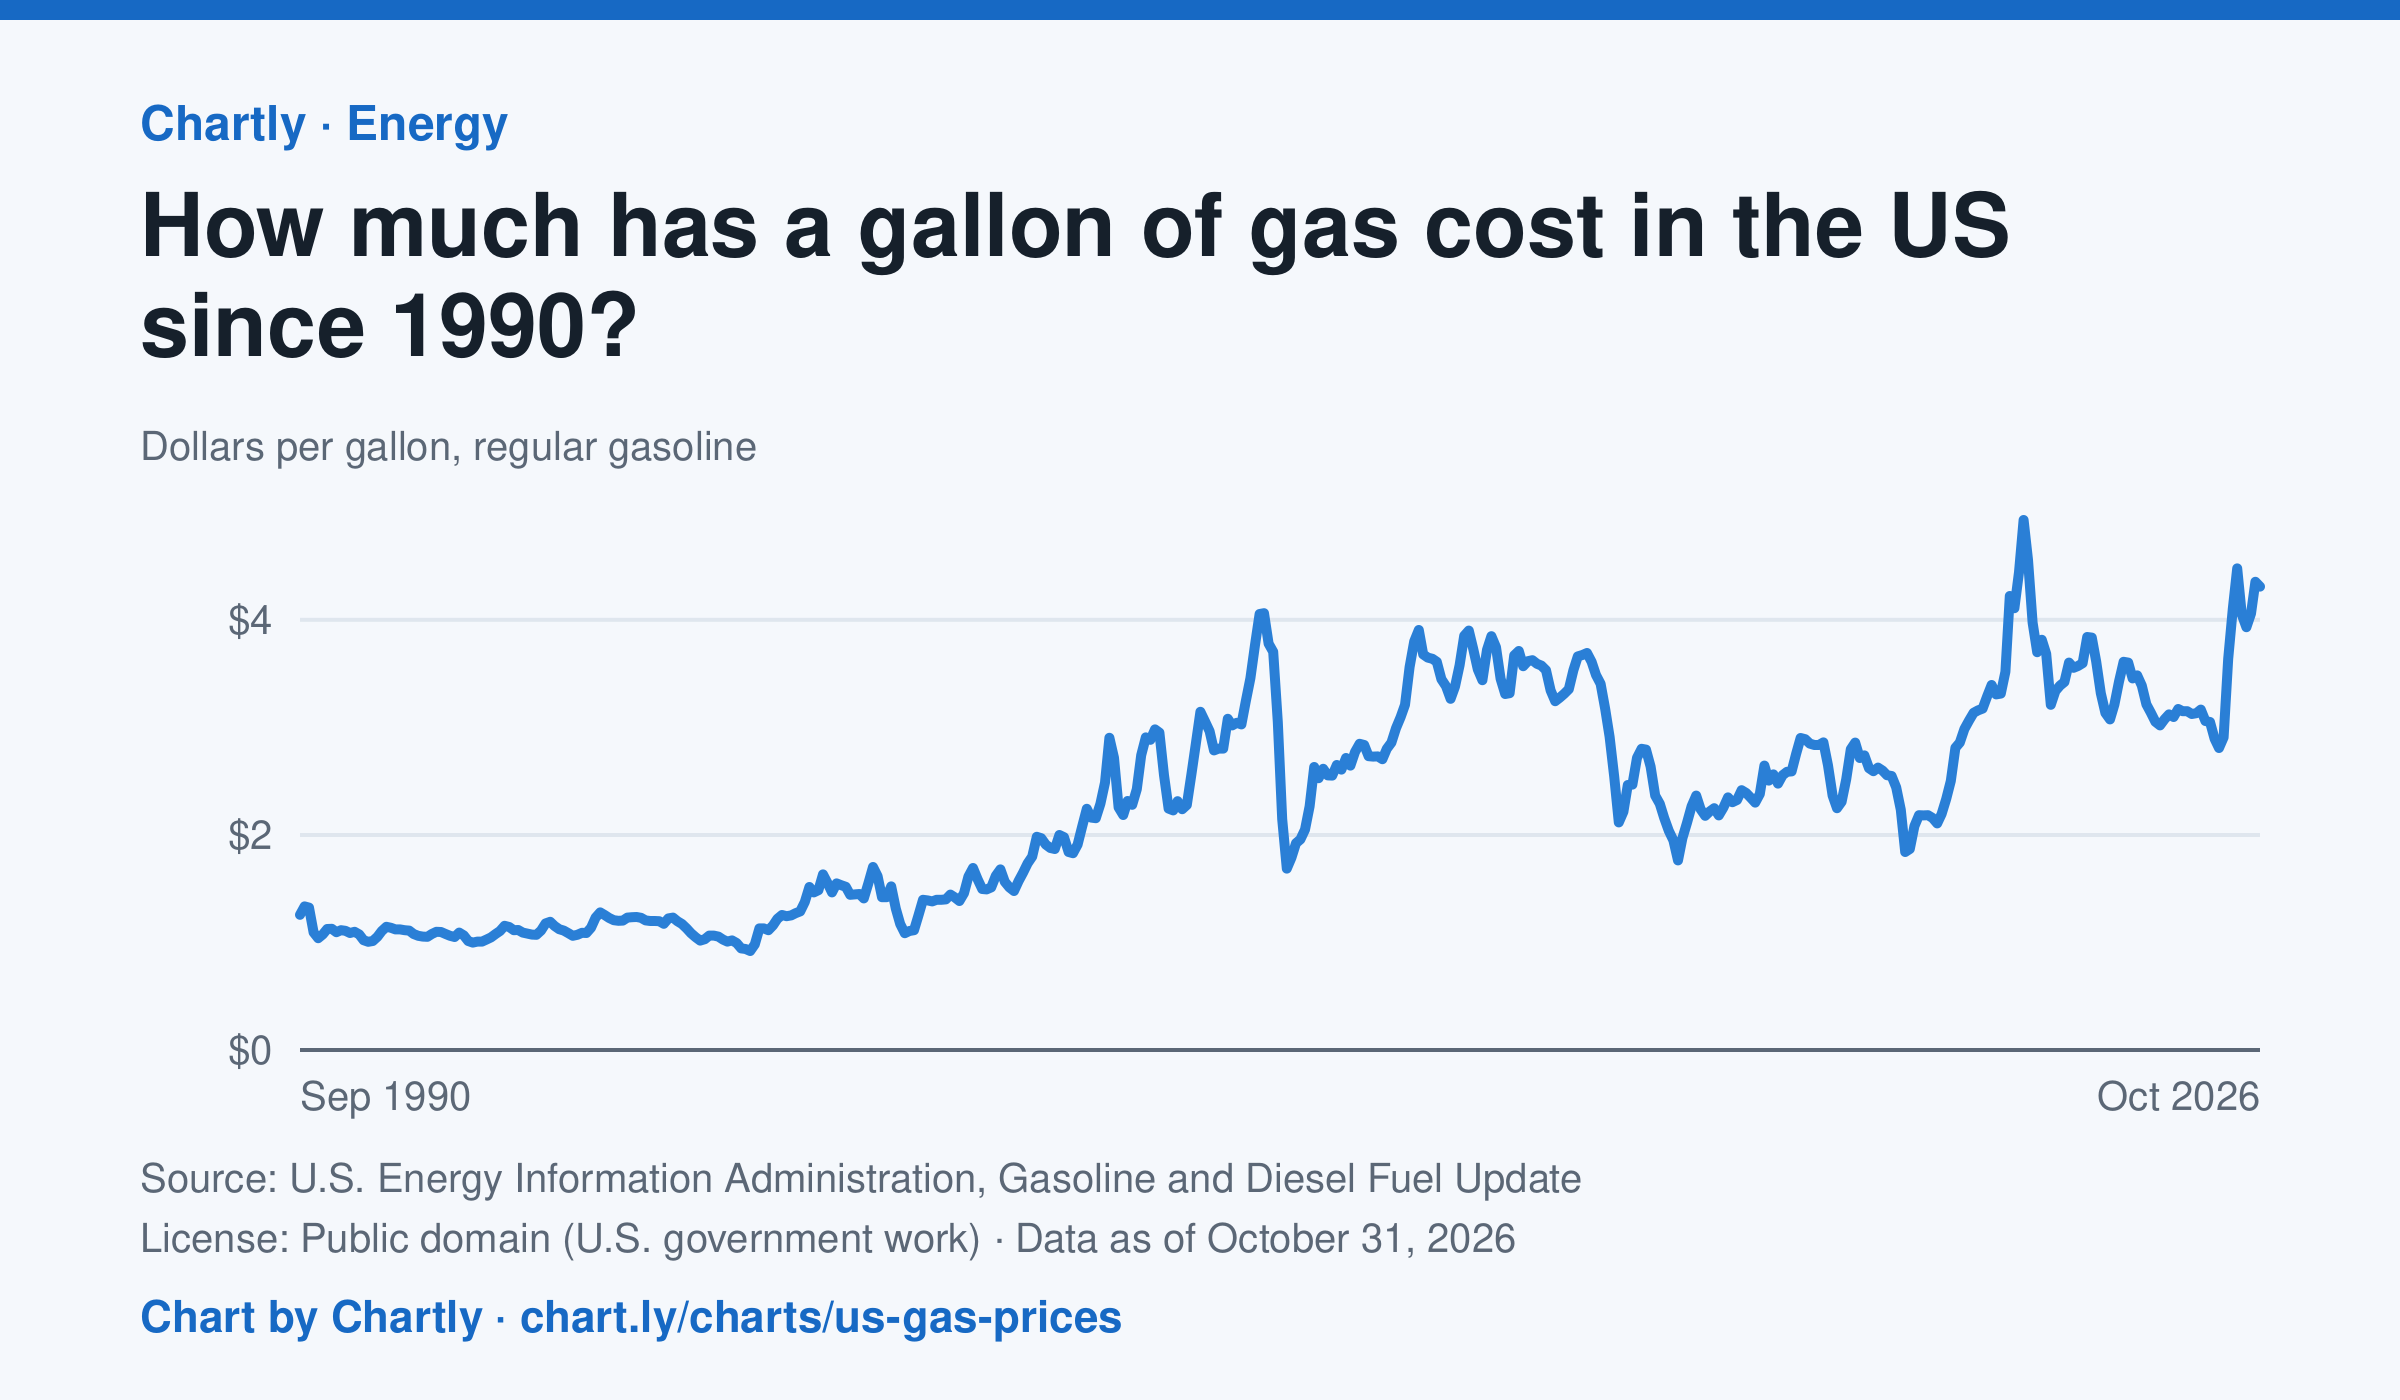
Regular gas averaged $4.31 a gallon in October 2026. The monthly average peaked at $4.93 in June 2022 and was lowest at $0.92 in February 1999. Each point averages EIA's weekly survey of gas stations nationwide, taxes included, in dollars of the day, not adjusted for inflation.
Source: U.S. Energy Information Administration, Gasoline and Diesel Fuel Update (Public domain (U.S. government work)) · Data as of Oct 31, 2026
How to read this chart
Each point is the average price of a gallon of regular gasoline in one month, in dollars, including taxes. The prices are not adjusted for inflation, so a dollar in 1990 bought more than a dollar does now. Gas prices follow the price of crude oil, so world events can move them quickly.
Questions
- Find the highest and lowest months on the chart. How many dollars apart are they?
- Pick a sharp drop on the chart. What world event could have made people use less gas or oil cost less?
- The chart isn't adjusted for inflation. How would that change the way the 1990s prices compare with today's?
Chart and numbers: chart.ly/charts/us-gas-prices · More free charts at chart.ly
Chart 2 of 3 · Climate
Which US states have warmed the most?
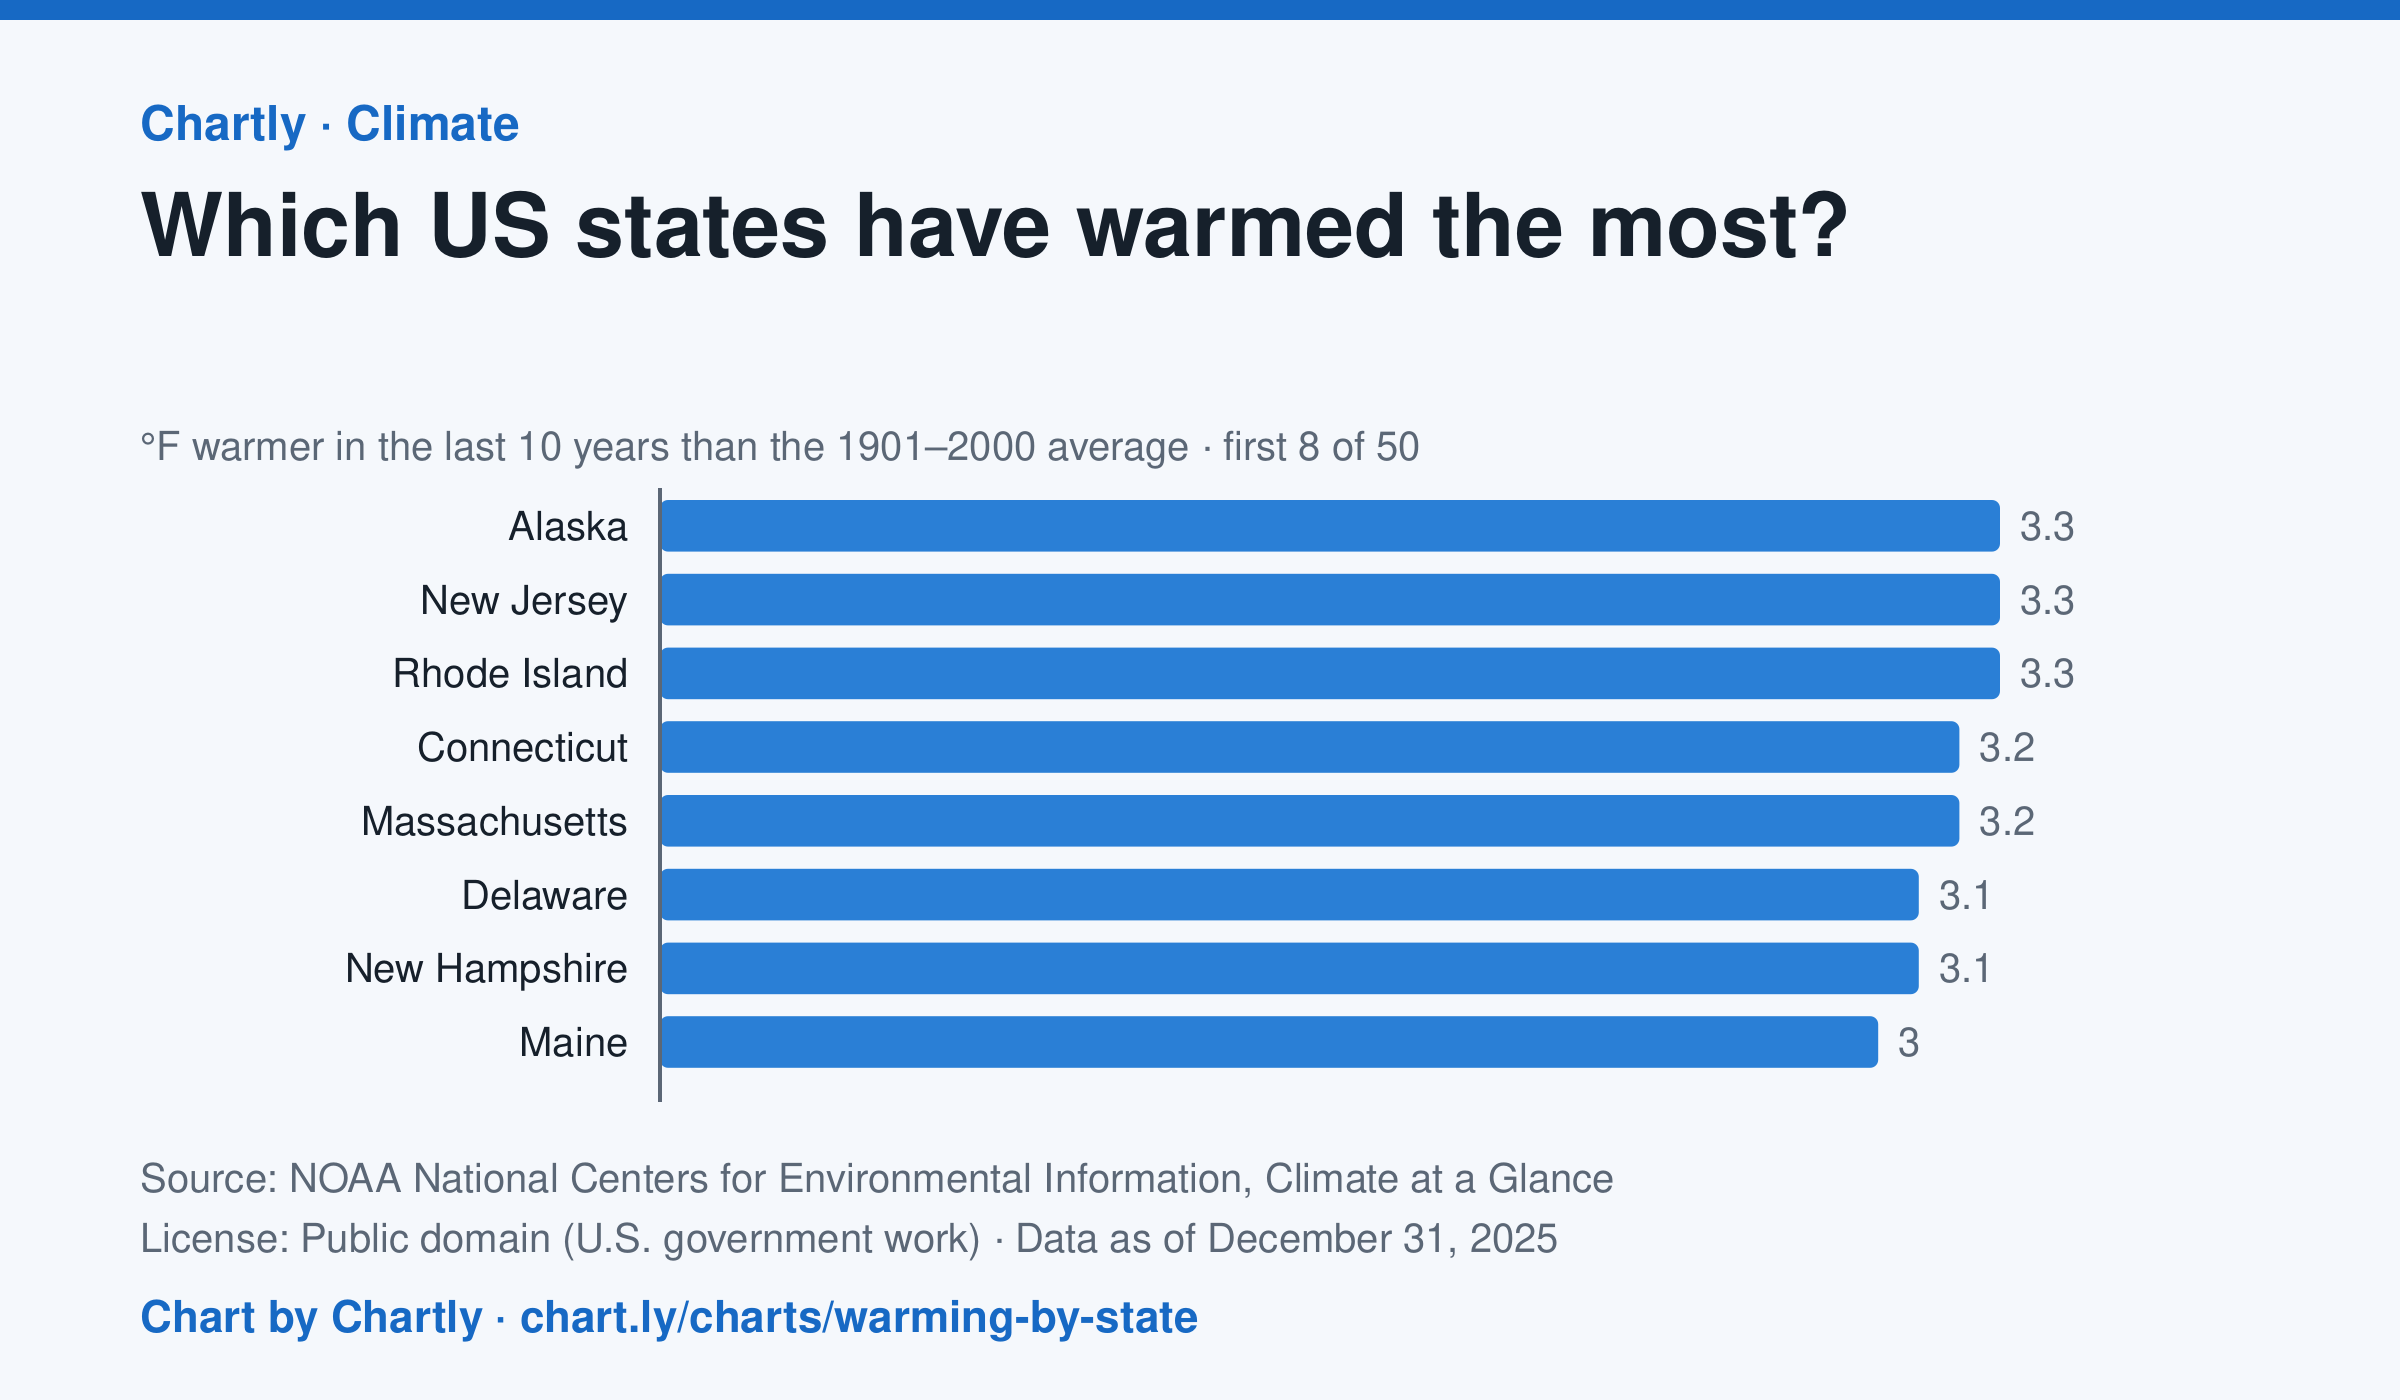
In the 10 years through 2025, Alaska was among the states that warmed most, averaging 3.3°F warmer than in 1901–2000, while Oklahoma was among those that warmed least, 1.6°F; the contiguous US warmed 2.2°F. Alaska's records start in 1925, so its baseline is 1925–2000. Hawaii's start in 1991, so it isn't included.
Source: NOAA National Centers for Environmental Information, Climate at a Glance (Public domain (U.S. government work)) · Data as of Dec 31, 2025
How to read this chart
Each bar shows how much warmer a state's last 10 years were than its average for 1901 to 2000, in degrees Fahrenheit. Ten years are averaged so one hot or cold year doesn't decide a state's place. The dashed line is the whole lower 48 states.
Questions
- Which states warmed the most and the least? How many degrees apart are they?
- Do the states that warmed most sit together in one part of the country, or are they spread out?
- Why do scientists compare with a long average like 1901 to 2000 instead of with just last year?
Chart and numbers: chart.ly/charts/warming-by-state · More free charts at chart.ly
Chart 3 of 3 · Climate
How much has the US warmed since 1895?
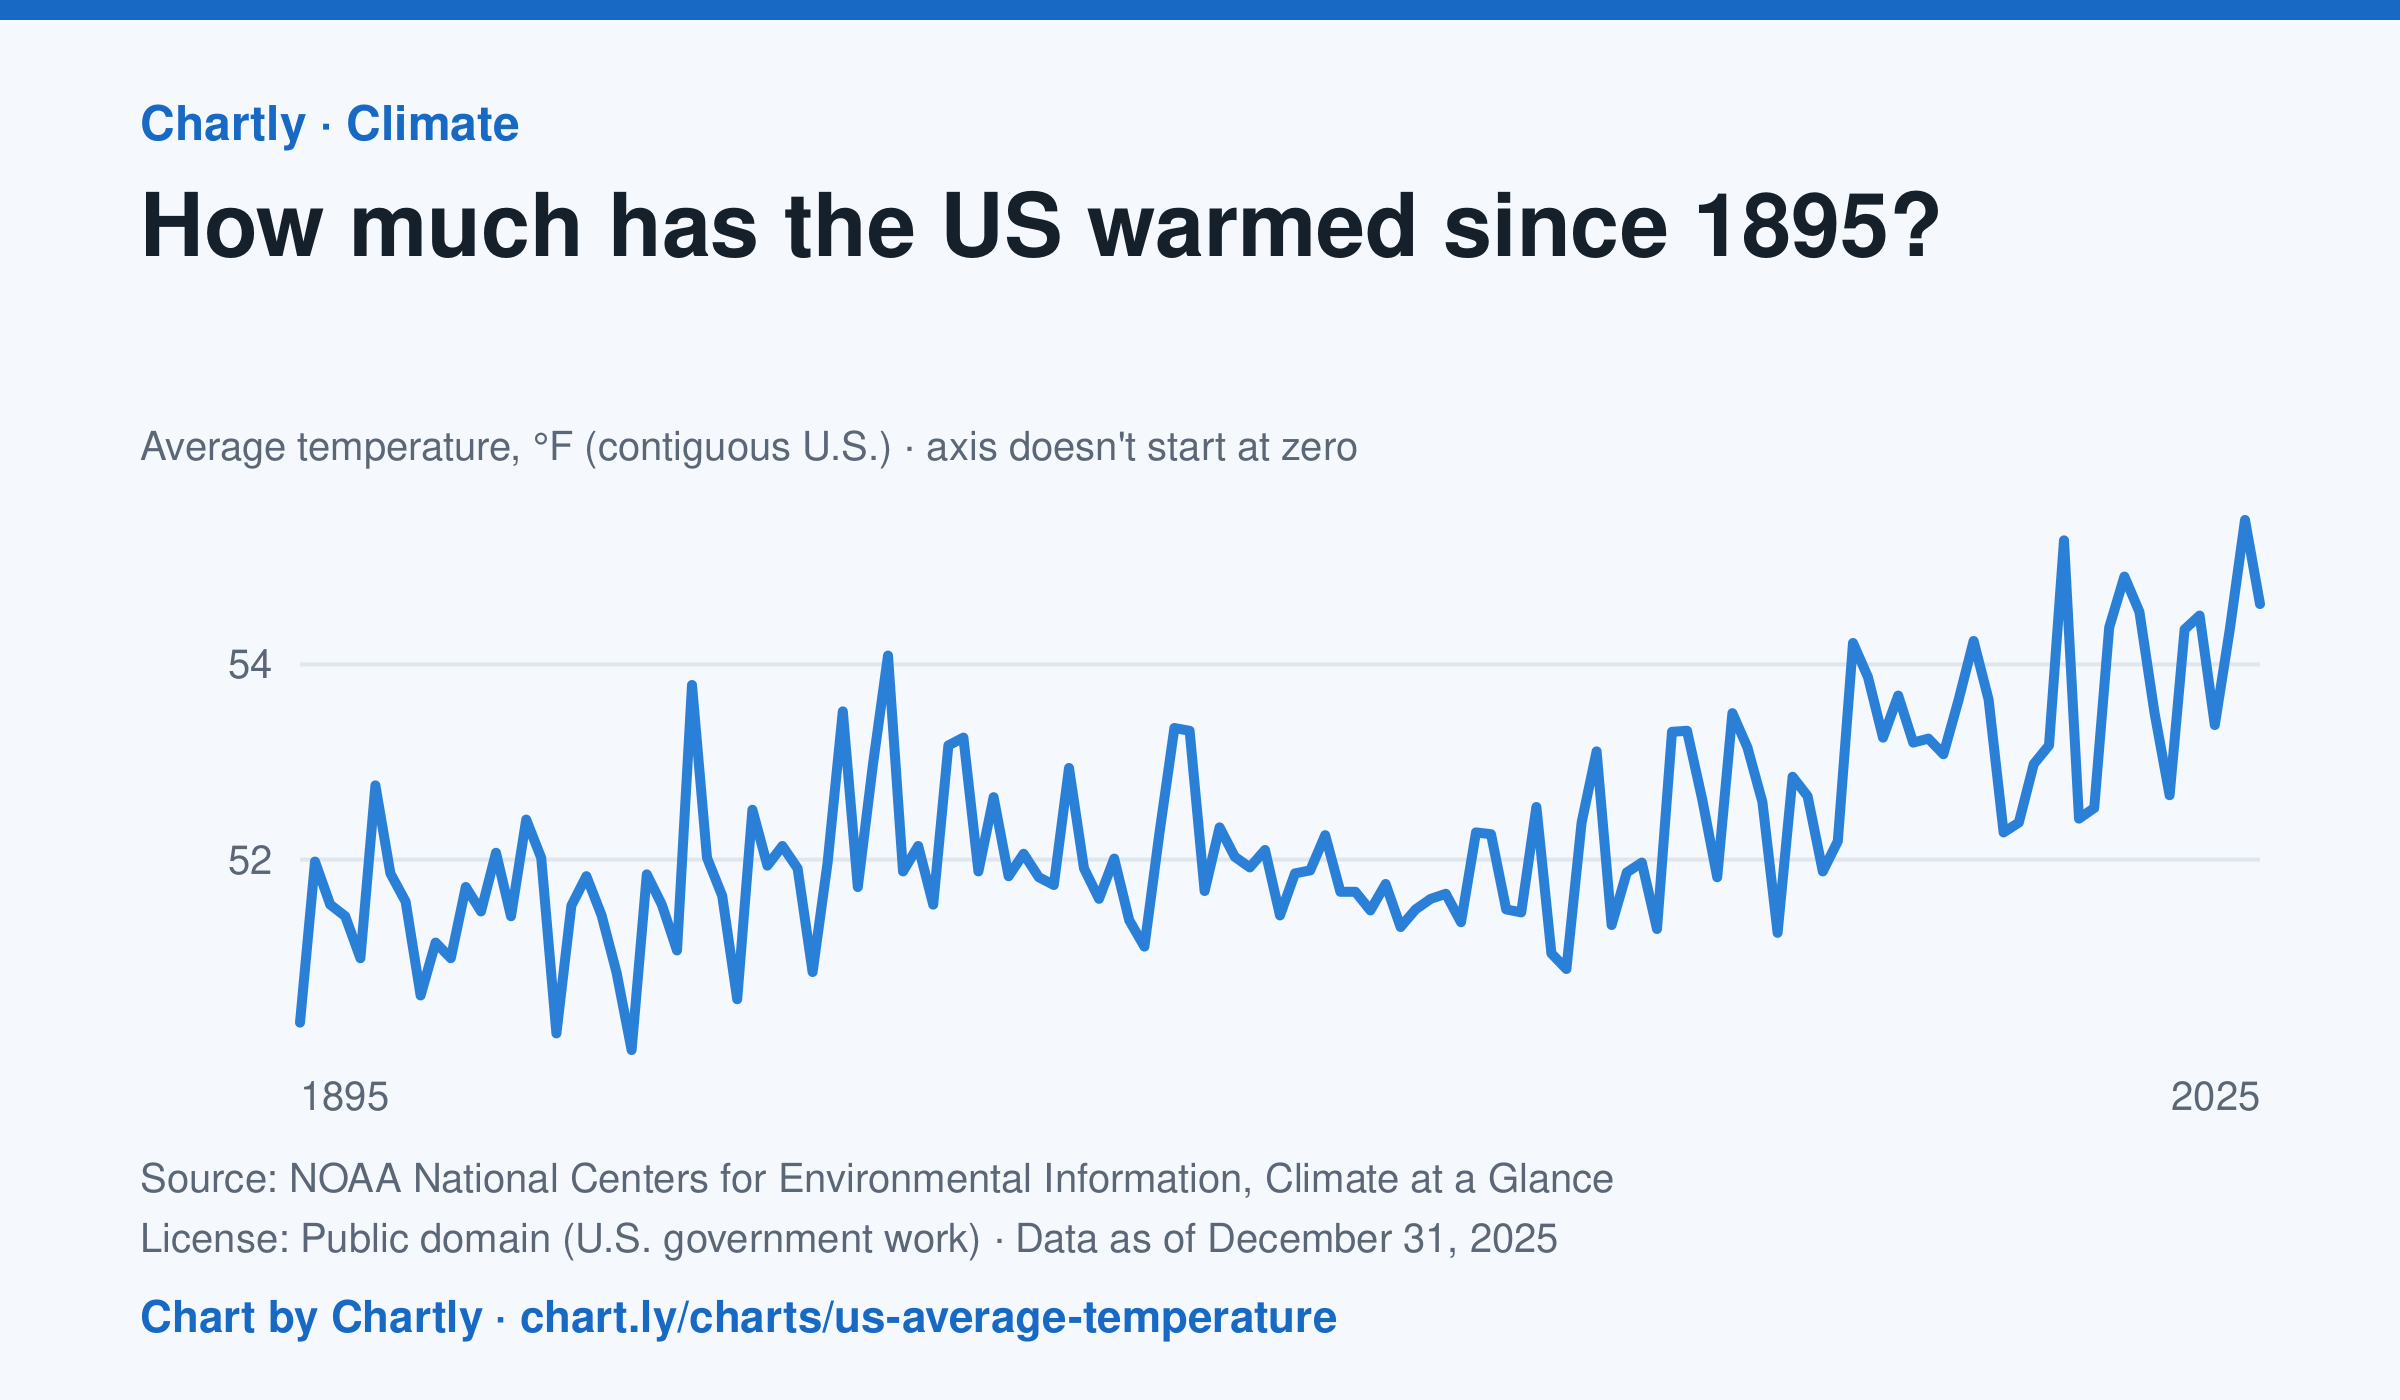
The contiguous US averaged 54.6°F in 2025. The warmest year since records began in 1895 was 2024, at 55.5°F. Through 2025, the dashed trend line, the straight line that best fits every year, rose about 0.18°F a decade, or 2.3°F since 1895, and warming had sped up to about 0.5°F a decade since 1970. Alaska and Hawaii aren't included.
Source: NOAA National Centers for Environmental Information, Climate at a Glance (Public domain (U.S. government work)) · Data as of Dec 31, 2025
How to read this chart
Each point is one year's average temperature across the lower 48 states, in degrees Fahrenheit. The axis doesn't start at zero, so a small rise looks steep: read the numbers on the axis, not the height of the line. The dashed line is the trend, the straight line that best fits every year; single years bounce above and below it.
Questions
- Find the warmest and coolest years on the chart. How many degrees apart are they?
- Why might one year be much cooler than the year before, even while the trend line keeps rising?
- The axis doesn't start at zero here, but bar charts always do. Why is that fair for temperatures but not for bars?
Chart and numbers: chart.ly/charts/us-average-temperature · More free charts at chart.ly