Print this worksheet, or choose "Save as PDF" in the print window to share a file.
Chart worksheet
Charts to read and discuss
Name:
Class:
Date:
Chart 1 of 1 · Federal budget
How big is the federal debt compared with the economy?
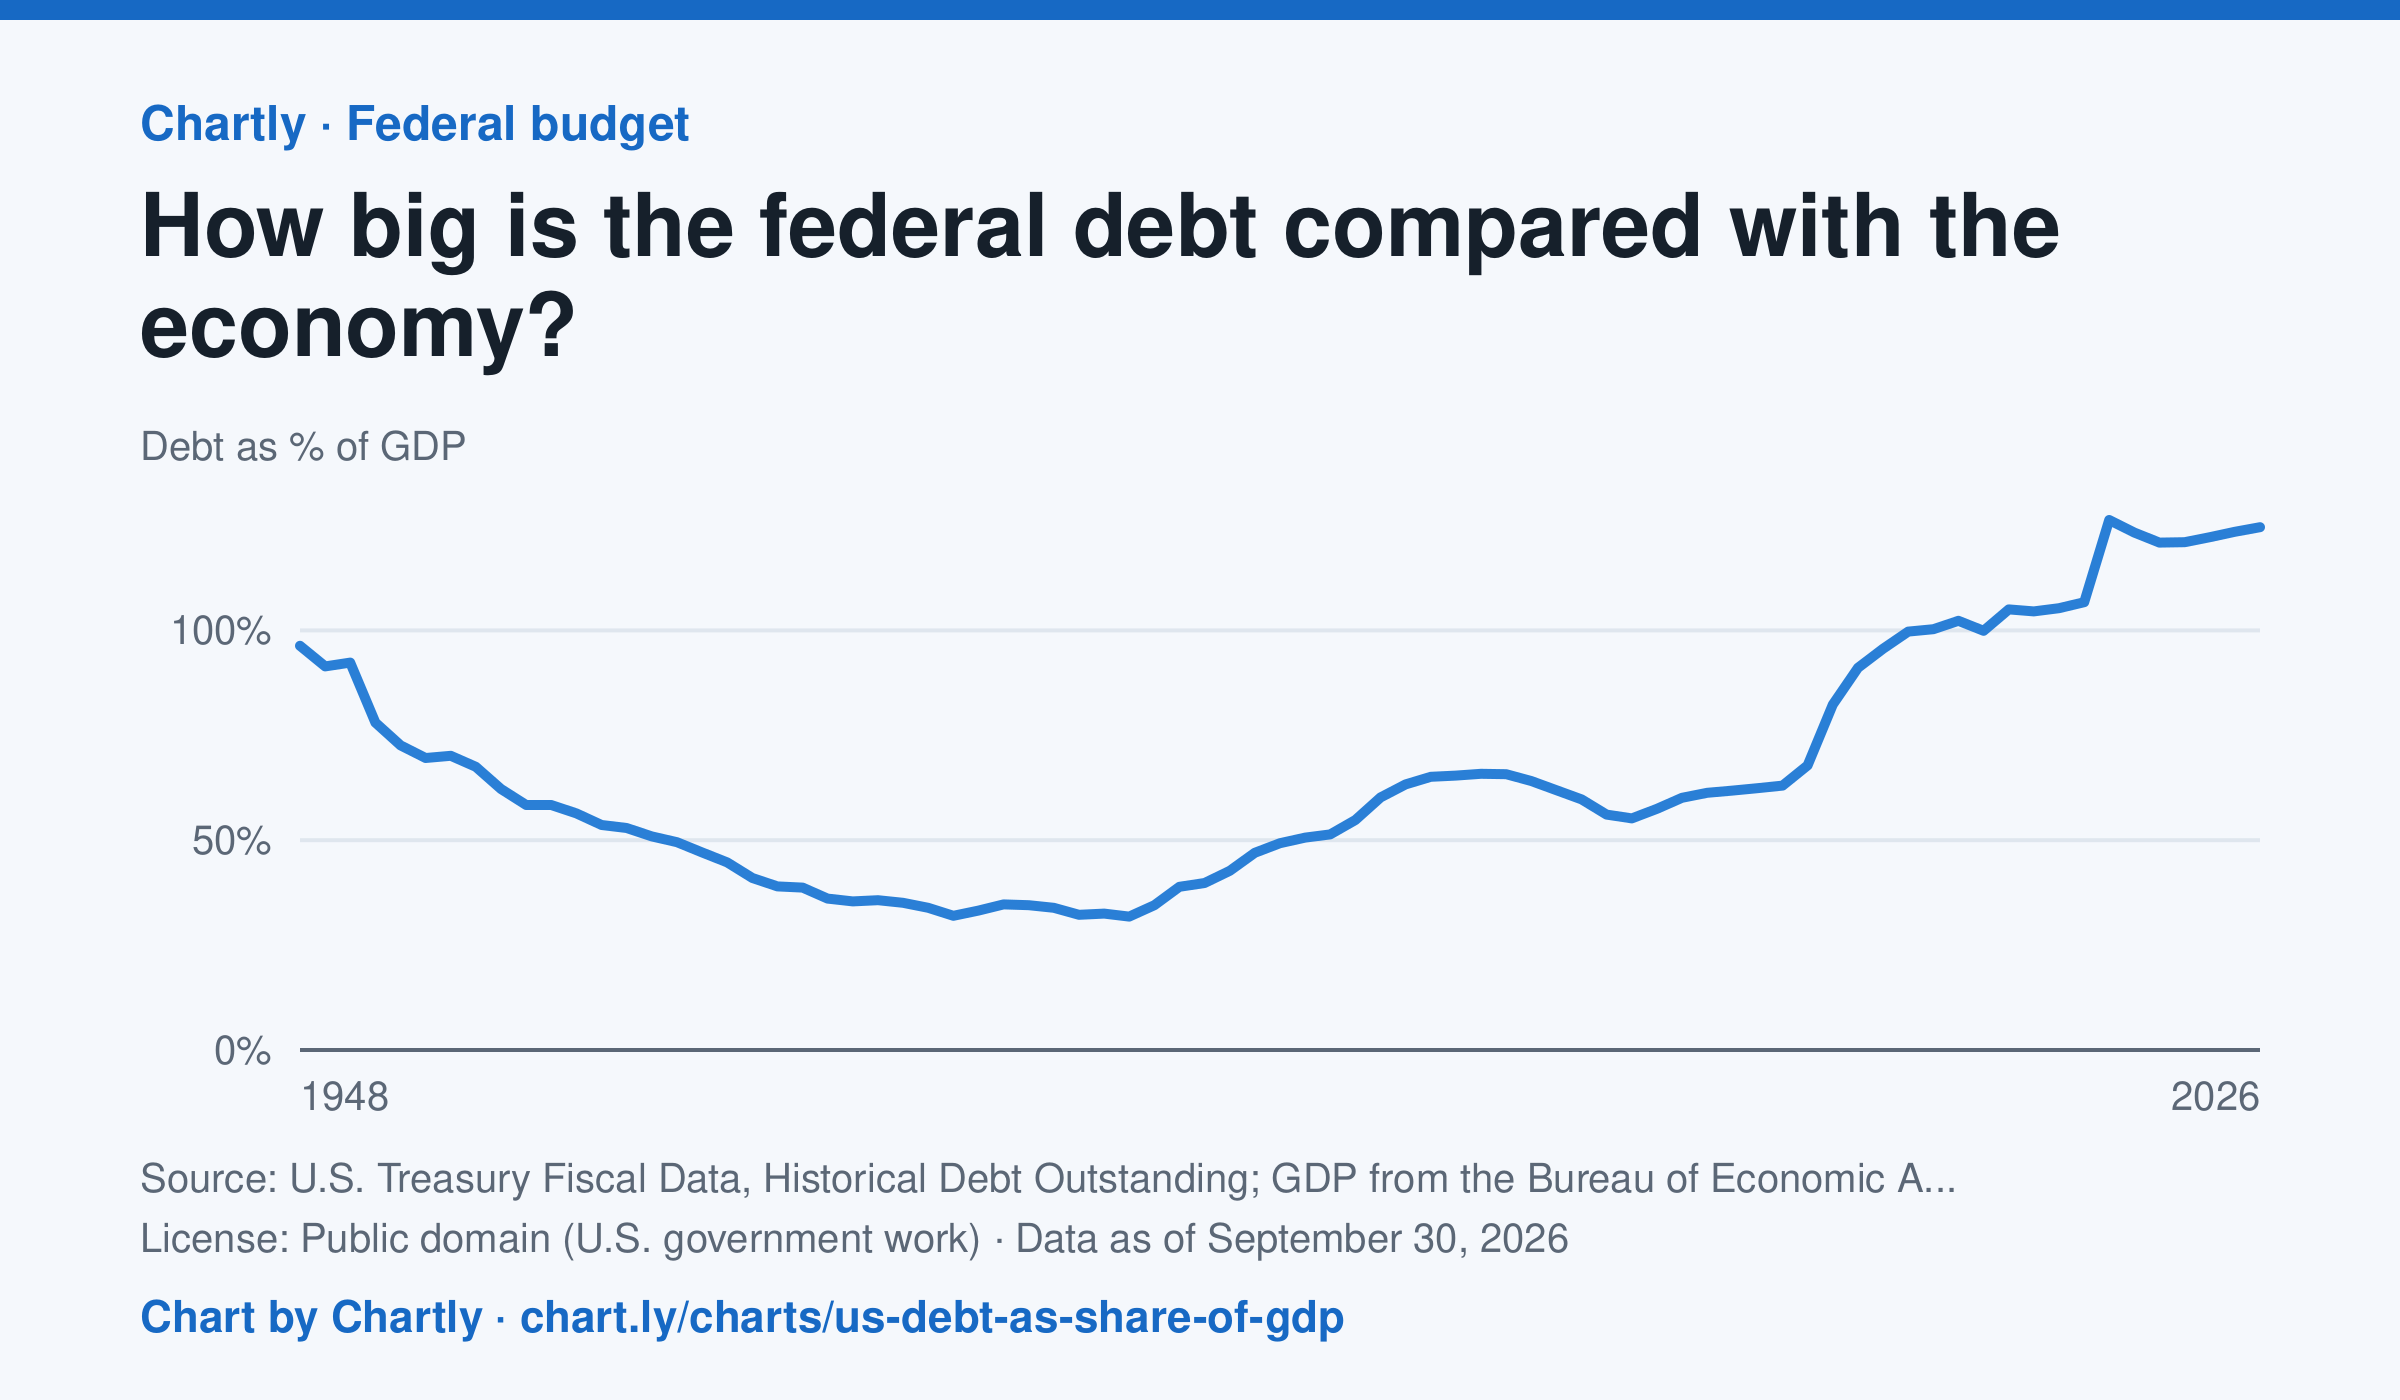
At the end of fiscal 2026 the federal debt was 125% of a year's GDP, everything the U.S. economy produces in a year. It fell from 96% in 1948 to a low of 32% in 1981, passed 100% in 2013 and jumped to 126% in 2020. This is total debt, including what the government owes its own trust funds, divided by GDP over the same fiscal year; it starts in 1948 because BEA's quarterly GDP starts in 1947, and recent GDP figures are revised.
Source: U.S. Treasury Fiscal Data, Historical Debt Outstanding; GDP from the Bureau of Economic Analysis (NIPA Table 1.1.5) (Public domain (U.S. government work)) · Data as of Sep 30, 2026
How to read this chart
Each point divides the federal government's total debt by GDP, everything the U.S. economy produces in a year. At 100%, the debt equals one year of the whole economy's output. Comparing debt with the economy's size, instead of in dollars, makes years decades apart fair to compare.
Questions
- When was the debt smallest compared with the economy, and when was it largest?
- The debt can grow in dollars while this percentage falls. How is that possible?
- Pick a big jump on the chart. What events could make the government borrow much more in a short time?
Chart and numbers: chart.ly/charts/us-debt-as-share-of-gdp · More free charts at chart.ly