Print this worksheet, or choose "Save as PDF" in the print window to share a file.
Chart worksheet
AP Statistics chart assignment
Name:
Class:
Date:
Chart 1 of 1 · Climate
How much has the US warmed since 1895?
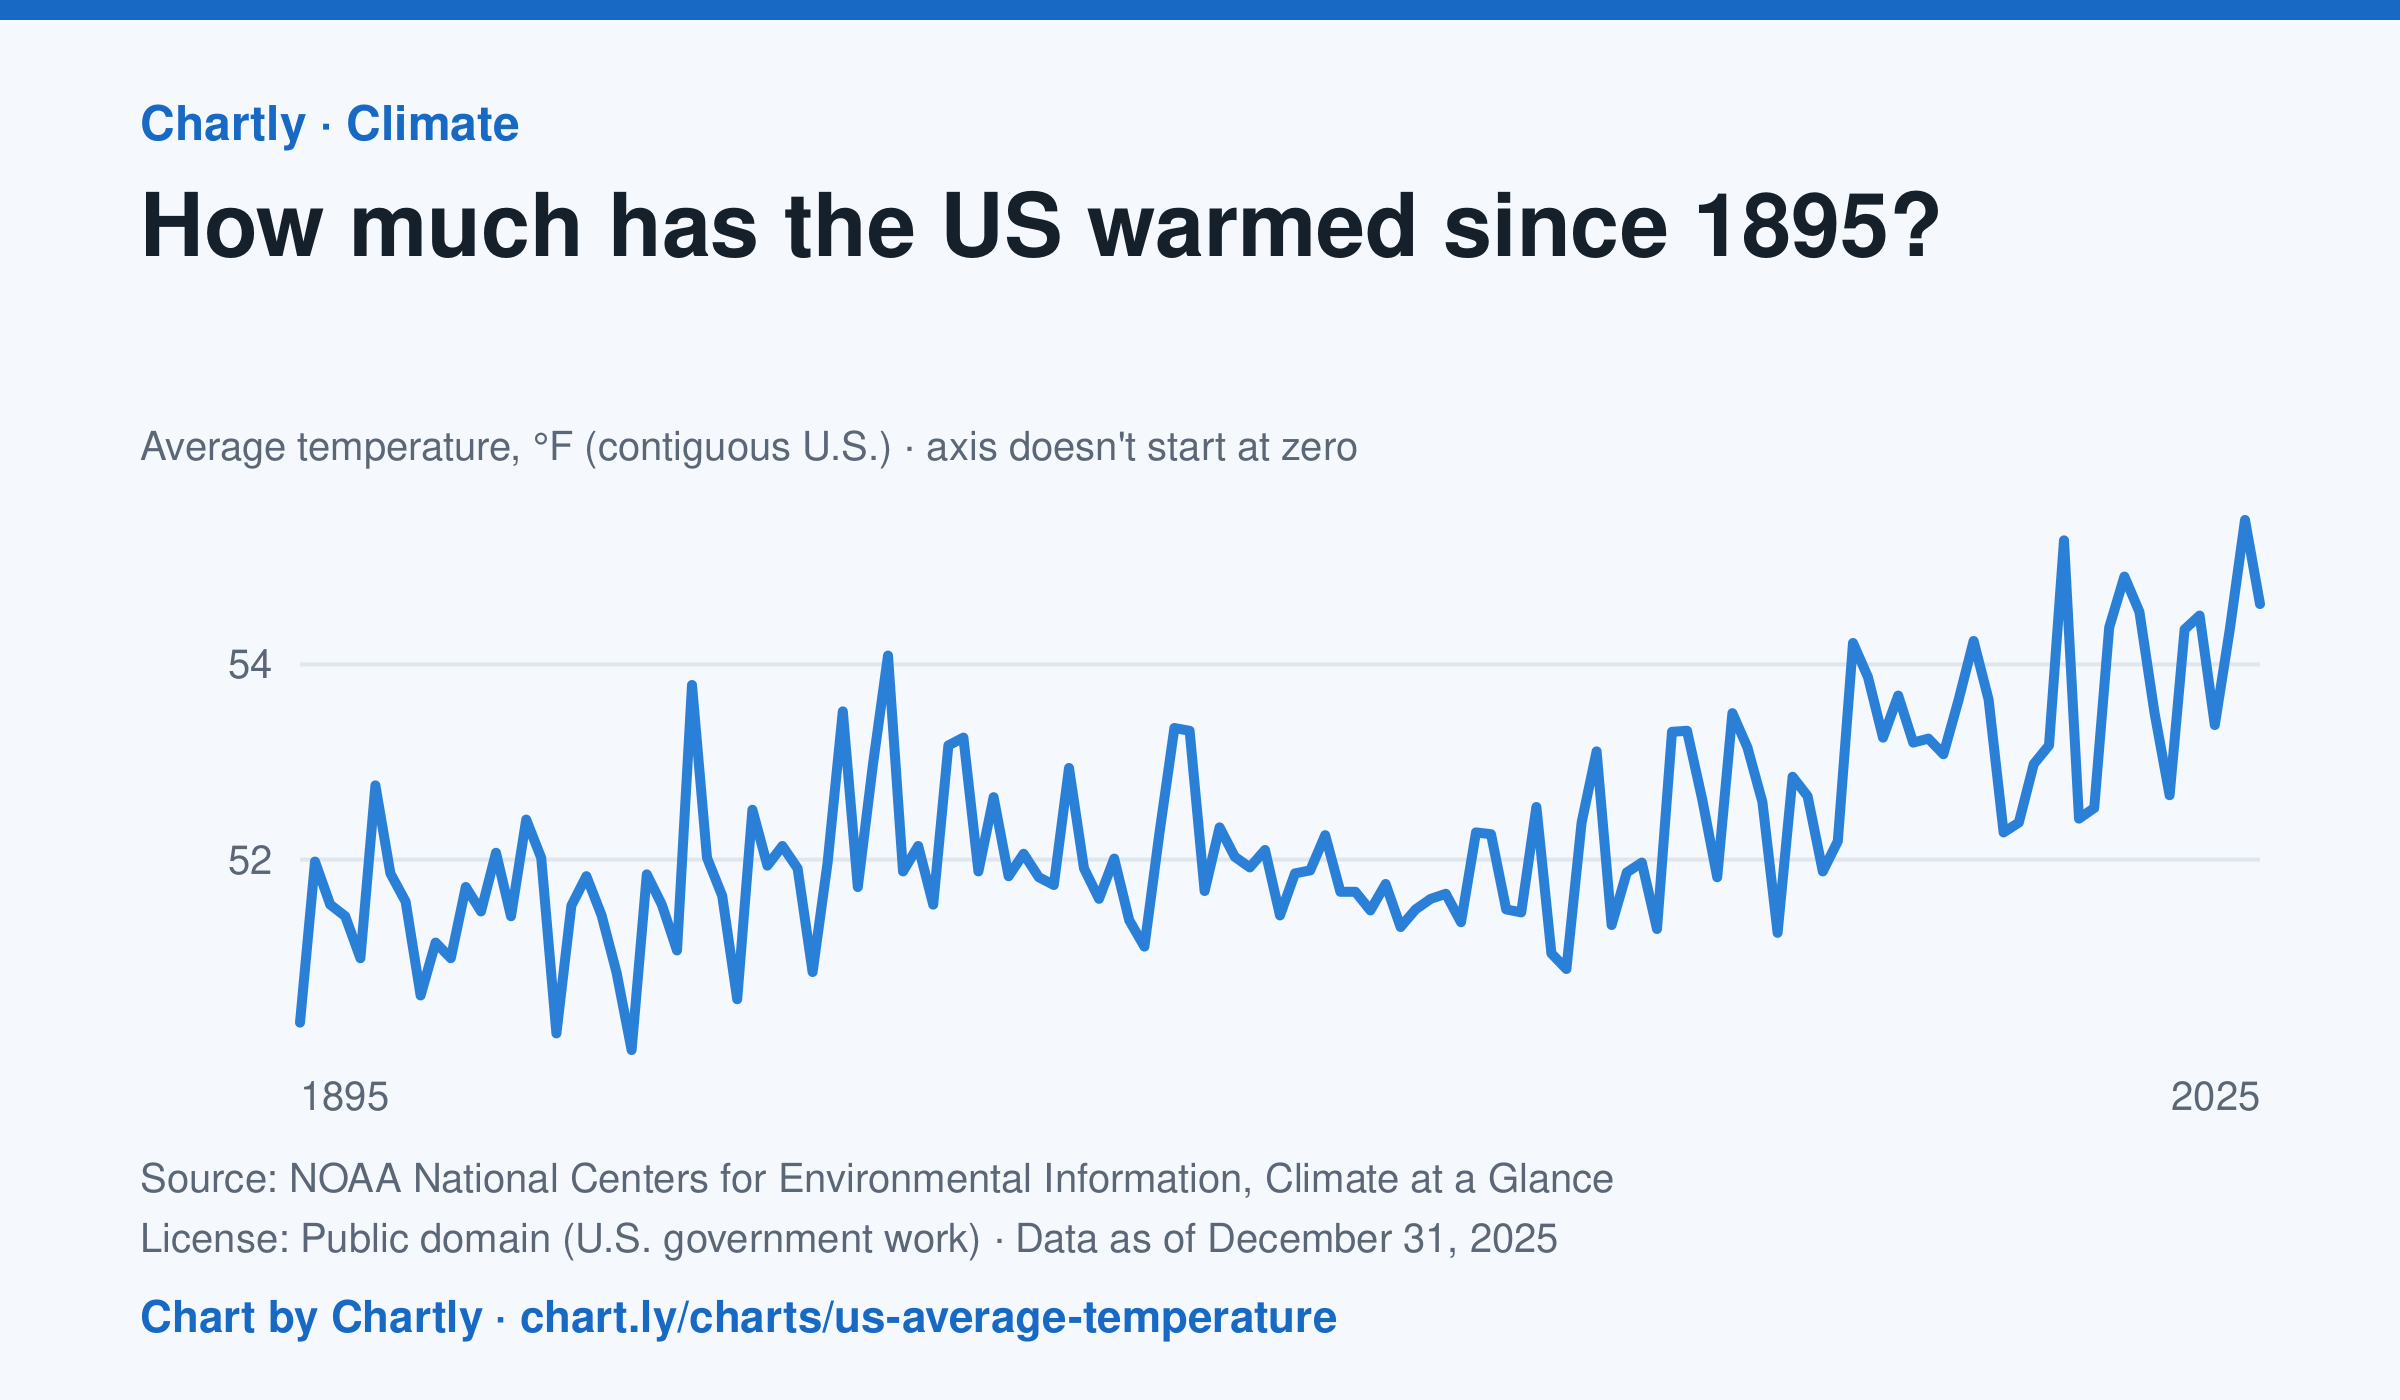
The contiguous US averaged 54.6°F in 2025. The warmest year since records began in 1895 was 2024, at 55.5°F. Through 2025, the dashed trend line, the straight line that best fits every year, rose about 0.18°F a decade, or 2.3°F since 1895, and warming had sped up to about 0.5°F a decade since 1970. Alaska and Hawaii aren't included.
Source: NOAA National Centers for Environmental Information, Climate at a Glance (Public domain (U.S. government work)) · Data as of Dec 31, 2025
How to read this chart
Each point is one year's average temperature across the lower 48 states, in degrees Fahrenheit. The axis doesn't start at zero, so a small rise looks steep: read the numbers on the axis, not the height of the line. The dashed line is the trend, the straight line that best fits every year; single years bounce above and below it.
Questions
- The dashed line is the least-squares regression line. About how many degrees per decade does its slope rise?
- Single years scatter above and below the line. What does that scatter (the residuals) tell you about any one year?
- Warming sped up after 1970. Why might one straight line fitted to every year since 1895 understate recent change?
Chart and numbers: chart.ly/charts/us-average-temperature · More free charts at chart.ly