Print this worksheet, or choose "Save as PDF" in the print window to share a file.
Chart worksheet
Charts to read and discuss
Name:
Class:
Date:
Chart 1 of 3 · Climate
How much has the US warmed since 1895?
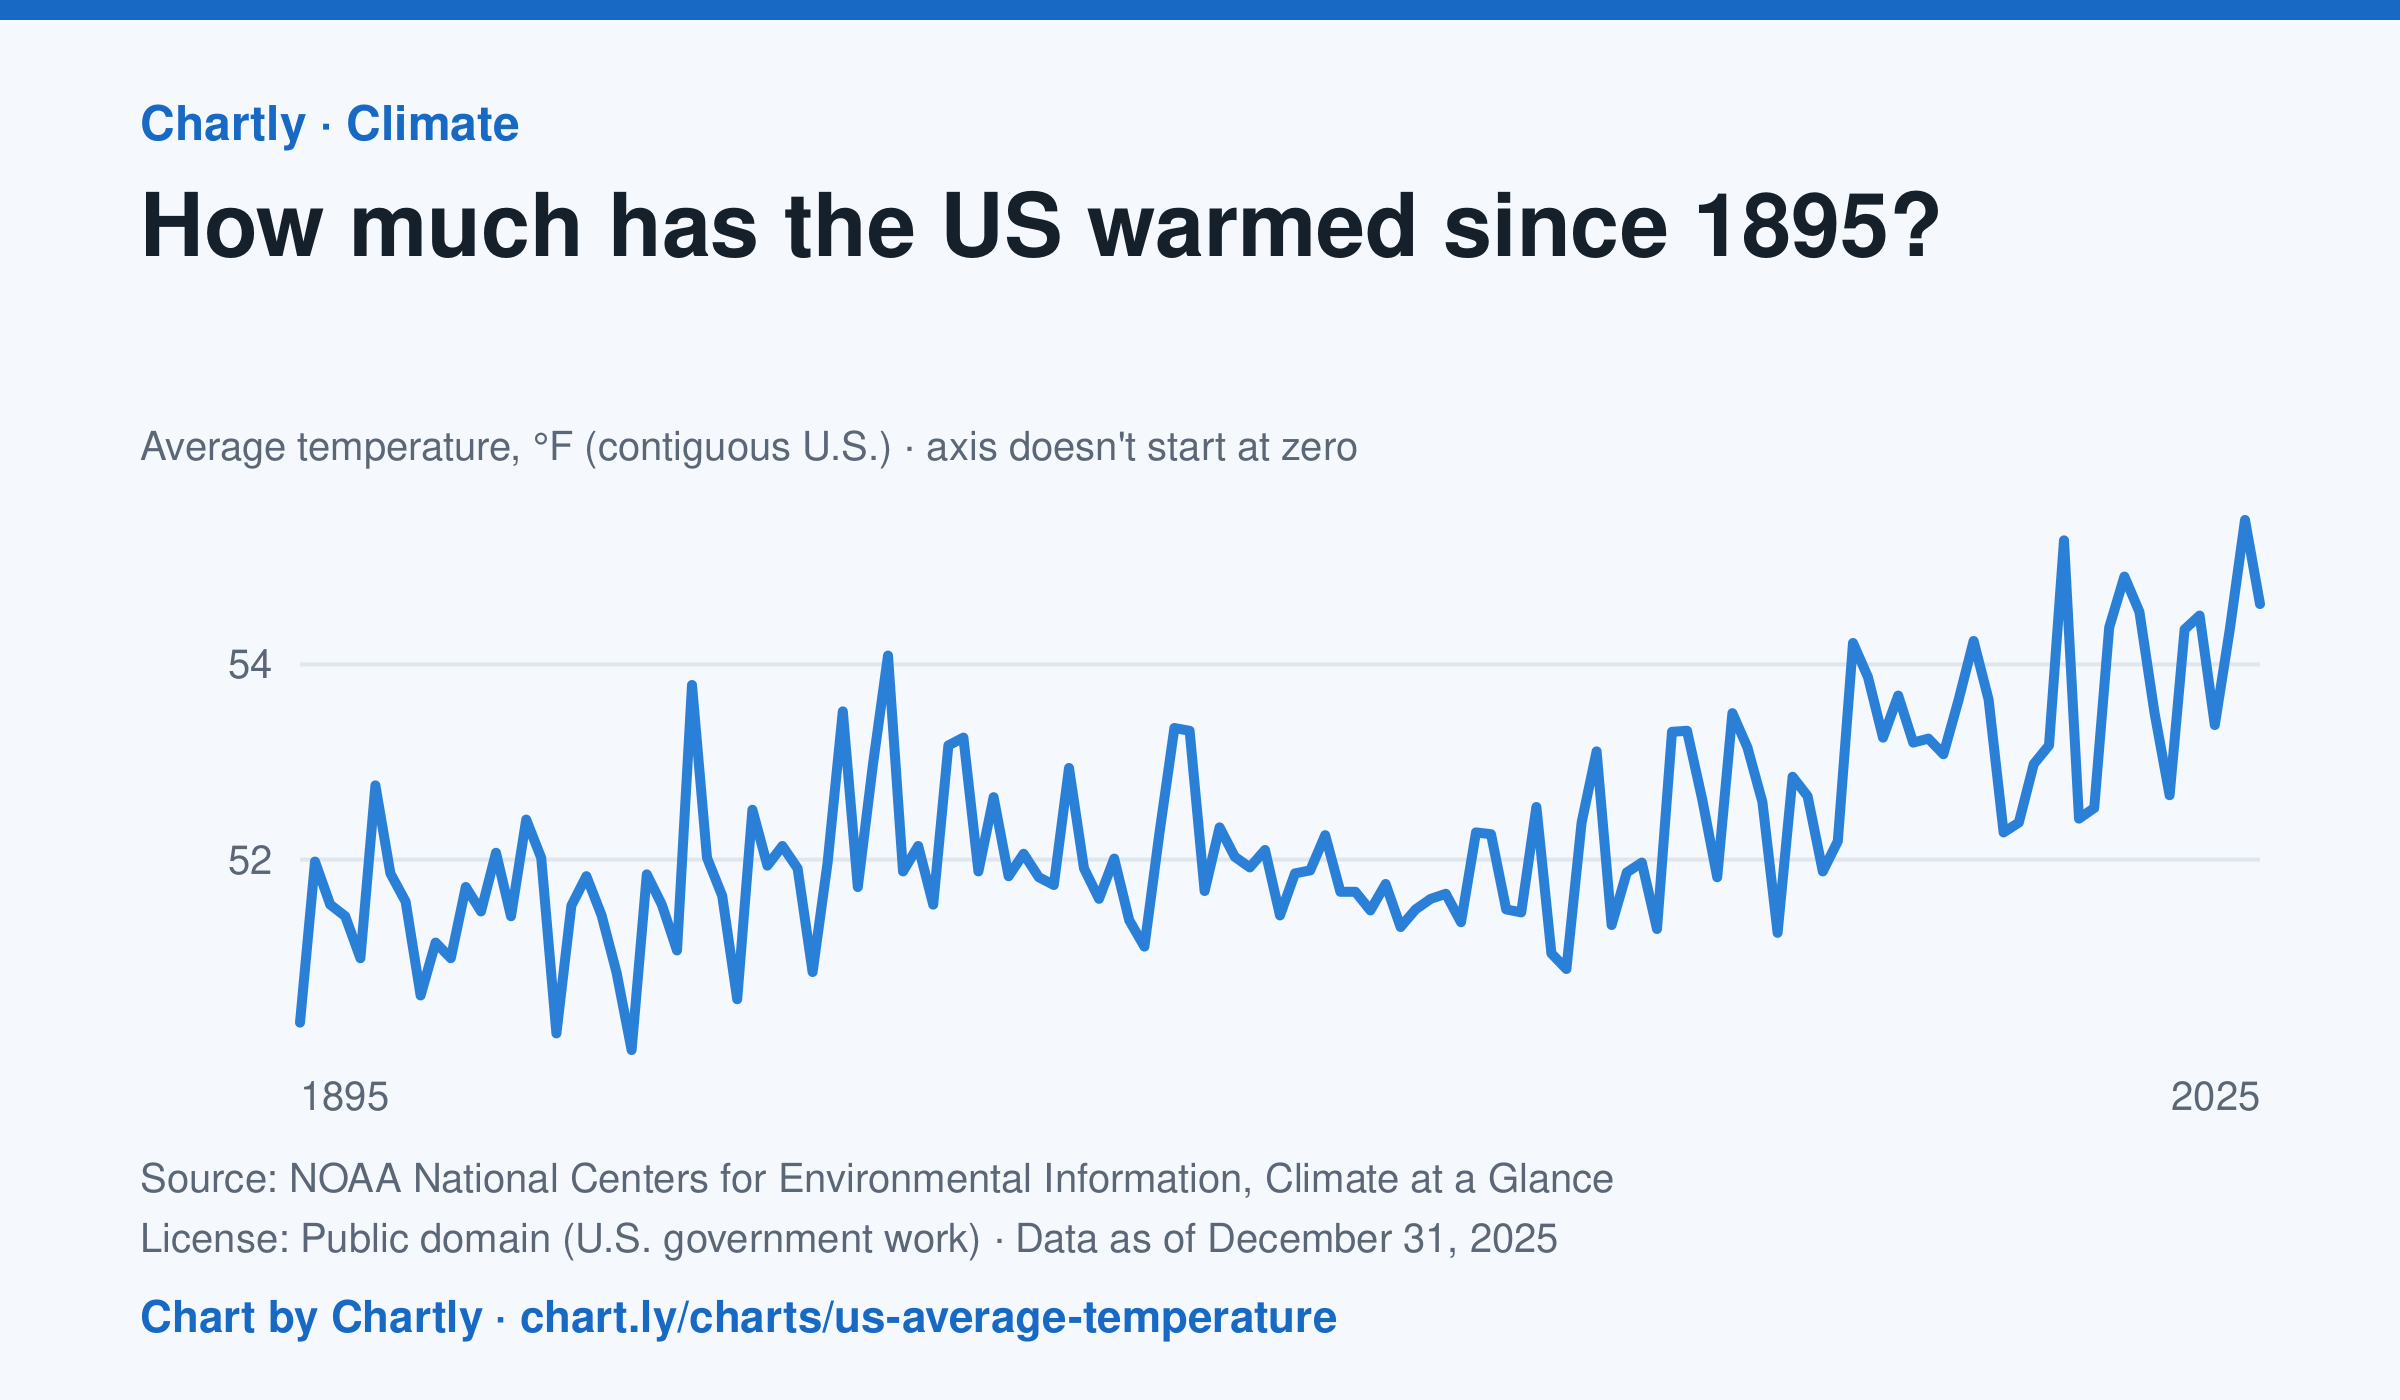
The contiguous US averaged 54.6°F in 2025. The warmest year since records began in 1895 was 2024, at 55.5°F. Through 2025, the dashed trend line, the straight line that best fits every year, rose about 0.18°F a decade, or 2.3°F since 1895, and warming had sped up to about 0.5°F a decade since 1970. Alaska and Hawaii aren't included.
Source: NOAA National Centers for Environmental Information, Climate at a Glance (Public domain (U.S. government work)) · Data as of Dec 31, 2025
How to read this chart
Each point is one year's average temperature across the lower 48 states, in degrees Fahrenheit. The axis doesn't start at zero, so a small rise looks steep: read the numbers on the axis, not the height of the line. The dashed line is the trend, the straight line that best fits every year; single years bounce above and below it.
Questions
- Find the warmest and coolest years on the chart. How many degrees apart are they?
- Why might one year be much cooler than the year before, even while the trend line keeps rising?
- The axis doesn't start at zero here, but bar charts always do. Why is that fair for temperatures but not for bars?
Chart and numbers: chart.ly/charts/us-average-temperature · More free charts at chart.ly
Chart 2 of 3 · Climate
Which US states have warmed the most?
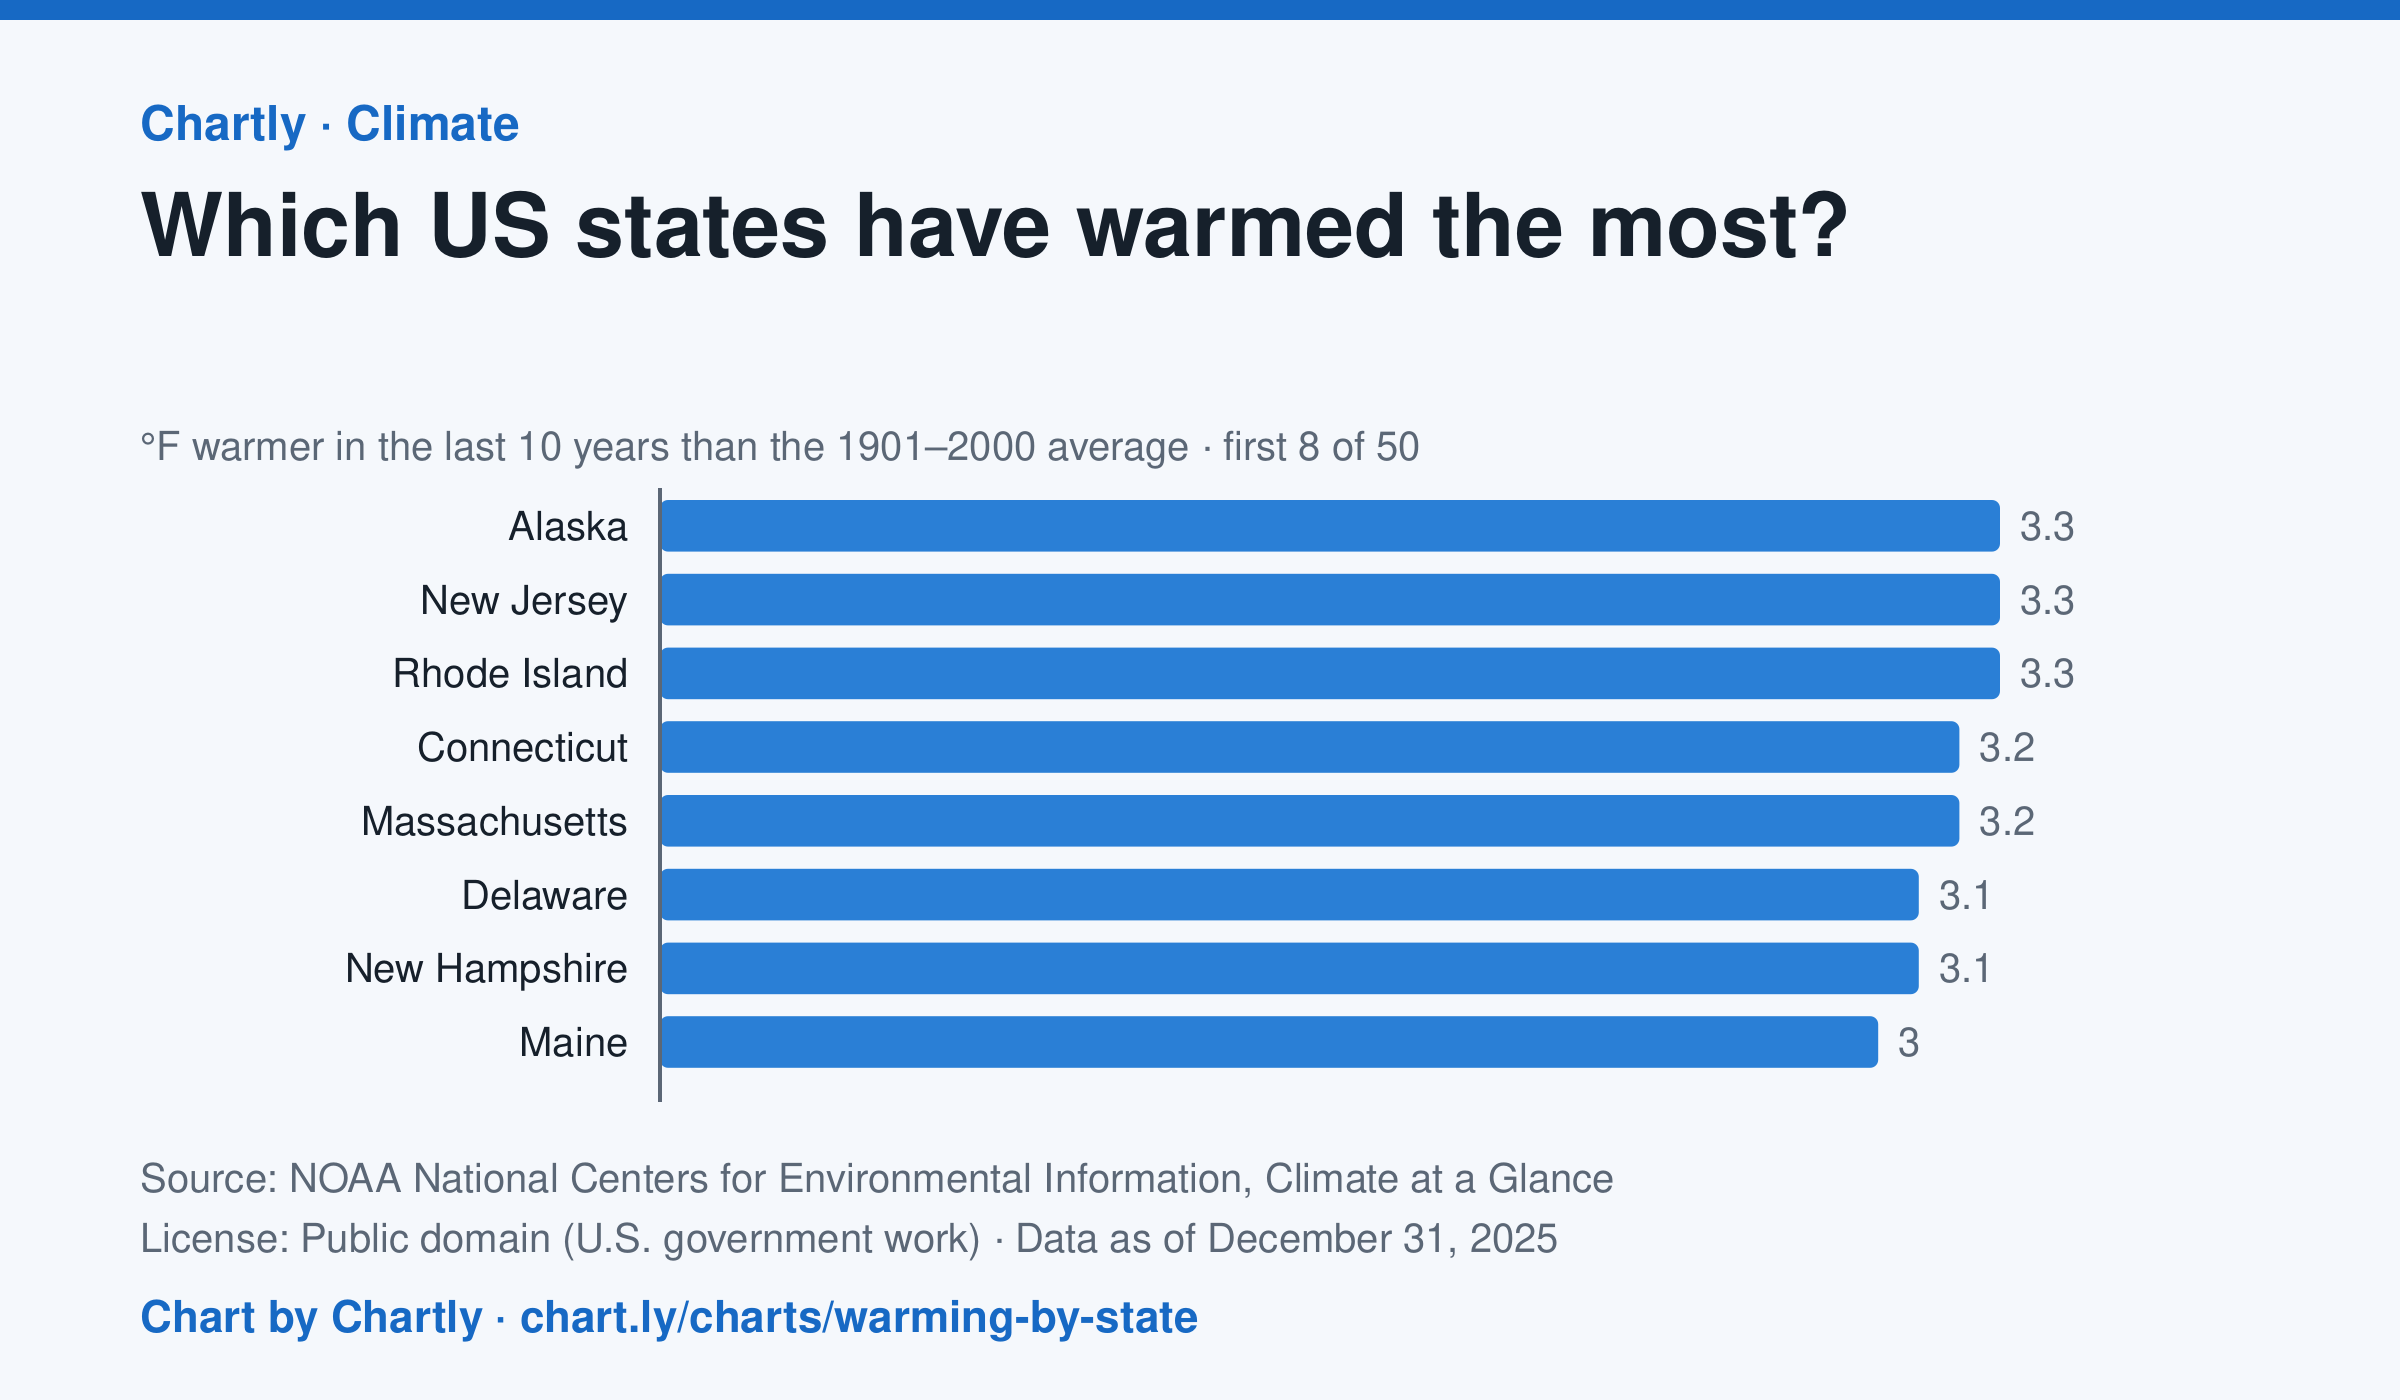
In the 10 years through 2025, Alaska was among the states that warmed most, averaging 3.3°F warmer than in 1901–2000, while Oklahoma was among those that warmed least, 1.6°F; the contiguous US warmed 2.2°F. Alaska's records start in 1925, so its baseline is 1925–2000. Hawaii's start in 1991, so it isn't included.
Source: NOAA National Centers for Environmental Information, Climate at a Glance (Public domain (U.S. government work)) · Data as of Dec 31, 2025
How to read this chart
Each bar shows how much warmer a state's last 10 years were than its average for 1901 to 2000, in degrees Fahrenheit. Ten years are averaged so one hot or cold year doesn't decide a state's place. The dashed line is the whole lower 48 states.
Questions
- Which states warmed the most and the least? How many degrees apart are they?
- Do the states that warmed most sit together in one part of the country, or are they spread out?
- Why do scientists compare with a long average like 1901 to 2000 instead of with just last year?
Chart and numbers: chart.ly/charts/warming-by-state · More free charts at chart.ly
Chart 3 of 3 · Crime
Is violent crime in the U.S. going up or down?
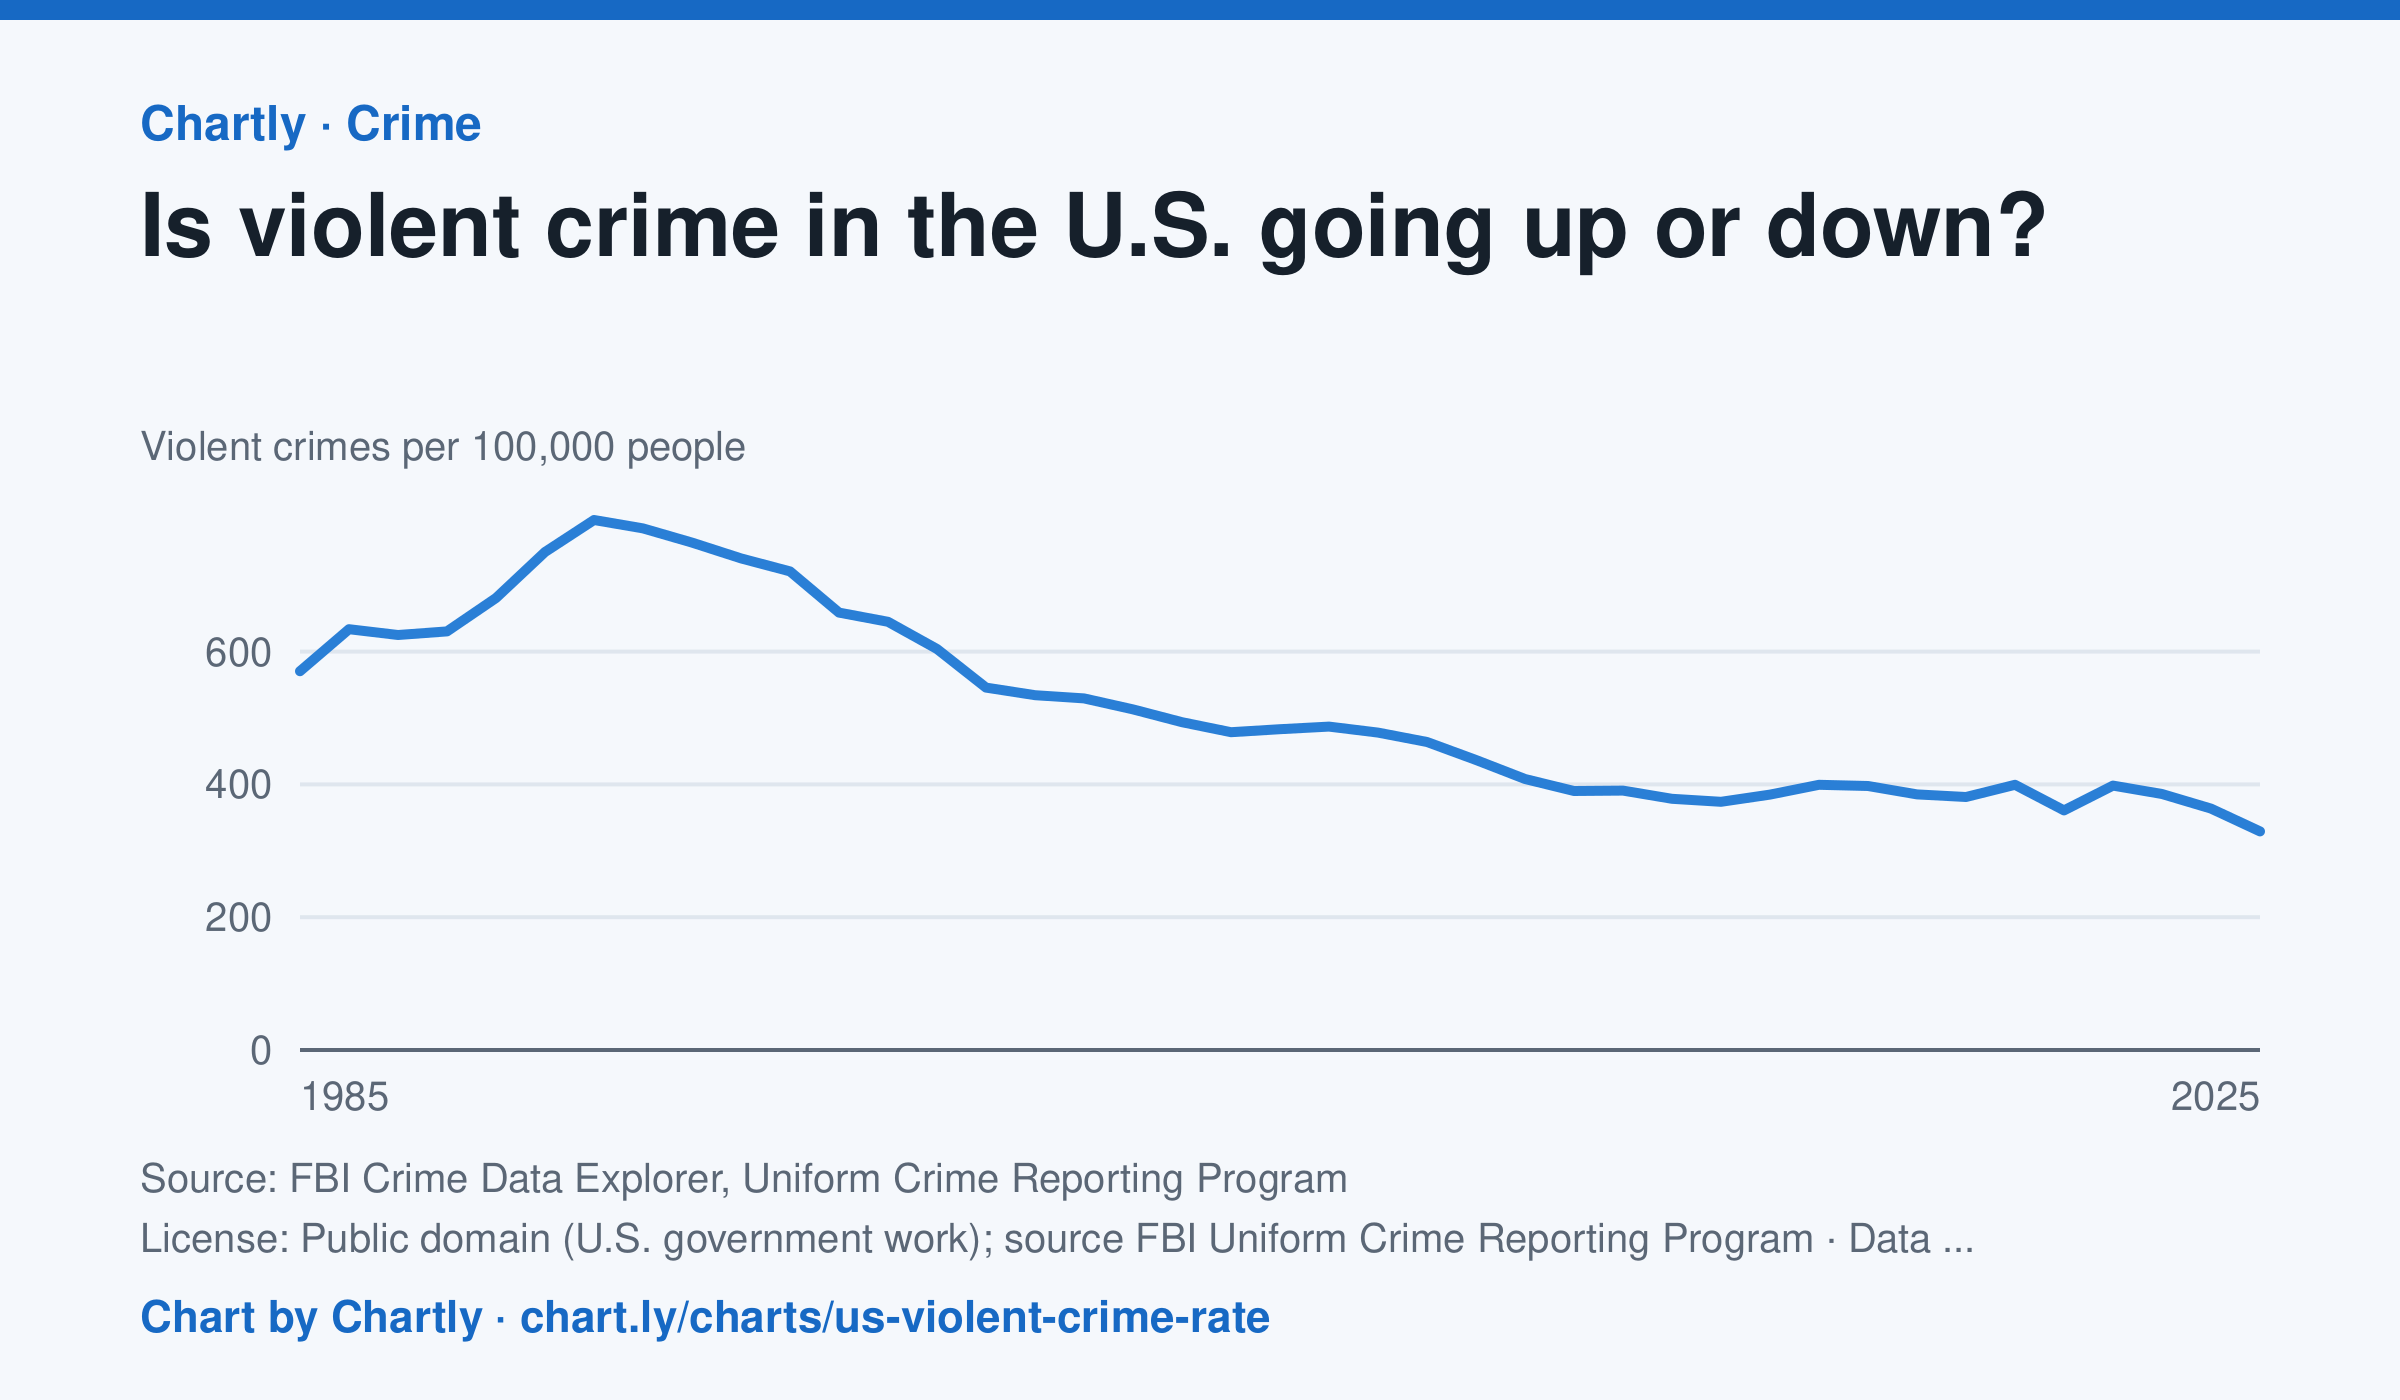
Down, over the long run. Police reported about 329 violent crimes per 100,000 people in 2025, about 59% below the 1991 peak of about 798, and the lowest since at least 1985. The rate rose in 2020 and 2022, then fell in 2023, 2024 and 2025. In 2021 the FBI stopped taking its old summary reports and accepted only its newer, more detailed system (NIBRS); many police departments hadn't switched yet, so agencies covering only about 77% of Americans reported, against 88 to 98% in other years, and 2021's number is less certain. Rates count only the agencies that reported, so they differ a little from the FBI's national estimates, and the FBI widened its definition of rape in 2013.
Source: FBI Crime Data Explorer, Uniform Crime Reporting Program (Public domain (U.S. government work); source FBI Uniform Crime Reporting Program) · Data as of Dec 31, 2025
How to read this chart
Each point is the number of violent crimes police reported for every 100,000 Americans that year. The line starts at zero, so its height shows the true size. In 2021 the FBI changed how it collects reports and fewer police departments sent numbers, so that year is less certain than the others.
Questions
- Find the year with the highest rate. About how much lower is the rate in the latest year?
- Many people say they think crime is rising. How could that belief and this chart both seem true to different people?
- Why might a change in how crimes are counted, like the one in 2021, make one year hard to compare with the rest?
Chart and numbers: chart.ly/charts/us-violent-crime-rate · More free charts at chart.ly