Print this worksheet, or choose "Save as PDF" in the print window to share a file.
Chart worksheet
Charts to read and discuss
Name:
Class:
Date:
Chart 1 of 3 · Climate
How much has the US warmed since 1895?
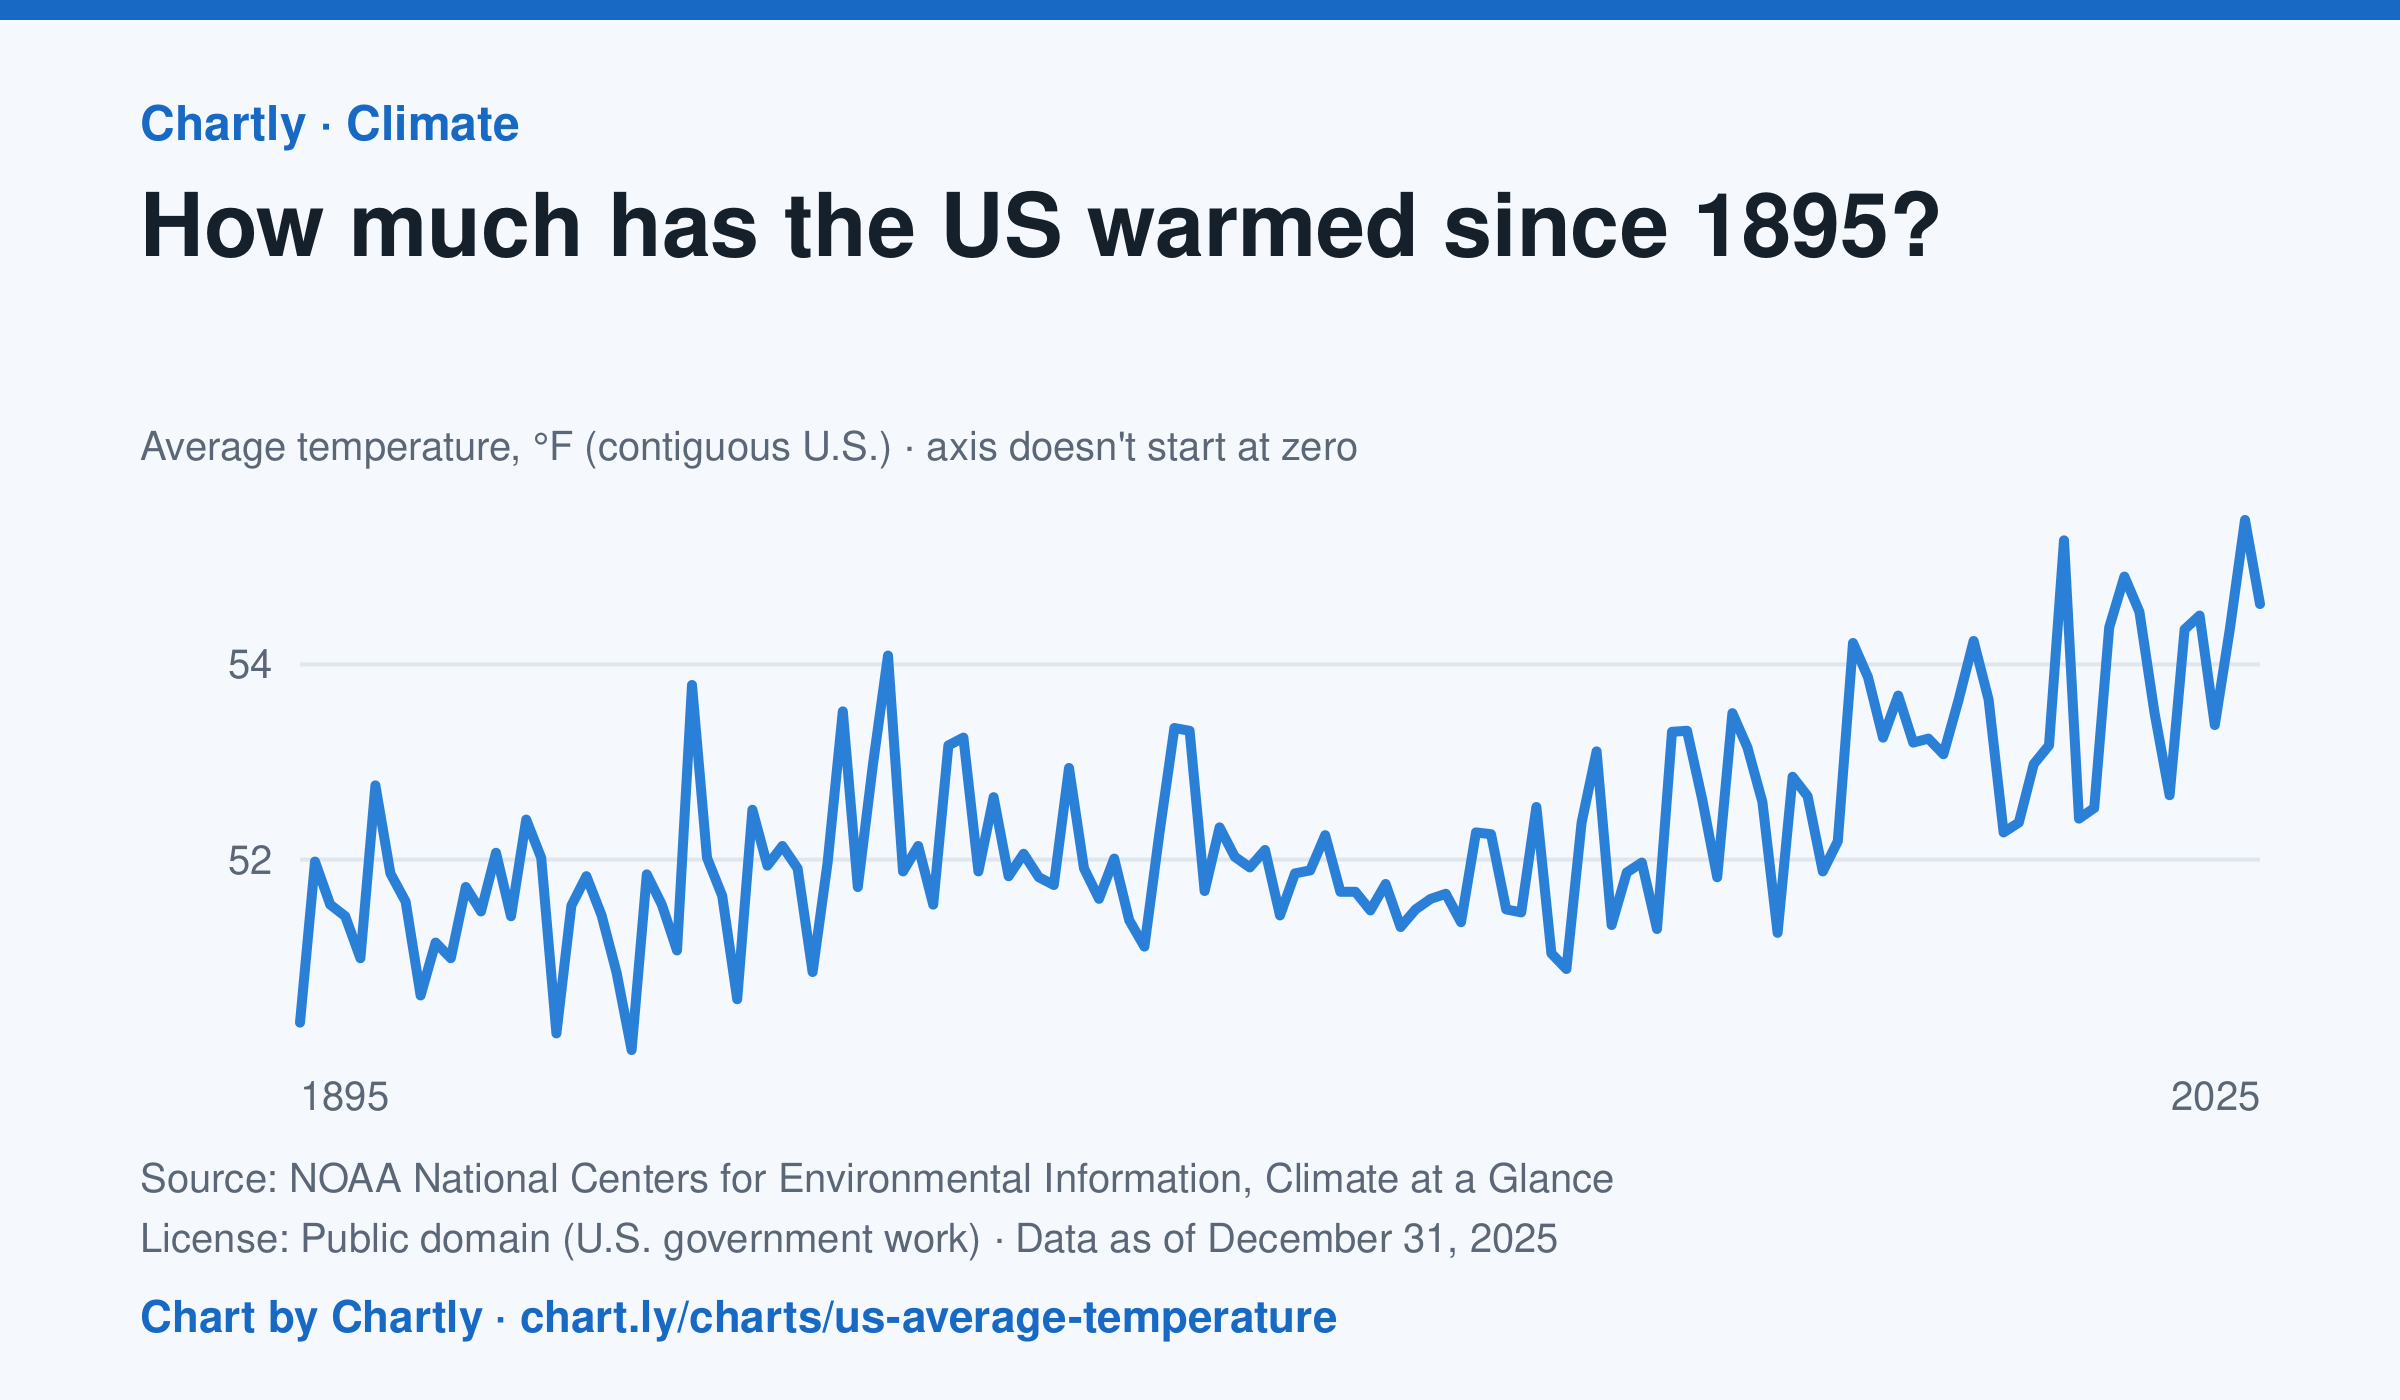
The contiguous US averaged 54.6°F in 2025. The warmest year since records began in 1895 was 2024, at 55.5°F. Through 2025, the dashed trend line, the straight line that best fits every year, rose about 0.18°F a decade, or 2.3°F since 1895, and warming had sped up to about 0.5°F a decade since 1970. Alaska and Hawaii aren't included.
Source: NOAA National Centers for Environmental Information, Climate at a Glance (Public domain (U.S. government work)) · Data as of Dec 31, 2025
How to read this chart
Each point is one year's average temperature across the lower 48 states, in degrees Fahrenheit. The axis doesn't start at zero, so a small rise looks steep: read the numbers on the axis, not the height of the line. The dashed line is the trend, the straight line that best fits every year; single years bounce above and below it.
Questions
- Find the warmest and coolest years on the chart. How many degrees apart are they?
- Why might one year be much cooler than the year before, even while the trend line keeps rising?
- The axis doesn't start at zero here, but bar charts always do. Why is that fair for temperatures but not for bars?
Chart and numbers: chart.ly/charts/us-average-temperature · More free charts at chart.ly
Chart 2 of 3 · Jobs and wages
What is the US unemployment rate?
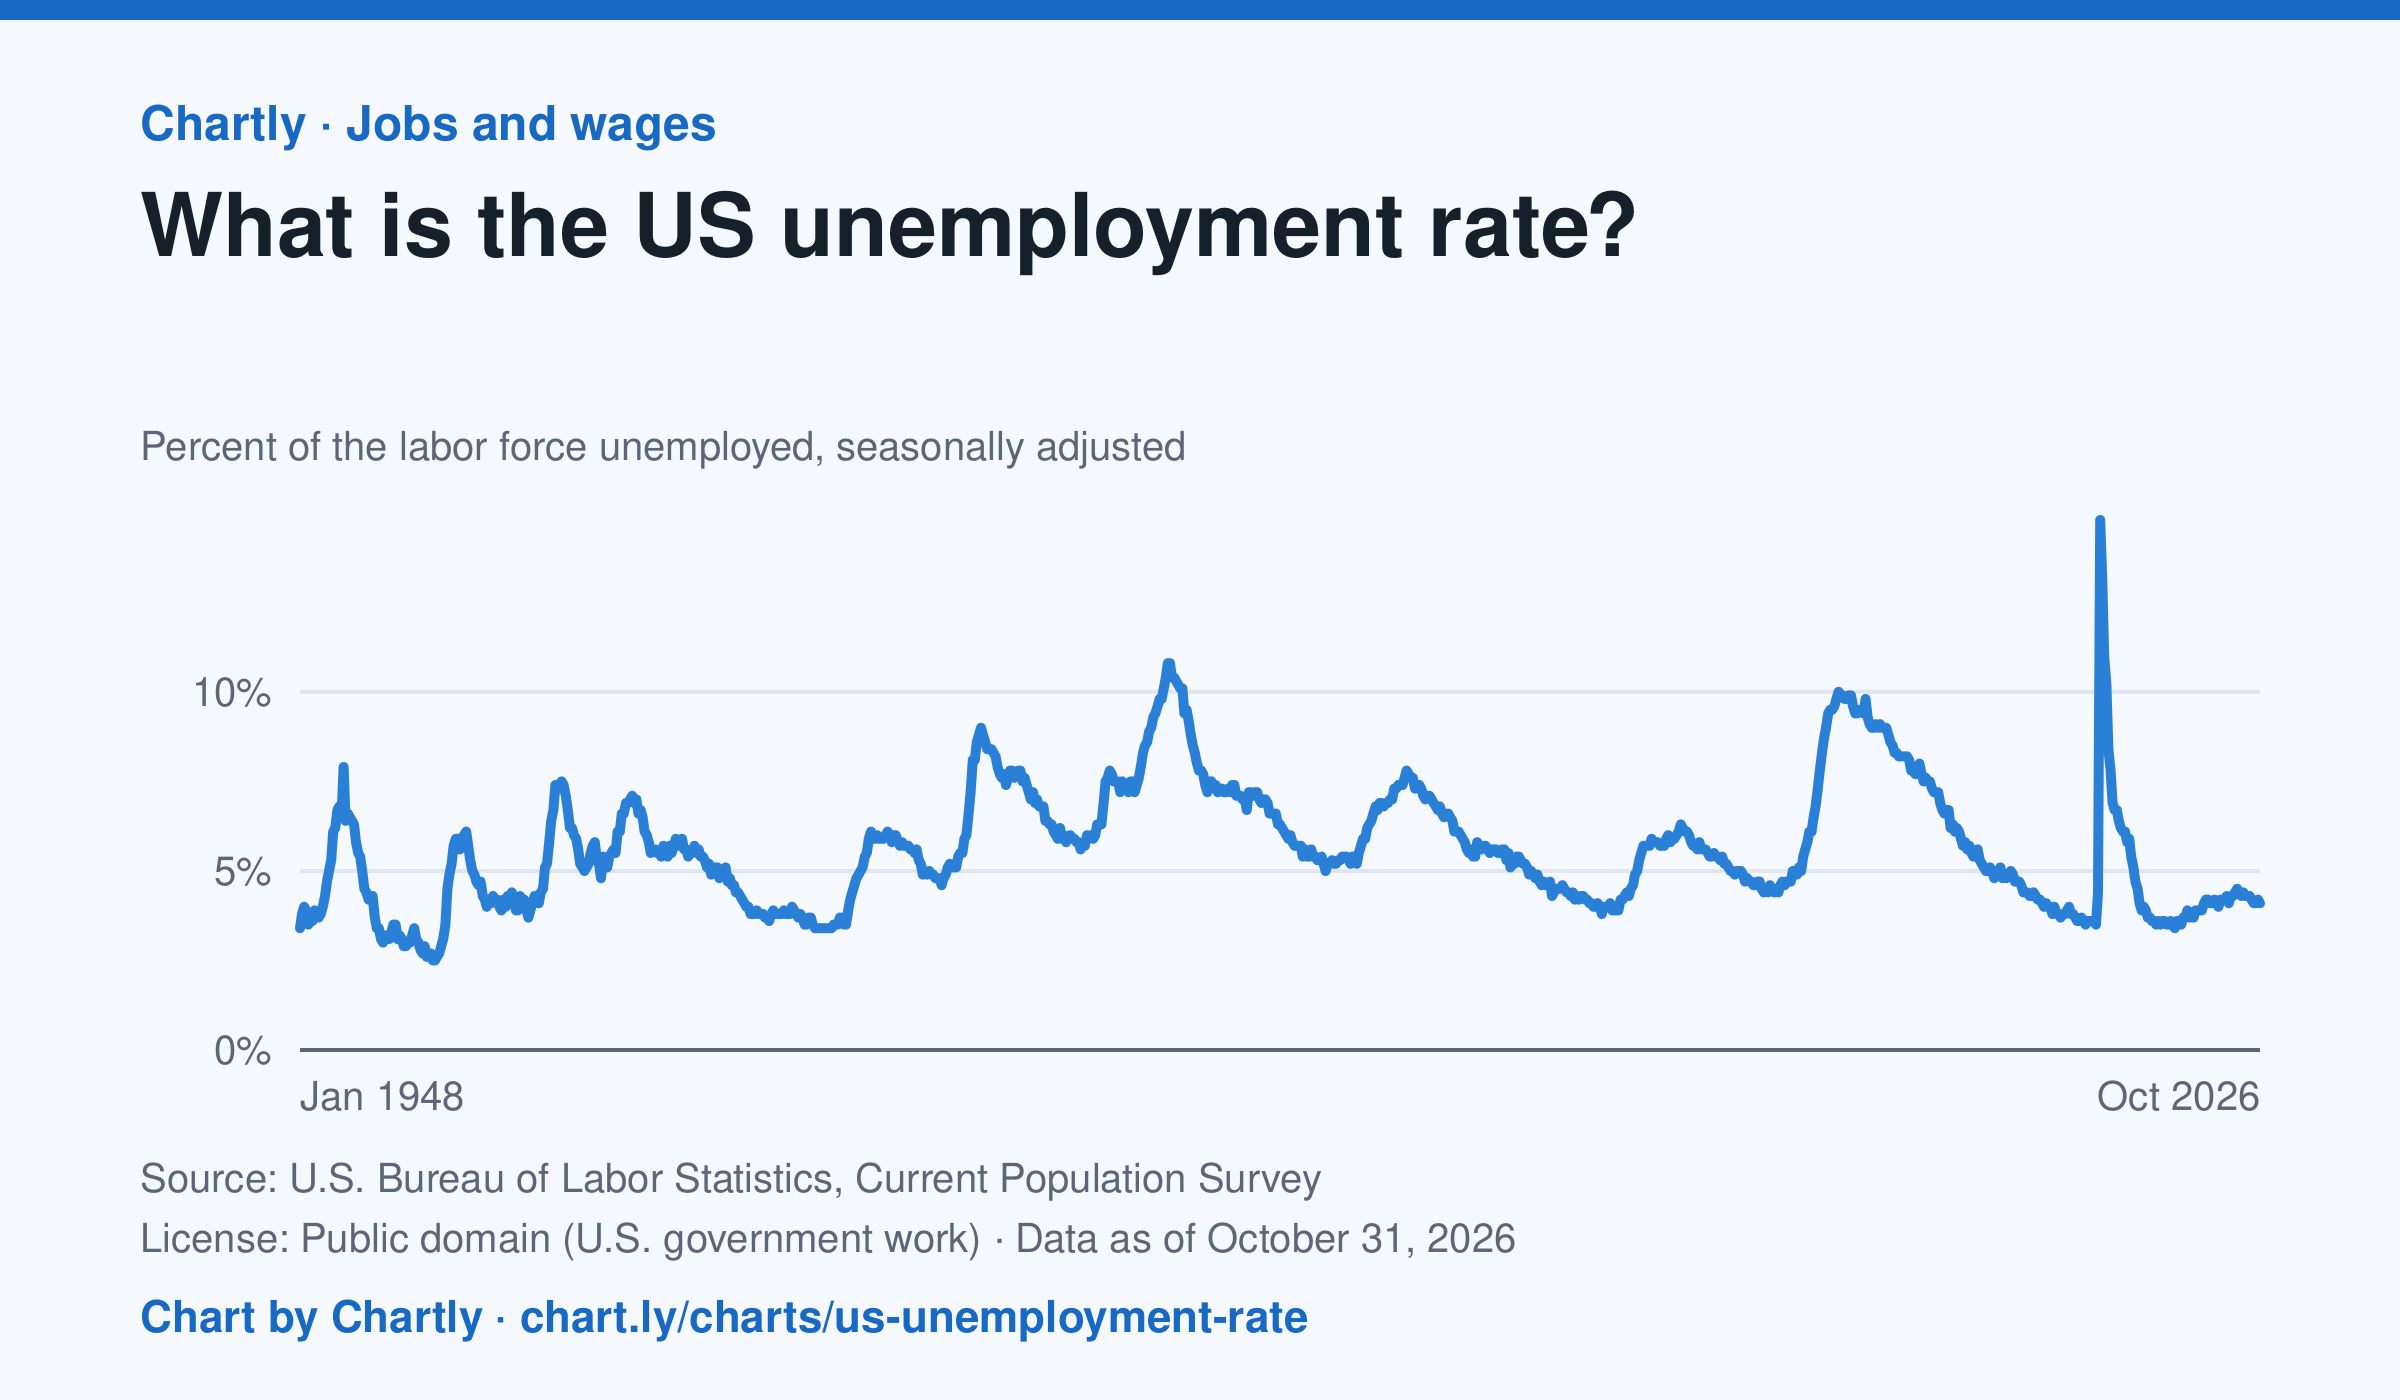
4.1% of the US labor force was unemployed in October 2026, against 4.4% in September 2025. Since the monthly rate began in 1948 it peaked at 14.8% in April 2020, at the start of the pandemic, and was lowest at 2.5% in May 1953. October 2025 is missing because a lapse in federal funding stopped the survey.
Source: U.S. Bureau of Labor Statistics, Current Population Survey (Public domain (U.S. government work)) · Data as of Oct 31, 2026
How to read this chart
Each point is the share of the labor force without a job in one month: people who have no work, are available and looked for a job in the past four weeks. People who aren't looking, such as retirees and most students, aren't in the labor force, so they don't count as unemployed. The numbers are seasonally adjusted, so the usual jump when school ends doesn't show up as bad news.
Questions
- Find the three highest peaks on the chart. What was happening in the economy at each one?
- How long did it take the rate to come back down after each peak? Was the recovery faster or slower than the rise?
- Someone who gives up looking for work stops counting as unemployed. How could that make the rate look better than things really are?
Chart and numbers: chart.ly/charts/us-unemployment-rate · More free charts at chart.ly
Chart 3 of 3 · World
What share of people use the internet in each country?
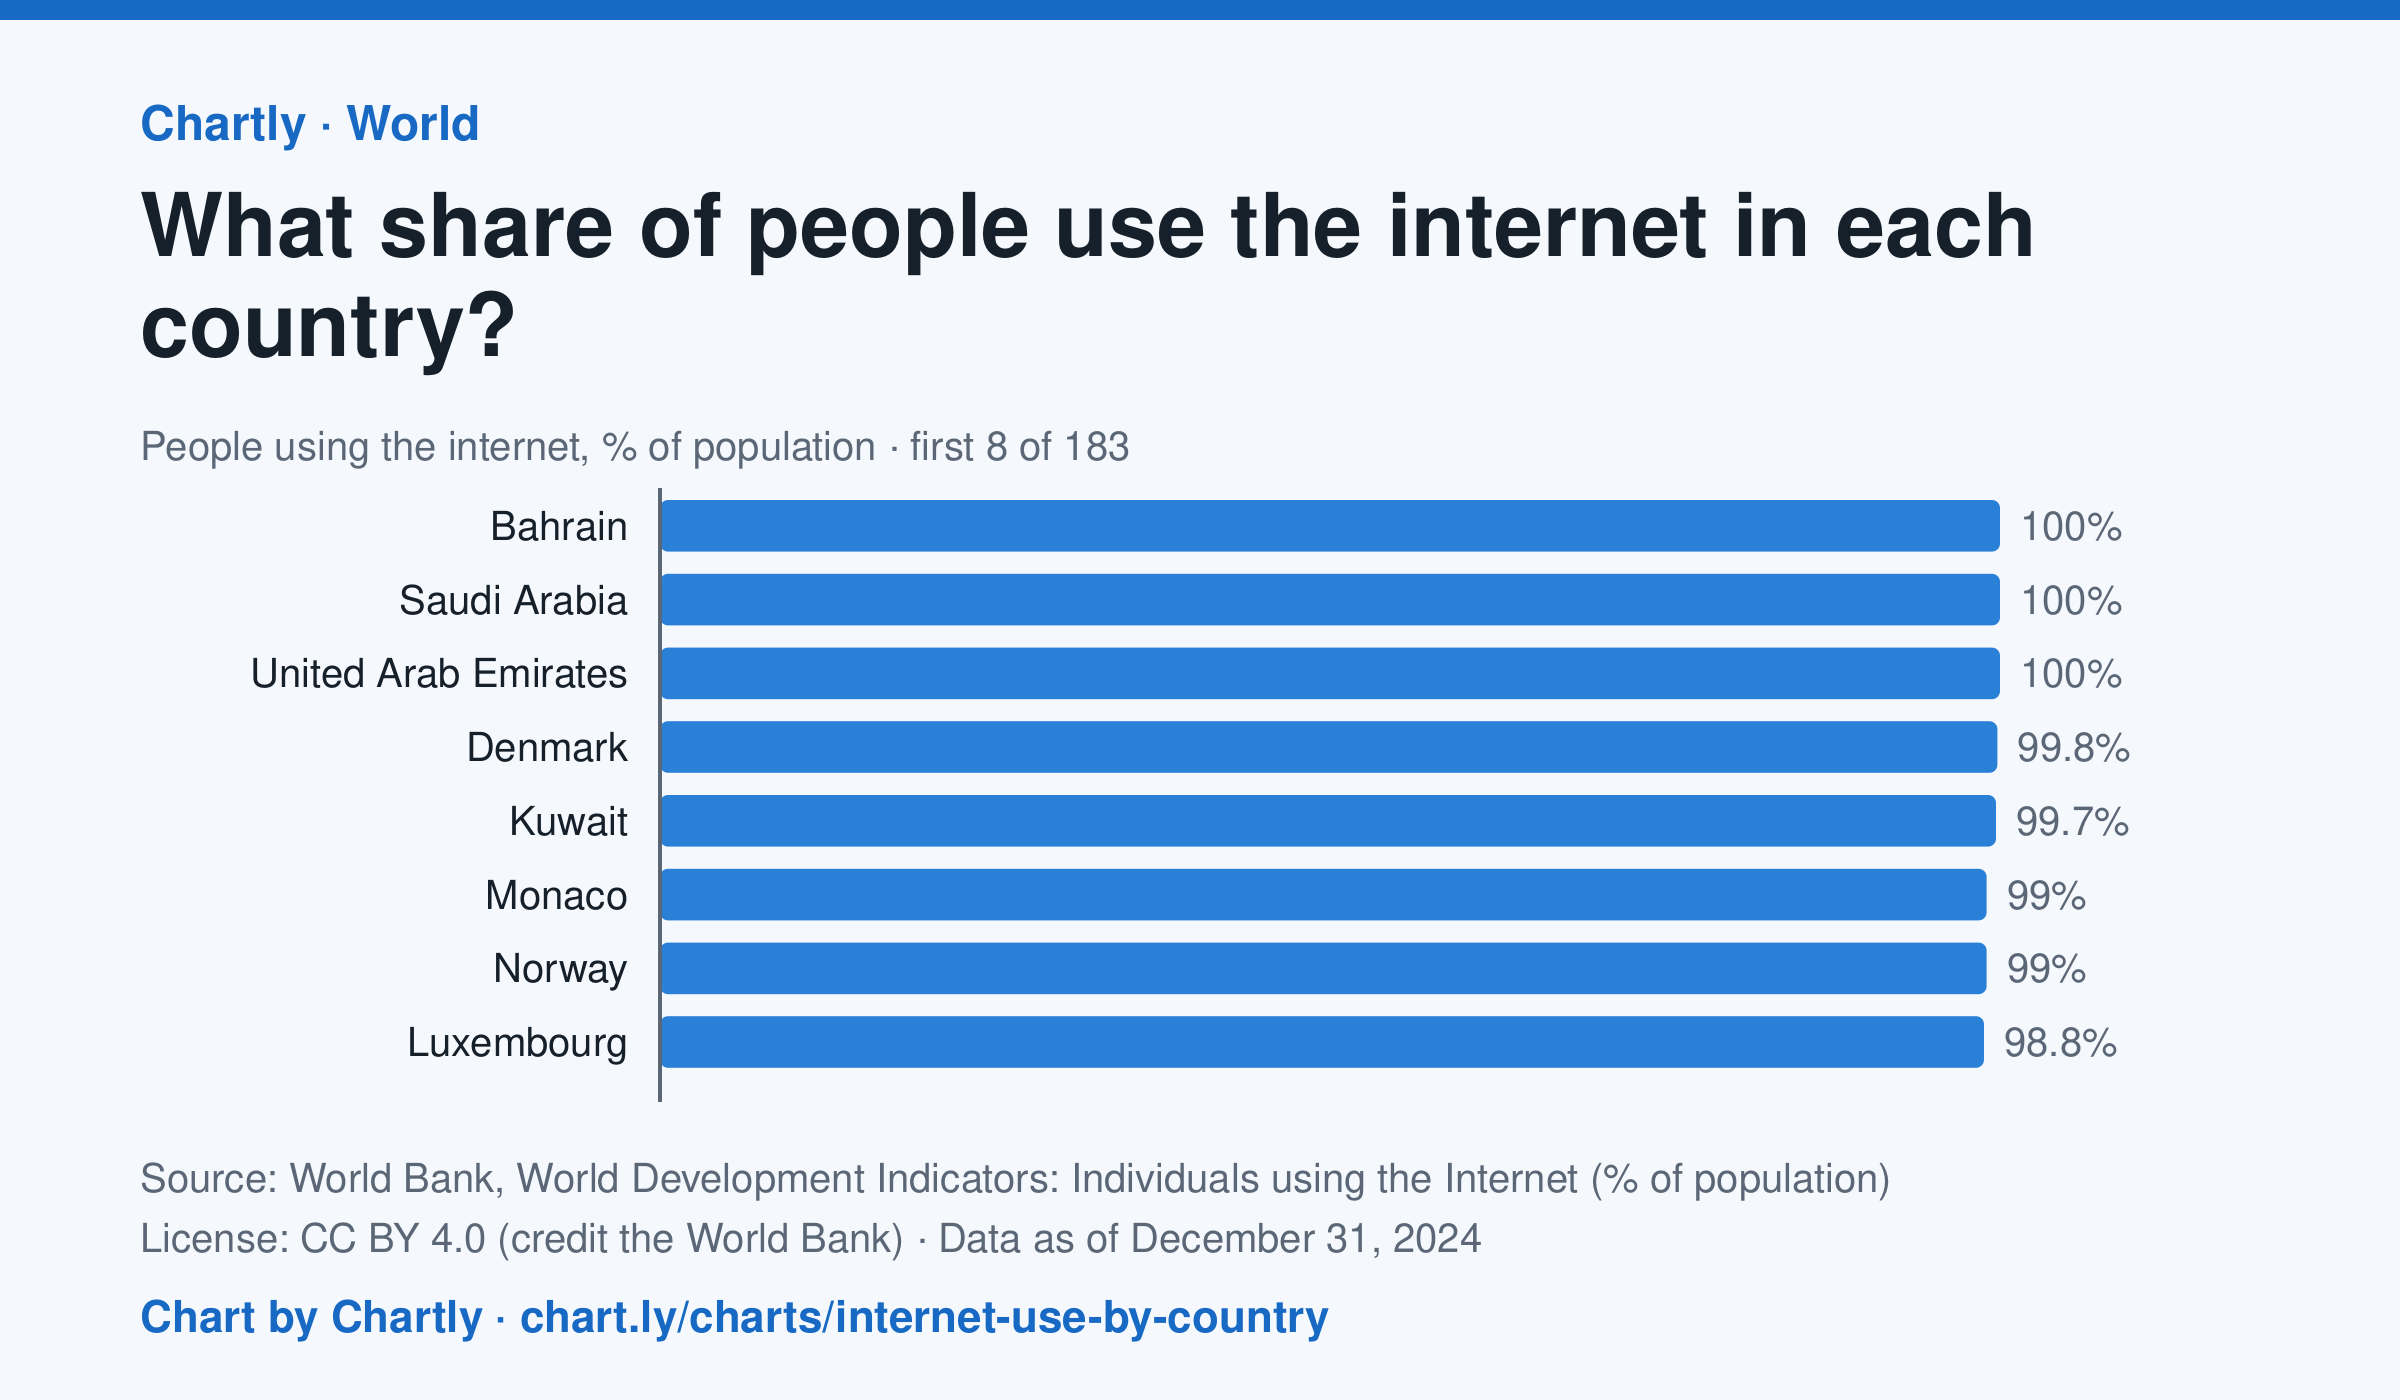
In 2024, 94.7% of people in the United States used the internet and 64.9% in India. The highest share was 100%, and the lowest 8.6%, in Burundi. 182 countries and territories had a 2024 figure. It counts people who used the internet at least once in the previous three months; places without a 2024 figure are left out.
Source: World Bank, World Development Indicators: Individuals using the Internet (% of population) (CC BY 4.0 (credit the World Bank)) · Data as of Dec 31, 2024
How to read this chart
Each bar is the share of a country's people who used the internet in the previous three months. The dashed line is the whole world. The chart opens on the top and bottom of the ranking; search for a country to find its bar among the rest.
Questions
- Find the United States and one country on another continent. How far apart are their shares?
- What do the countries at the bottom of the ranking have in common? What might keep people there offline?
- The world figure is closer to the bottom than many rich countries are to the top. Why might that be?
Chart and numbers: chart.ly/charts/internet-use-by-country · More free charts at chart.ly