Print this worksheet, or choose "Save as PDF" in the print window to share a file.
Chart worksheet
Charts to read and discuss
Name:
Class:
Date:
Chart 1 of 3 · Climate
How much has the US warmed since 1895?
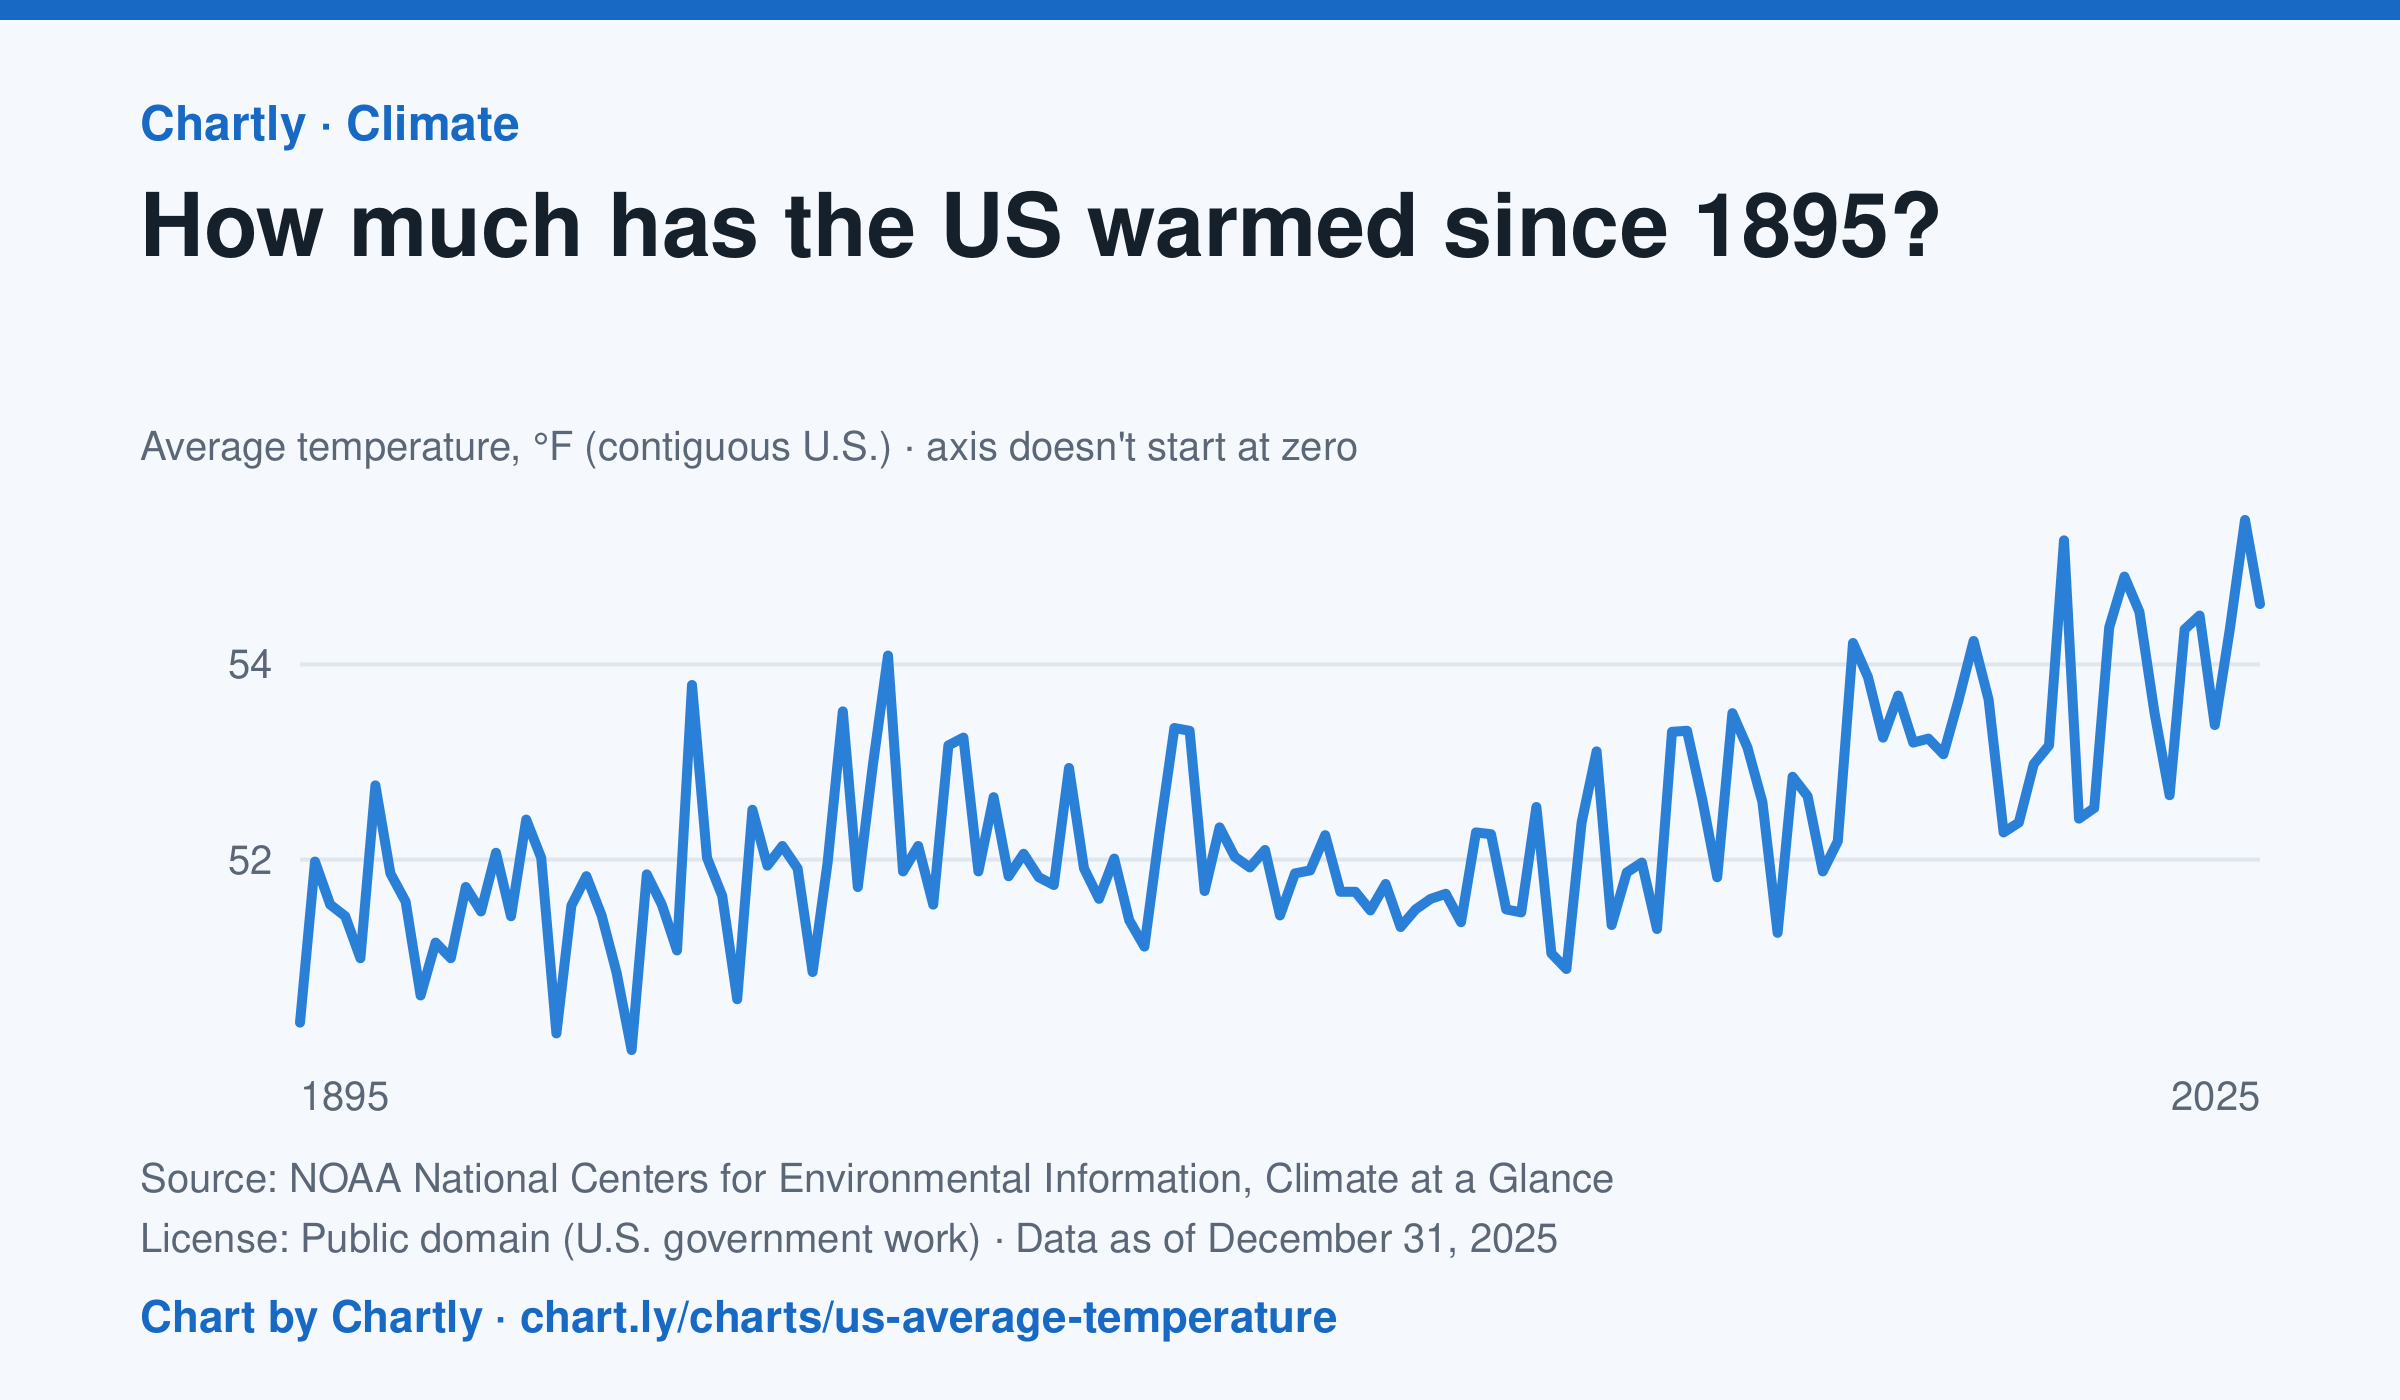
The contiguous US averaged 54.6°F in 2025. The warmest year since records began in 1895 was 2024, at 55.5°F. Through 2025, the dashed trend line, the straight line that best fits every year, rose about 0.18°F a decade, or 2.3°F since 1895, and warming had sped up to about 0.5°F a decade since 1970. Alaska and Hawaii aren't included.
Source: NOAA National Centers for Environmental Information, Climate at a Glance (Public domain (U.S. government work)) · Data as of Dec 31, 2025
How to read this chart
Each point is one year's average temperature across the lower 48 states, in degrees Fahrenheit. The axis doesn't start at zero, so a small rise looks steep: read the numbers on the axis, not the height of the line. The dashed line is the trend, the straight line that best fits every year; single years bounce above and below it.
Questions
- Find the warmest and coolest years on the chart. How many degrees apart are they?
- Why might one year be much cooler than the year before, even while the trend line keeps rising?
- The axis doesn't start at zero here, but bar charts always do. Why is that fair for temperatures but not for bars?
Chart and numbers: chart.ly/charts/us-average-temperature · More free charts at chart.ly
Chart 2 of 3 · Inflation
How much have US consumer prices risen since 1913?
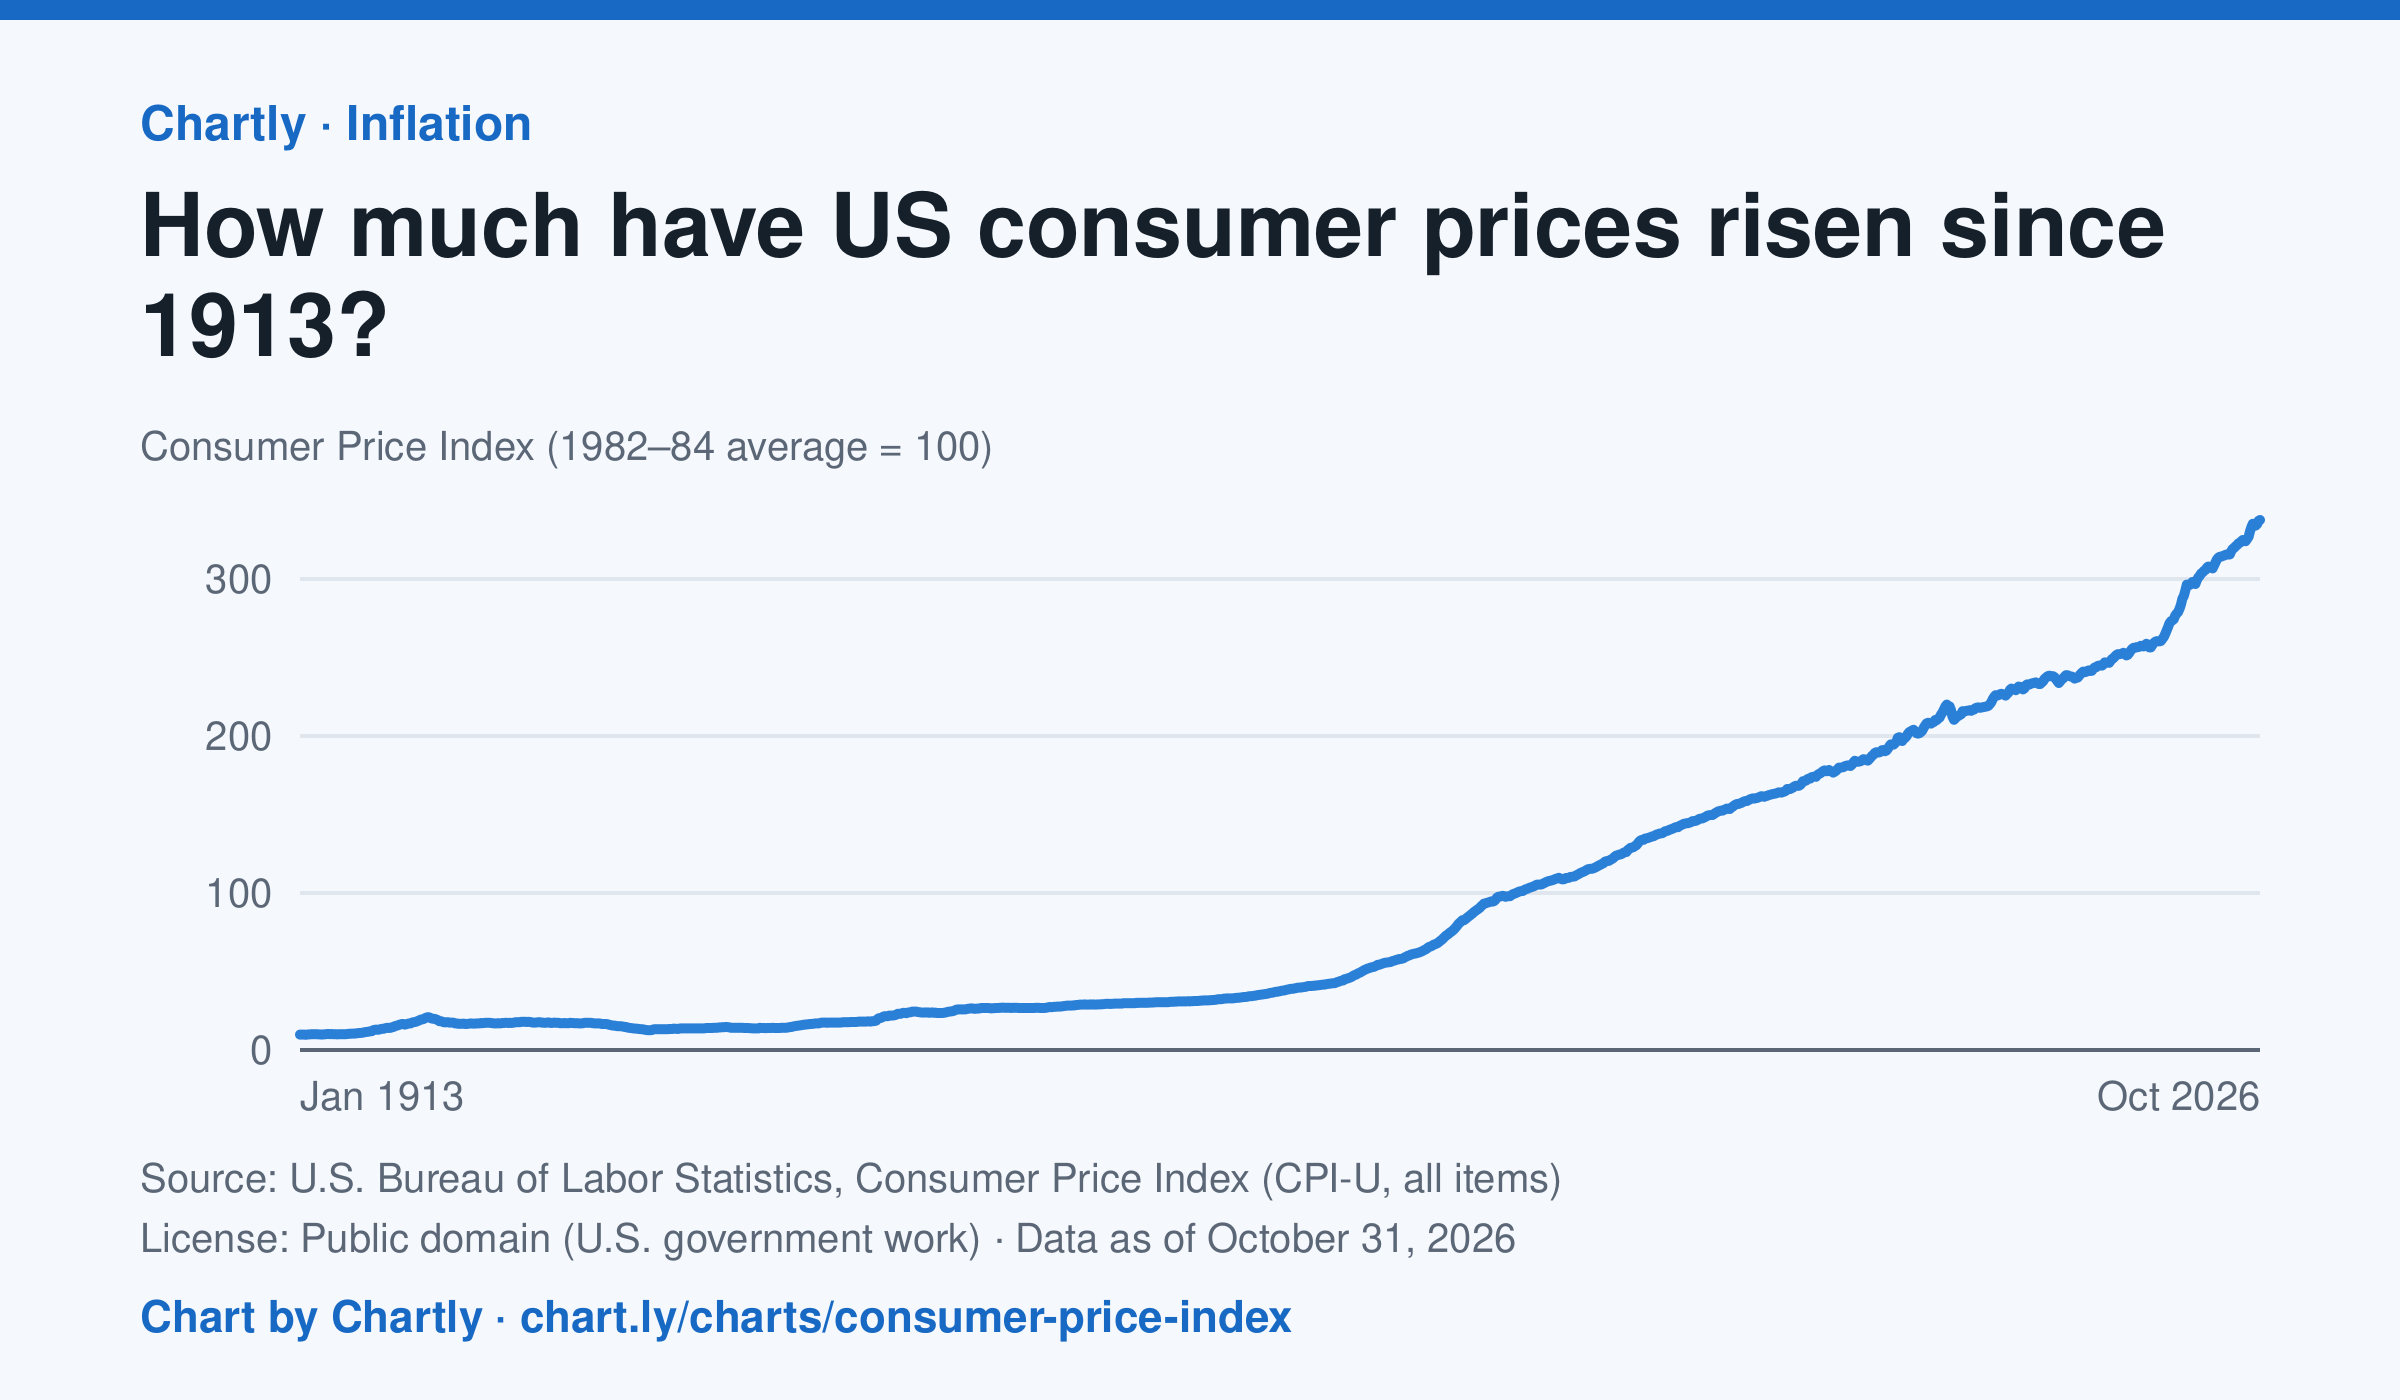
Consumer prices in October 2026 were 34 times their level in January 1913, when the Consumer Price Index begins: what cost $1 then cost about $34 in 2026. They were 2 times their level of January 2000. The index tracks what a typical basket of goods and services costs city households, with 100 as its 1982–84 average. Prices fell after 1920 and again in the early 1930s. October 2025 is missing because BLS collected no prices that month, during a lapse in federal funding.
Source: U.S. Bureau of Labor Statistics, Consumer Price Index (CPI-U, all items) (Public domain (U.S. government work)) · Data as of Oct 31, 2026
How to read this chart
The Consumer Price Index tracks the price of a fixed basket of things people buy, like food, rent, gas and clothing. It is an index, not dollars: prices in 1982 to 1984 are set to 100, so a value of 300 means the basket costs three times what it did then. Divide any two points to see how many times prices grew between them.
Questions
- How many times higher is the newest value than the first value on the chart? What does that mean for what $1 bought in 1913?
- Find a stretch where the line goes down. What does a falling index mean for prices, and when did it happen?
- Why does the government use a basket of many things instead of the price of just one item, like bread?
Chart and numbers: chart.ly/charts/consumer-price-index · More free charts at chart.ly
Chart 3 of 3 · Baby names
How many babies were given your name each year since 1880?
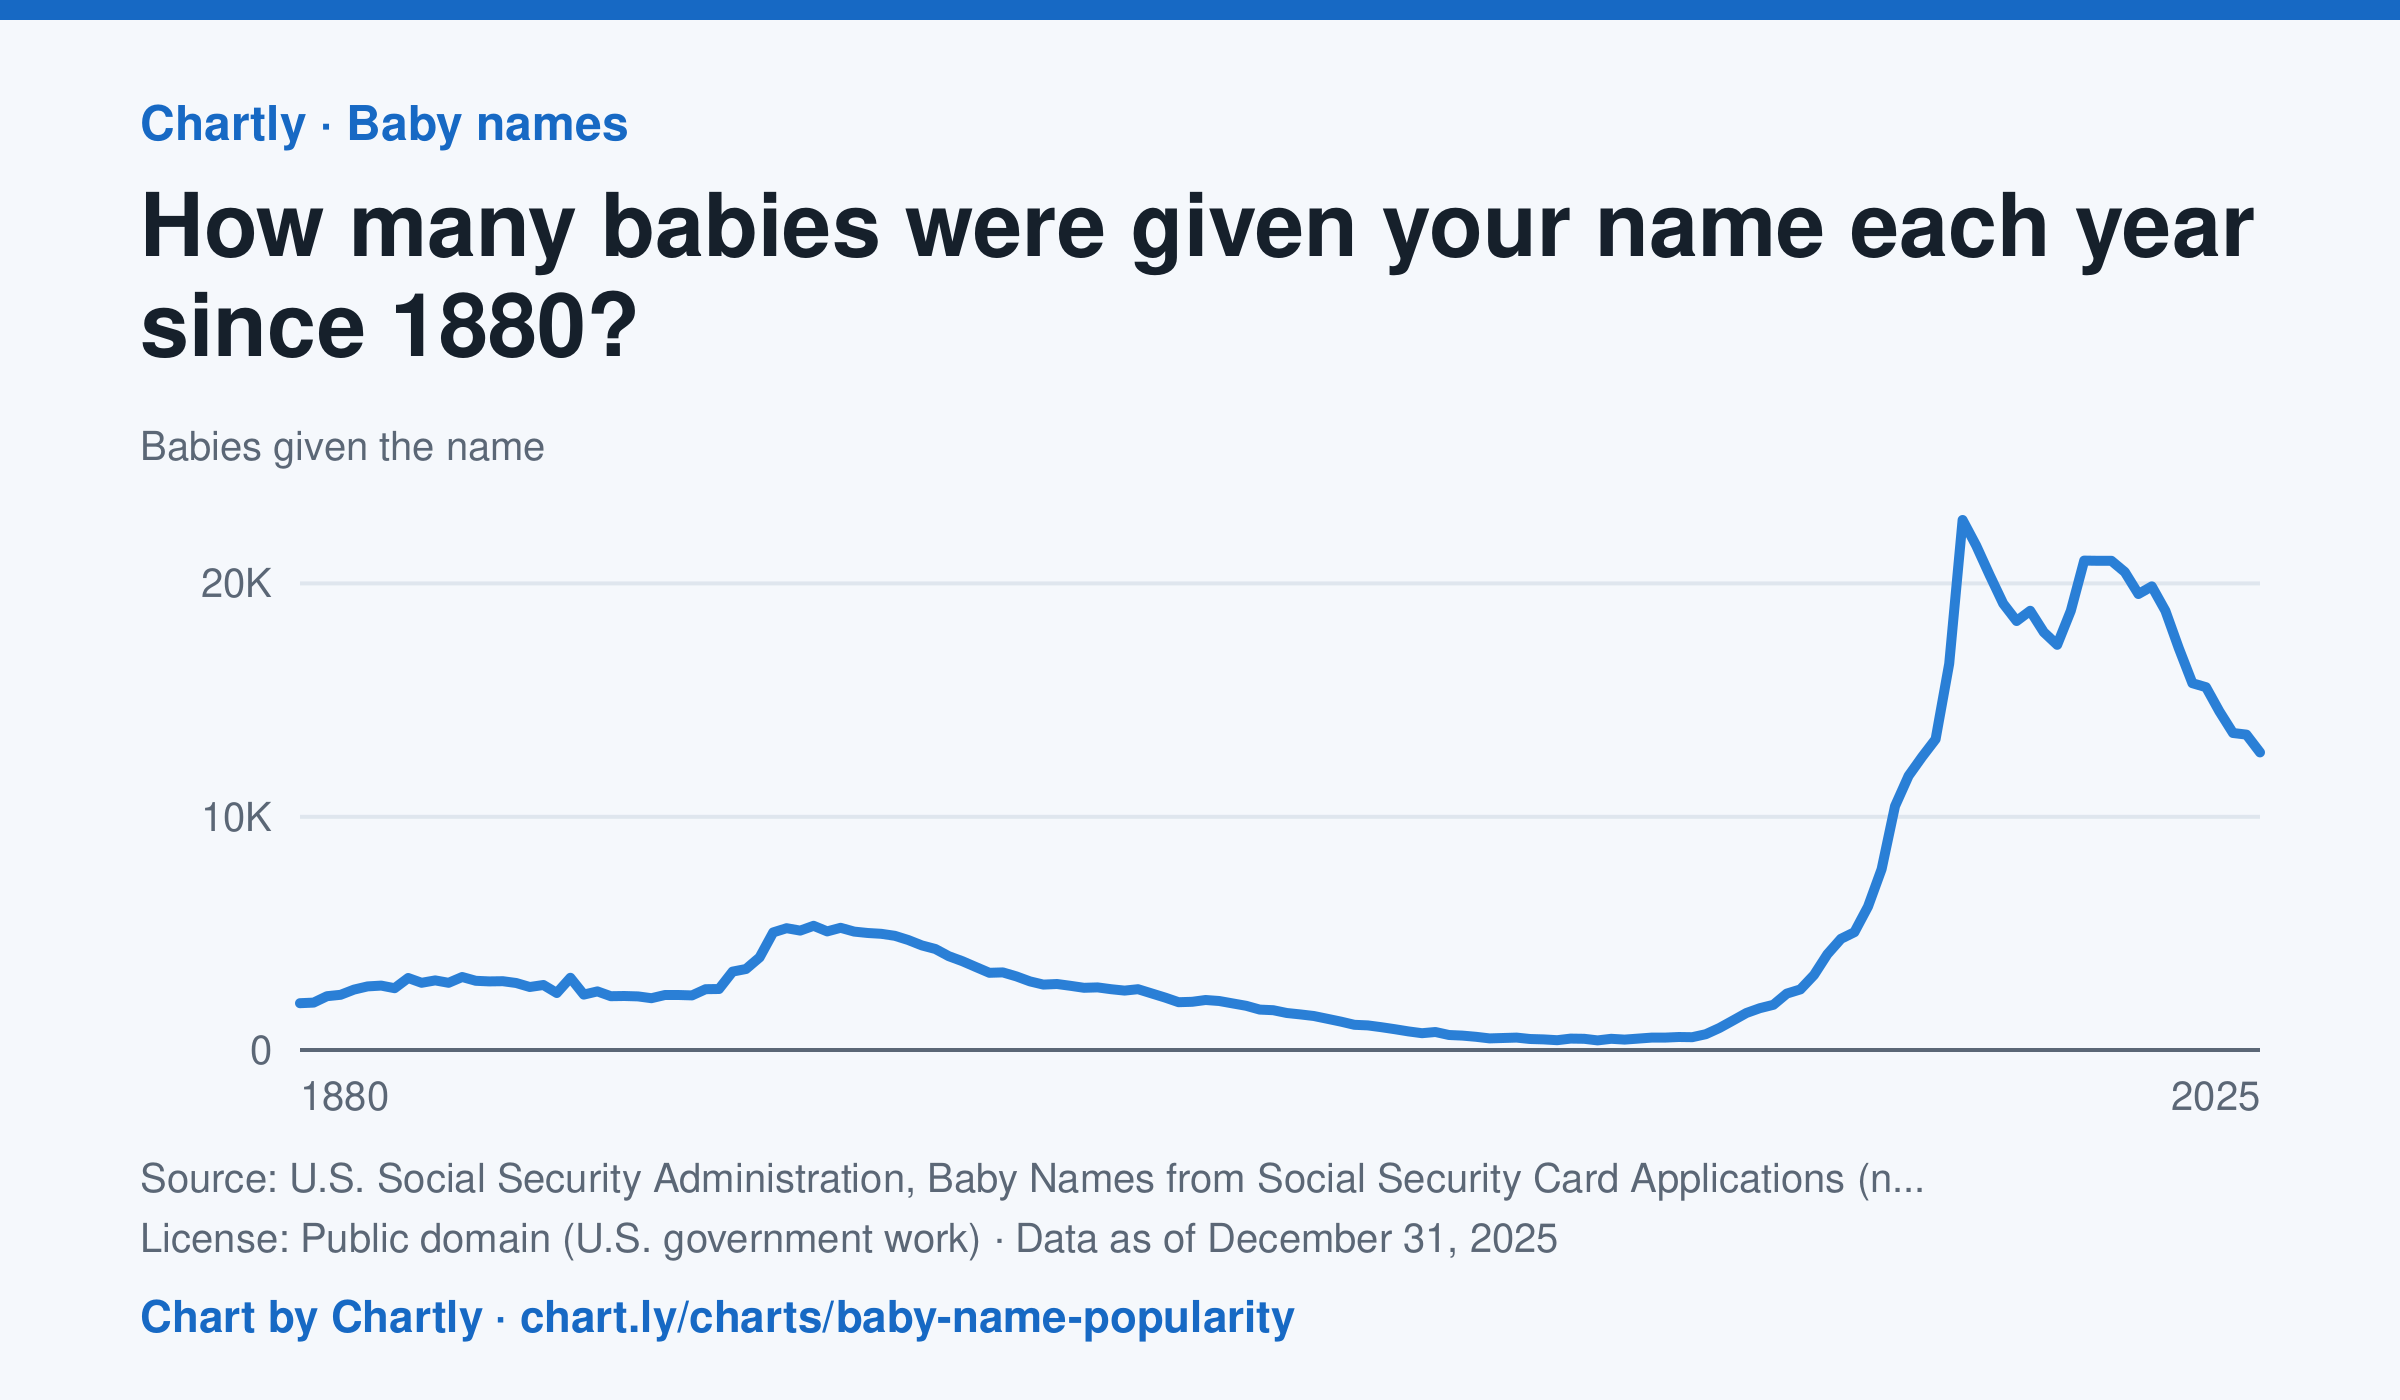
Type any name to see how many U.S. babies were given it each year since 1880, for girls or boys. Emma, shown first, went from 2,003 girls in 1880 down to 414 in 1976, then back up to a peak of 22,719 in 2003; in 2025 it was 12,754. The counts come from Social Security card applications, so the early years undercount everyone. A year with fewer than 5 babies of a name shows as 0, because Social Security leaves those names out for privacy.
Source: U.S. Social Security Administration, Baby Names from Social Security Card Applications (national data) (Public domain (U.S. government work)) · Data as of Dec 31, 2025
How to read this chart
Each point is the number of U.S. babies given a name in one year, from Social Security card applications. Type any name to see its line, for girls or boys. These are counts, not shares, and far more babies are born today than in 1880, so a count can grow just because the country did.
Questions
- Look up your own name or a friend's. When was it most popular, and what might explain that?
- Why are counts from the 1880s lower than counts today, even for names that were very popular then?
- How could you change these counts to fairly compare a name's popularity in 1900 with today?
Chart and numbers: chart.ly/charts/baby-name-popularity · More free charts at chart.ly