Print this worksheet, or choose "Save as PDF" in the print window to share a file.
Chart worksheet
Charts to read and discuss
Name:
Class:
Date:
Chart 1 of 3 · Climate
How much has the US warmed since 1895?
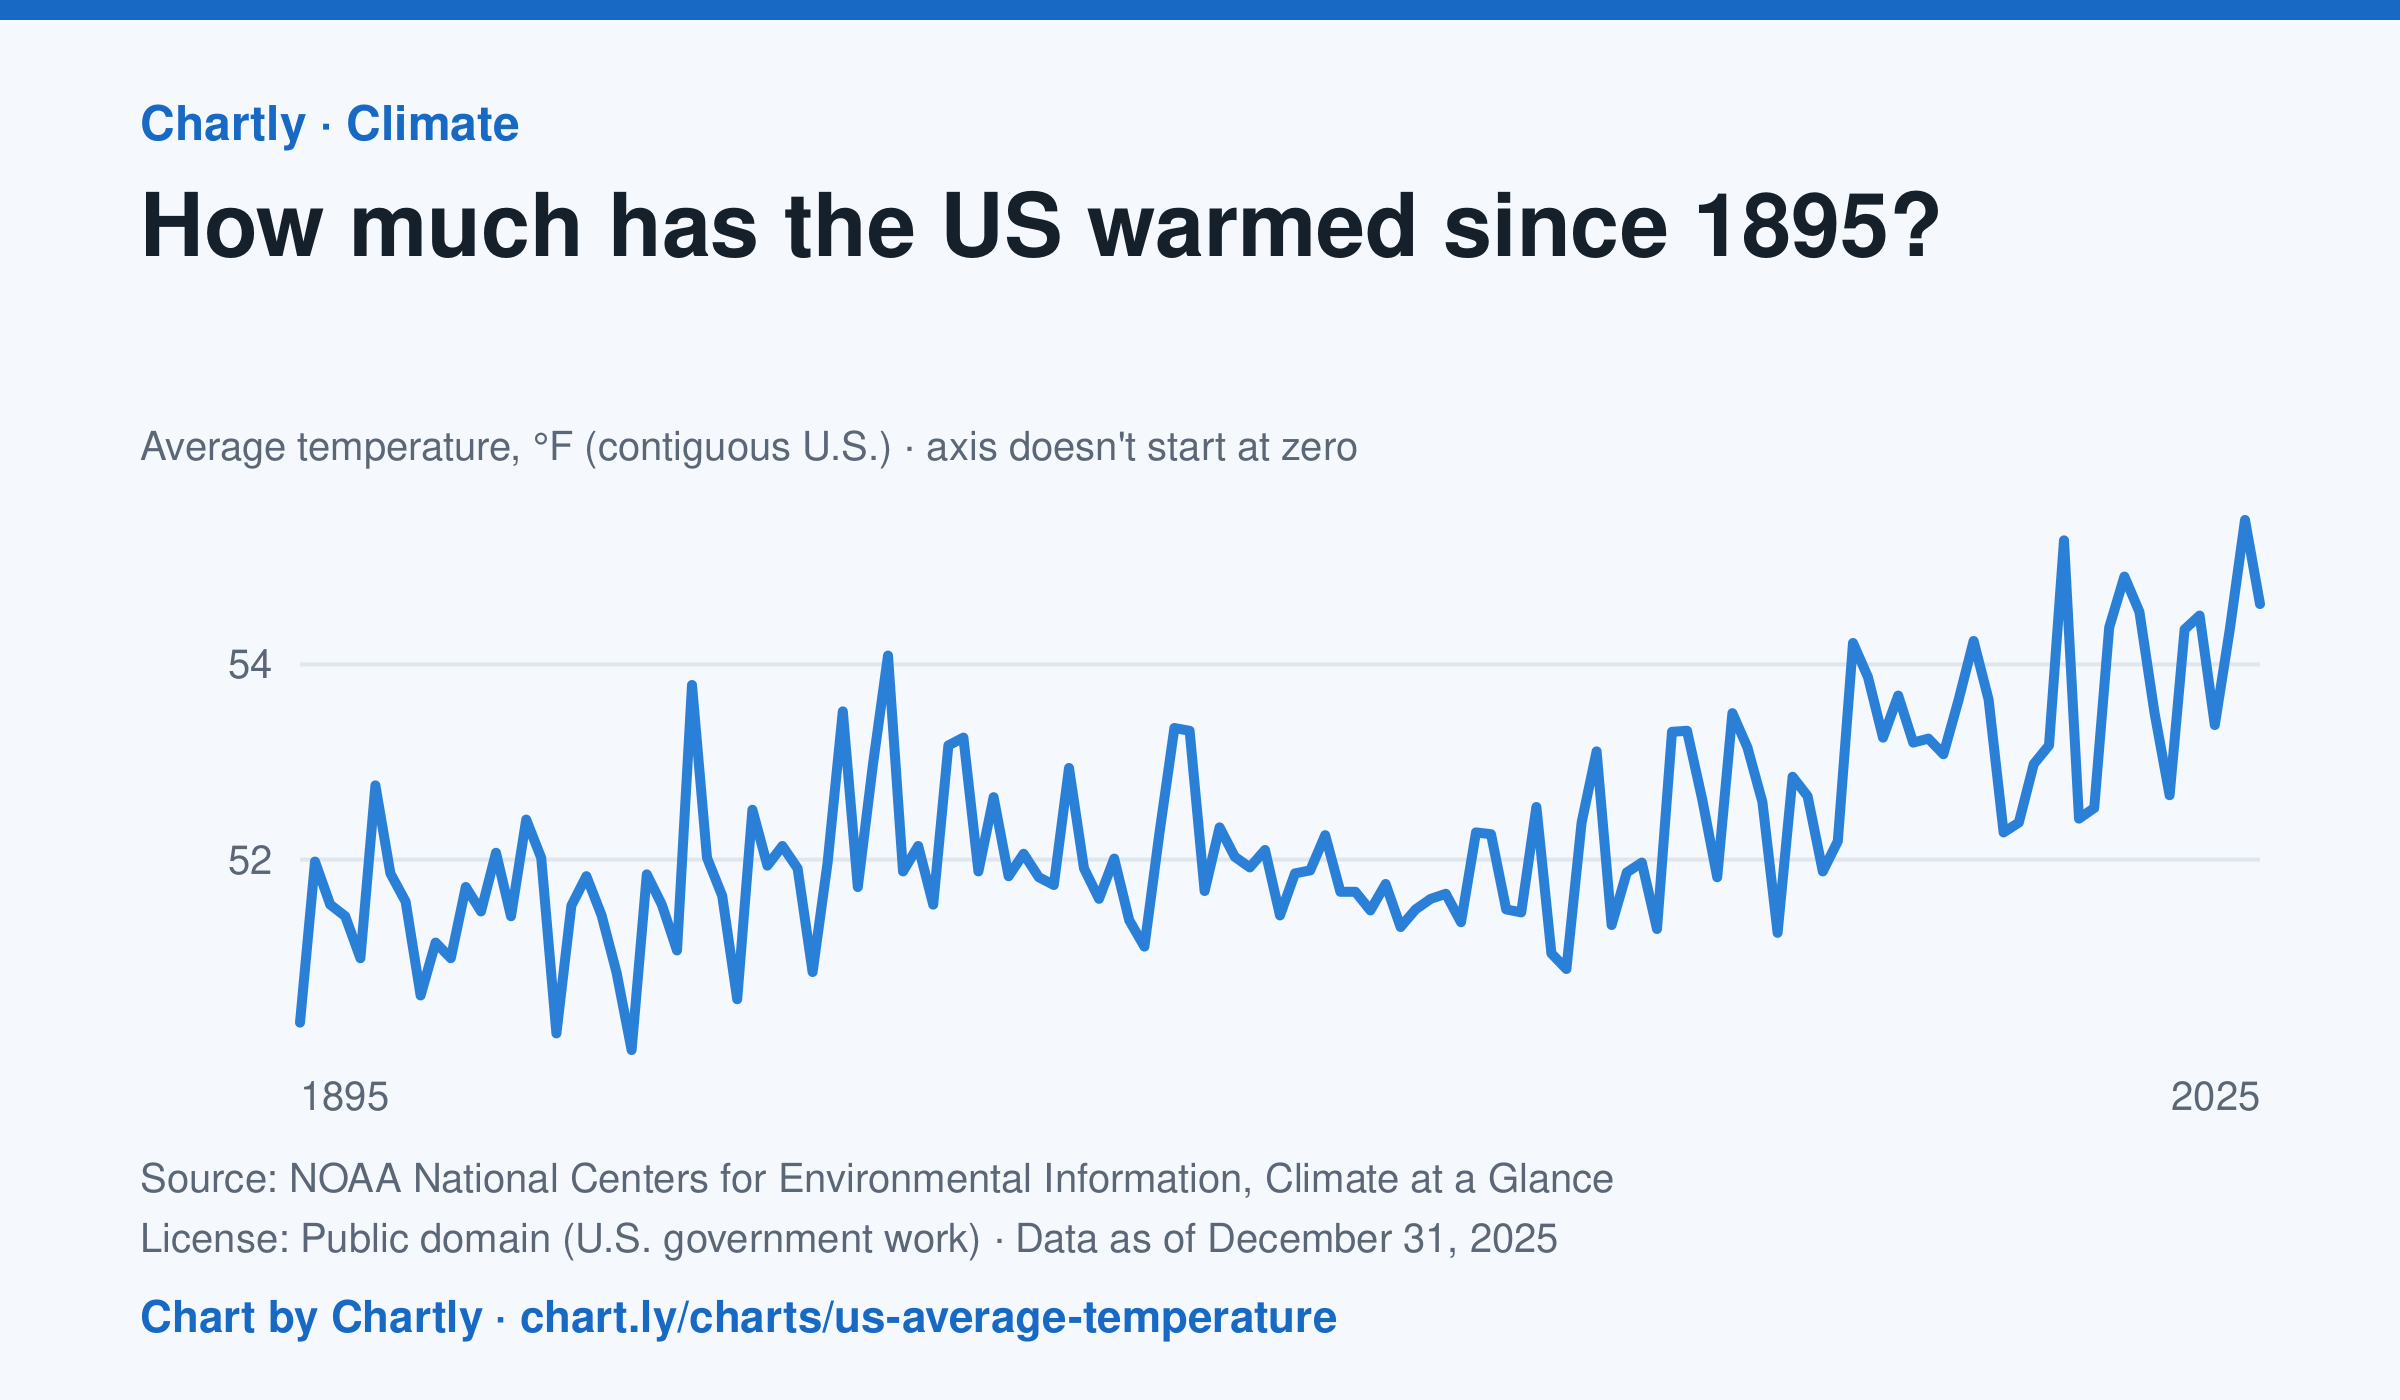
The contiguous US averaged 54.6°F in 2025. The warmest year since records began in 1895 was 2024, at 55.5°F. Through 2025, the dashed trend line, the straight line that best fits every year, rose about 0.18°F a decade, or 2.3°F since 1895, and warming had sped up to about 0.5°F a decade since 1970. Alaska and Hawaii aren't included.
Source: NOAA National Centers for Environmental Information, Climate at a Glance (Public domain (U.S. government work)) · Data as of Dec 31, 2025
How to read this chart
Each point is one year's average temperature across the lower 48 states, in degrees Fahrenheit. The axis doesn't start at zero, so a small rise looks steep: read the numbers on the axis, not the height of the line. The dashed line is the trend, the straight line that best fits every year; single years bounce above and below it.
Questions
- Find the warmest and coolest years on the chart. How many degrees apart are they?
- Why might one year be much cooler than the year before, even while the trend line keeps rising?
- The axis doesn't start at zero here, but bar charts always do. Why is that fair for temperatures but not for bars?
Chart and numbers: chart.ly/charts/us-average-temperature · More free charts at chart.ly
Chart 2 of 3 · Jobs and wages
How much do US workers earn an hour?
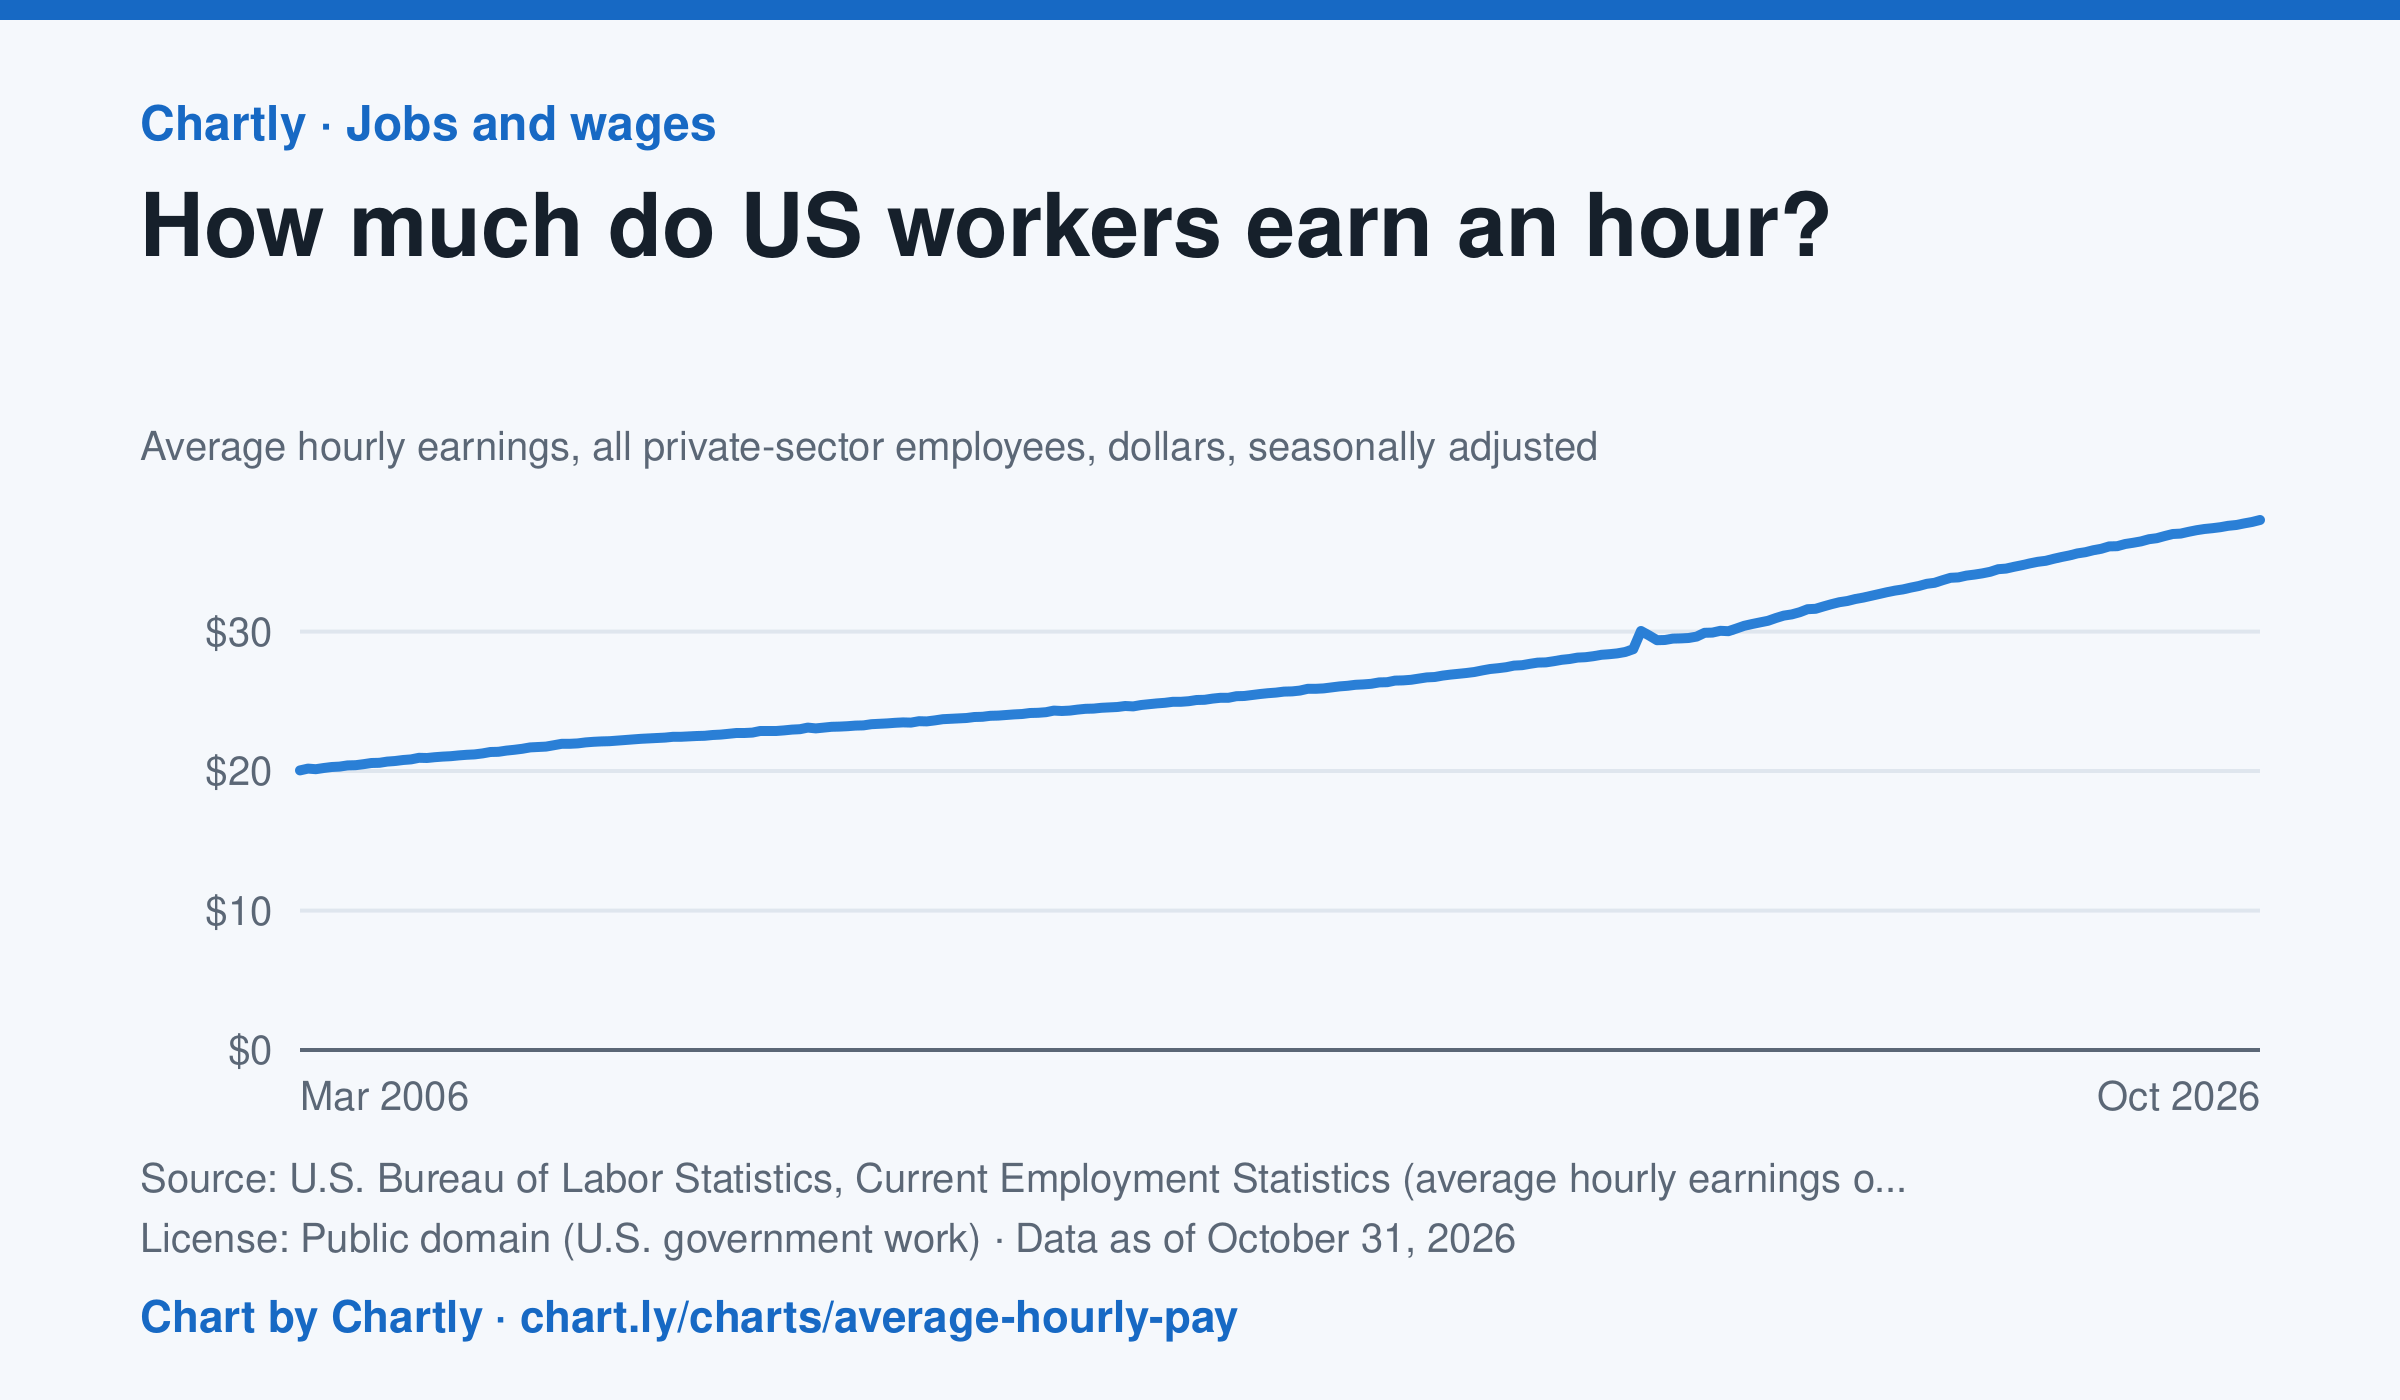
Private-sector employees earned an average of $38.00 an hour in October 2026, 3.1% more than in October 2025 and 1.9 times the $20.04 of March 2006, when the series begins. That is in dollars of the day, not adjusted for inflation; the monthly jobs report compares it with prices. The average rose sharply in spring 2020 because the pandemic put mostly lower-paid people out of work, not because pay jumped.
Source: U.S. Bureau of Labor Statistics, Current Employment Statistics (average hourly earnings of all employees, total private) (Public domain (U.S. government work)) · Data as of Oct 31, 2026
How to read this chart
Each point is the average hourly pay of private-sector employees in one month, in dollars, before taxes. It is not adjusted for inflation, so a rise in pay doesn't always mean workers can buy more. Hover or tap a point to read its month and value.
Questions
- How much did average hourly pay change from the first month on the chart to the newest?
- Find a month when pay jumped more than usual. Can you think of a reason that might happen, other than everyone getting a raise?
- If prices rose faster than pay over a year, were workers better or worse off? How could you check that with another chart?
Chart and numbers: chart.ly/charts/average-hourly-pay · More free charts at chart.ly
Chart 3 of 3 · World
What is the unemployment rate in each country?
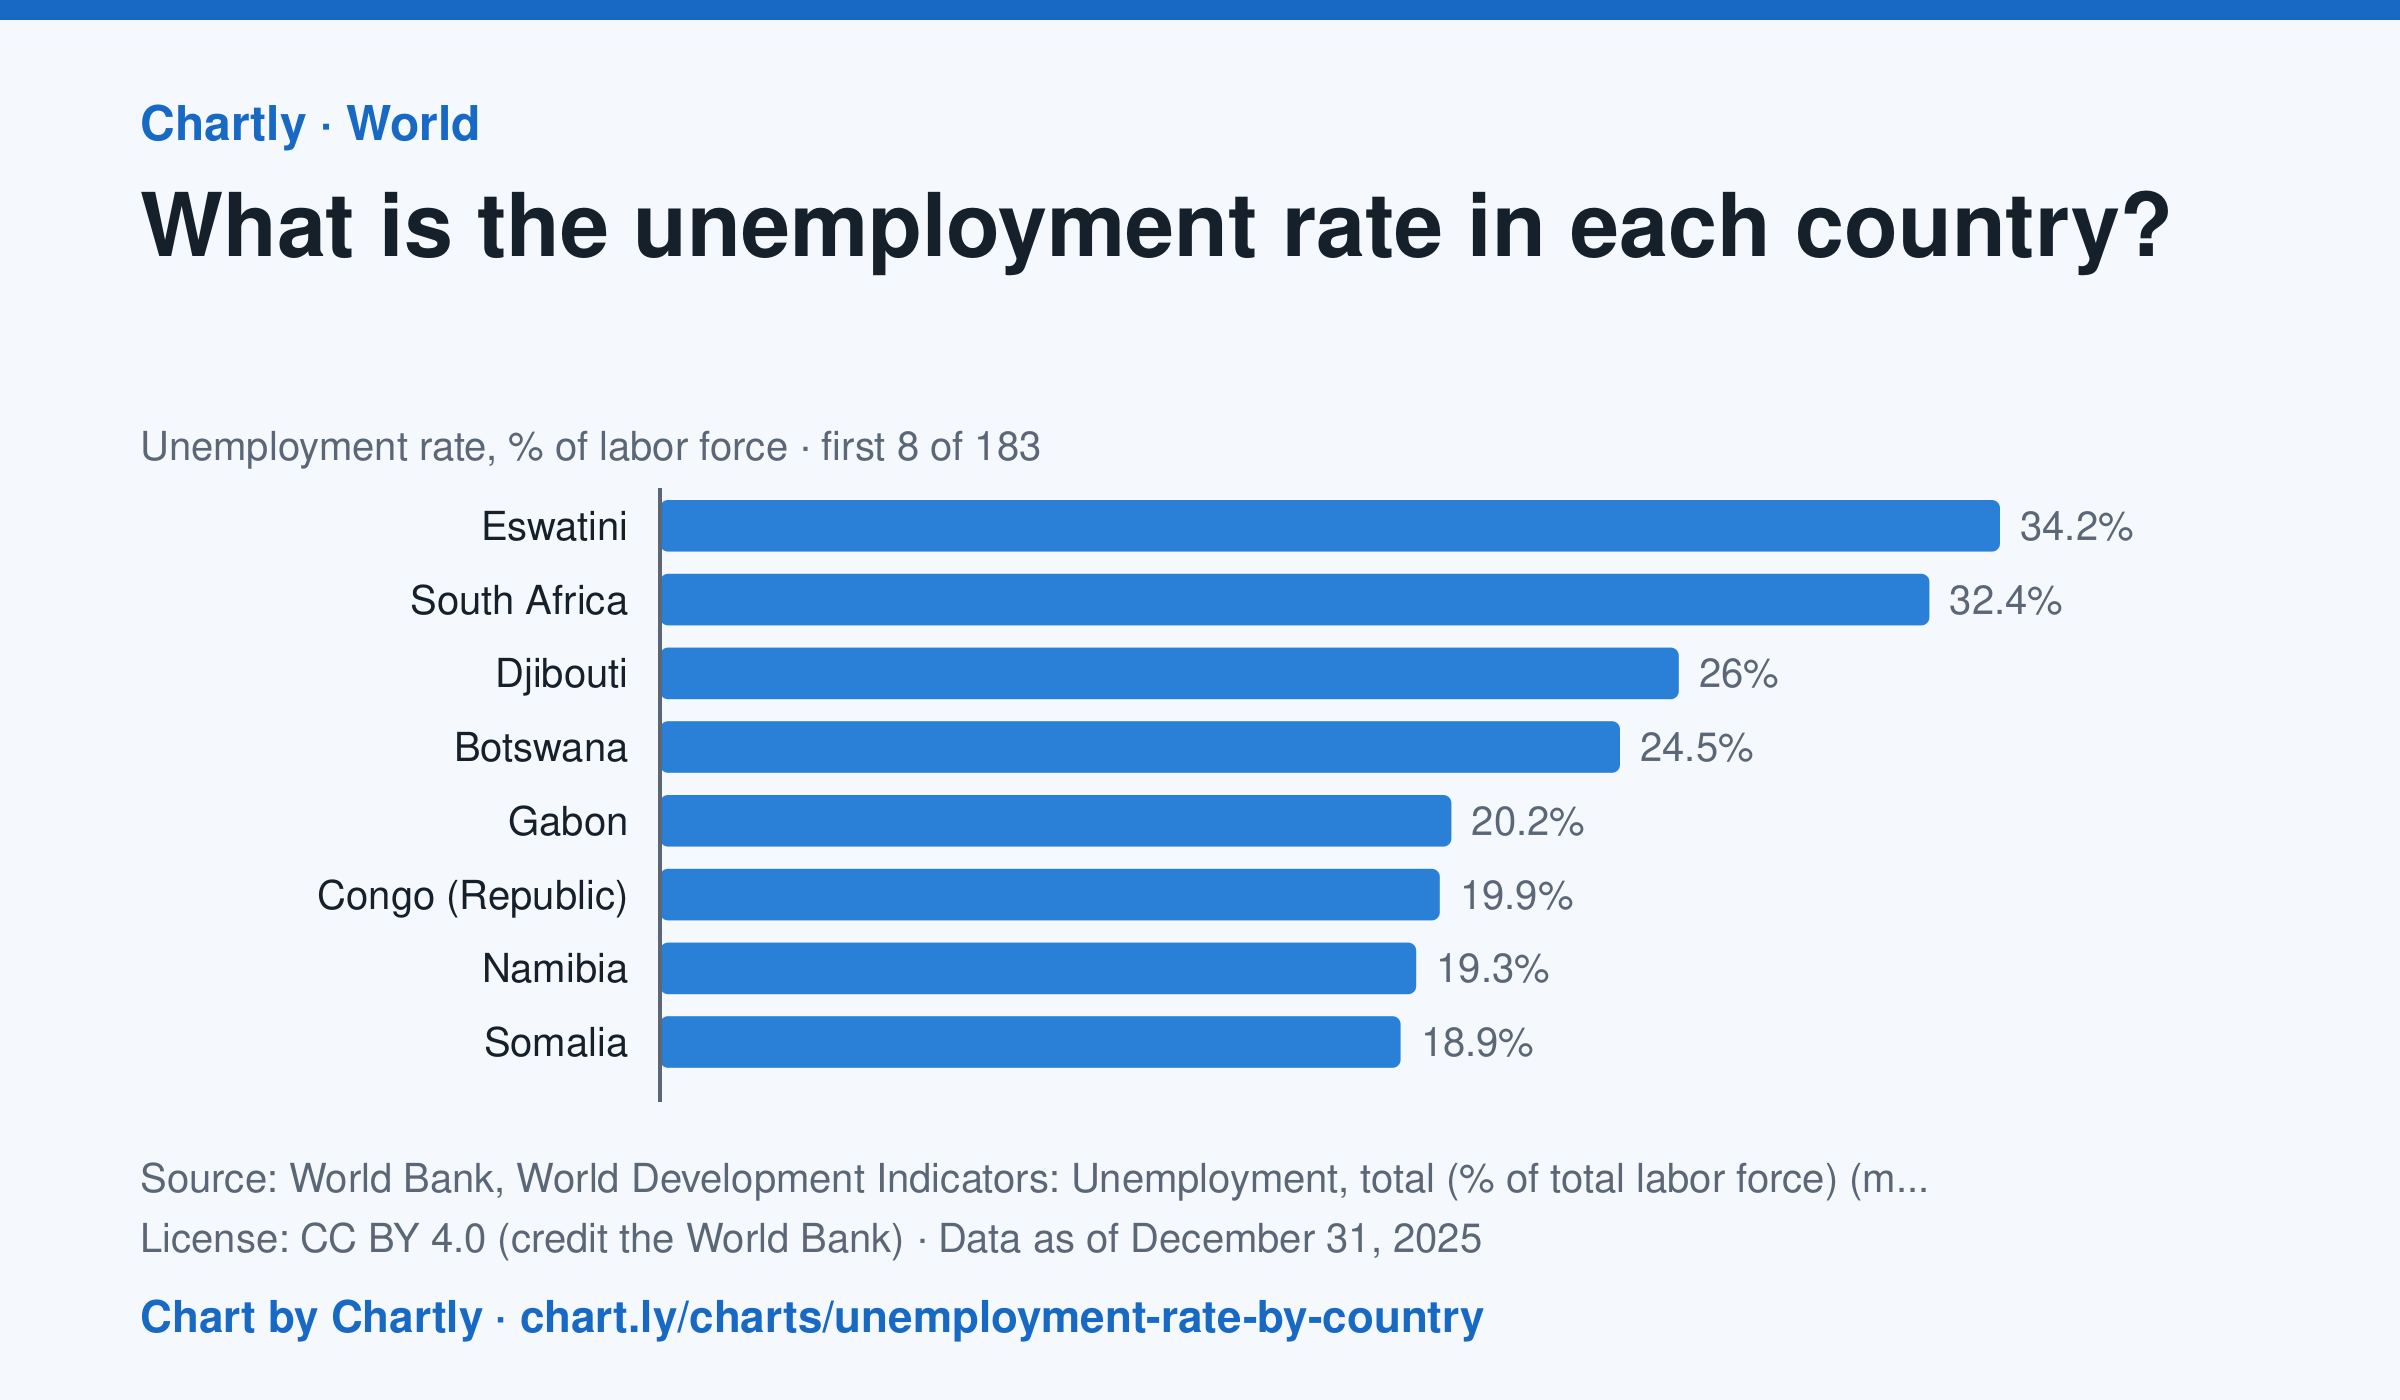
In 2025, 4.2% of workers in the United States were unemployed, against 4.8% worldwide; the highest rate was 34.2% in Eswatini, and the lowest 0.1%, in Qatar. Search 182 countries and territories. These are the International Labour Organization's estimates, which count people without work who are looking for it and fill gaps where a country runs no regular survey, so they can differ from a country's own figures.
Source: World Bank, World Development Indicators: Unemployment, total (% of total labor force) (modeled ILO estimate) (CC BY 4.0 (credit the World Bank)) · Data as of Dec 31, 2025
How to read this chart
Each bar is the share of a country's workers who have no job and are looking for one, estimated by the International Labour Organization. The dashed line is the world. People who aren't looking for work, such as students and retirees, aren't counted as unemployed at all.
Questions
- Is the United States above or below the world rate, and by about how many percentage points?
- A country can have low unemployment while many people earn very little. How is that possible?
- Why would someone who has given up looking for work not count as unemployed? Does that make the number more or less useful?
Chart and numbers: chart.ly/charts/unemployment-rate-by-country · More free charts at chart.ly