Print this worksheet, or choose "Save as PDF" in the print window to share a file.
Chart worksheet
AP Statistics chart assignment
Name:
Class:
Date:
Chart 1 of 1 · Road safety
Are U.S. roads getting safer per mile driven?
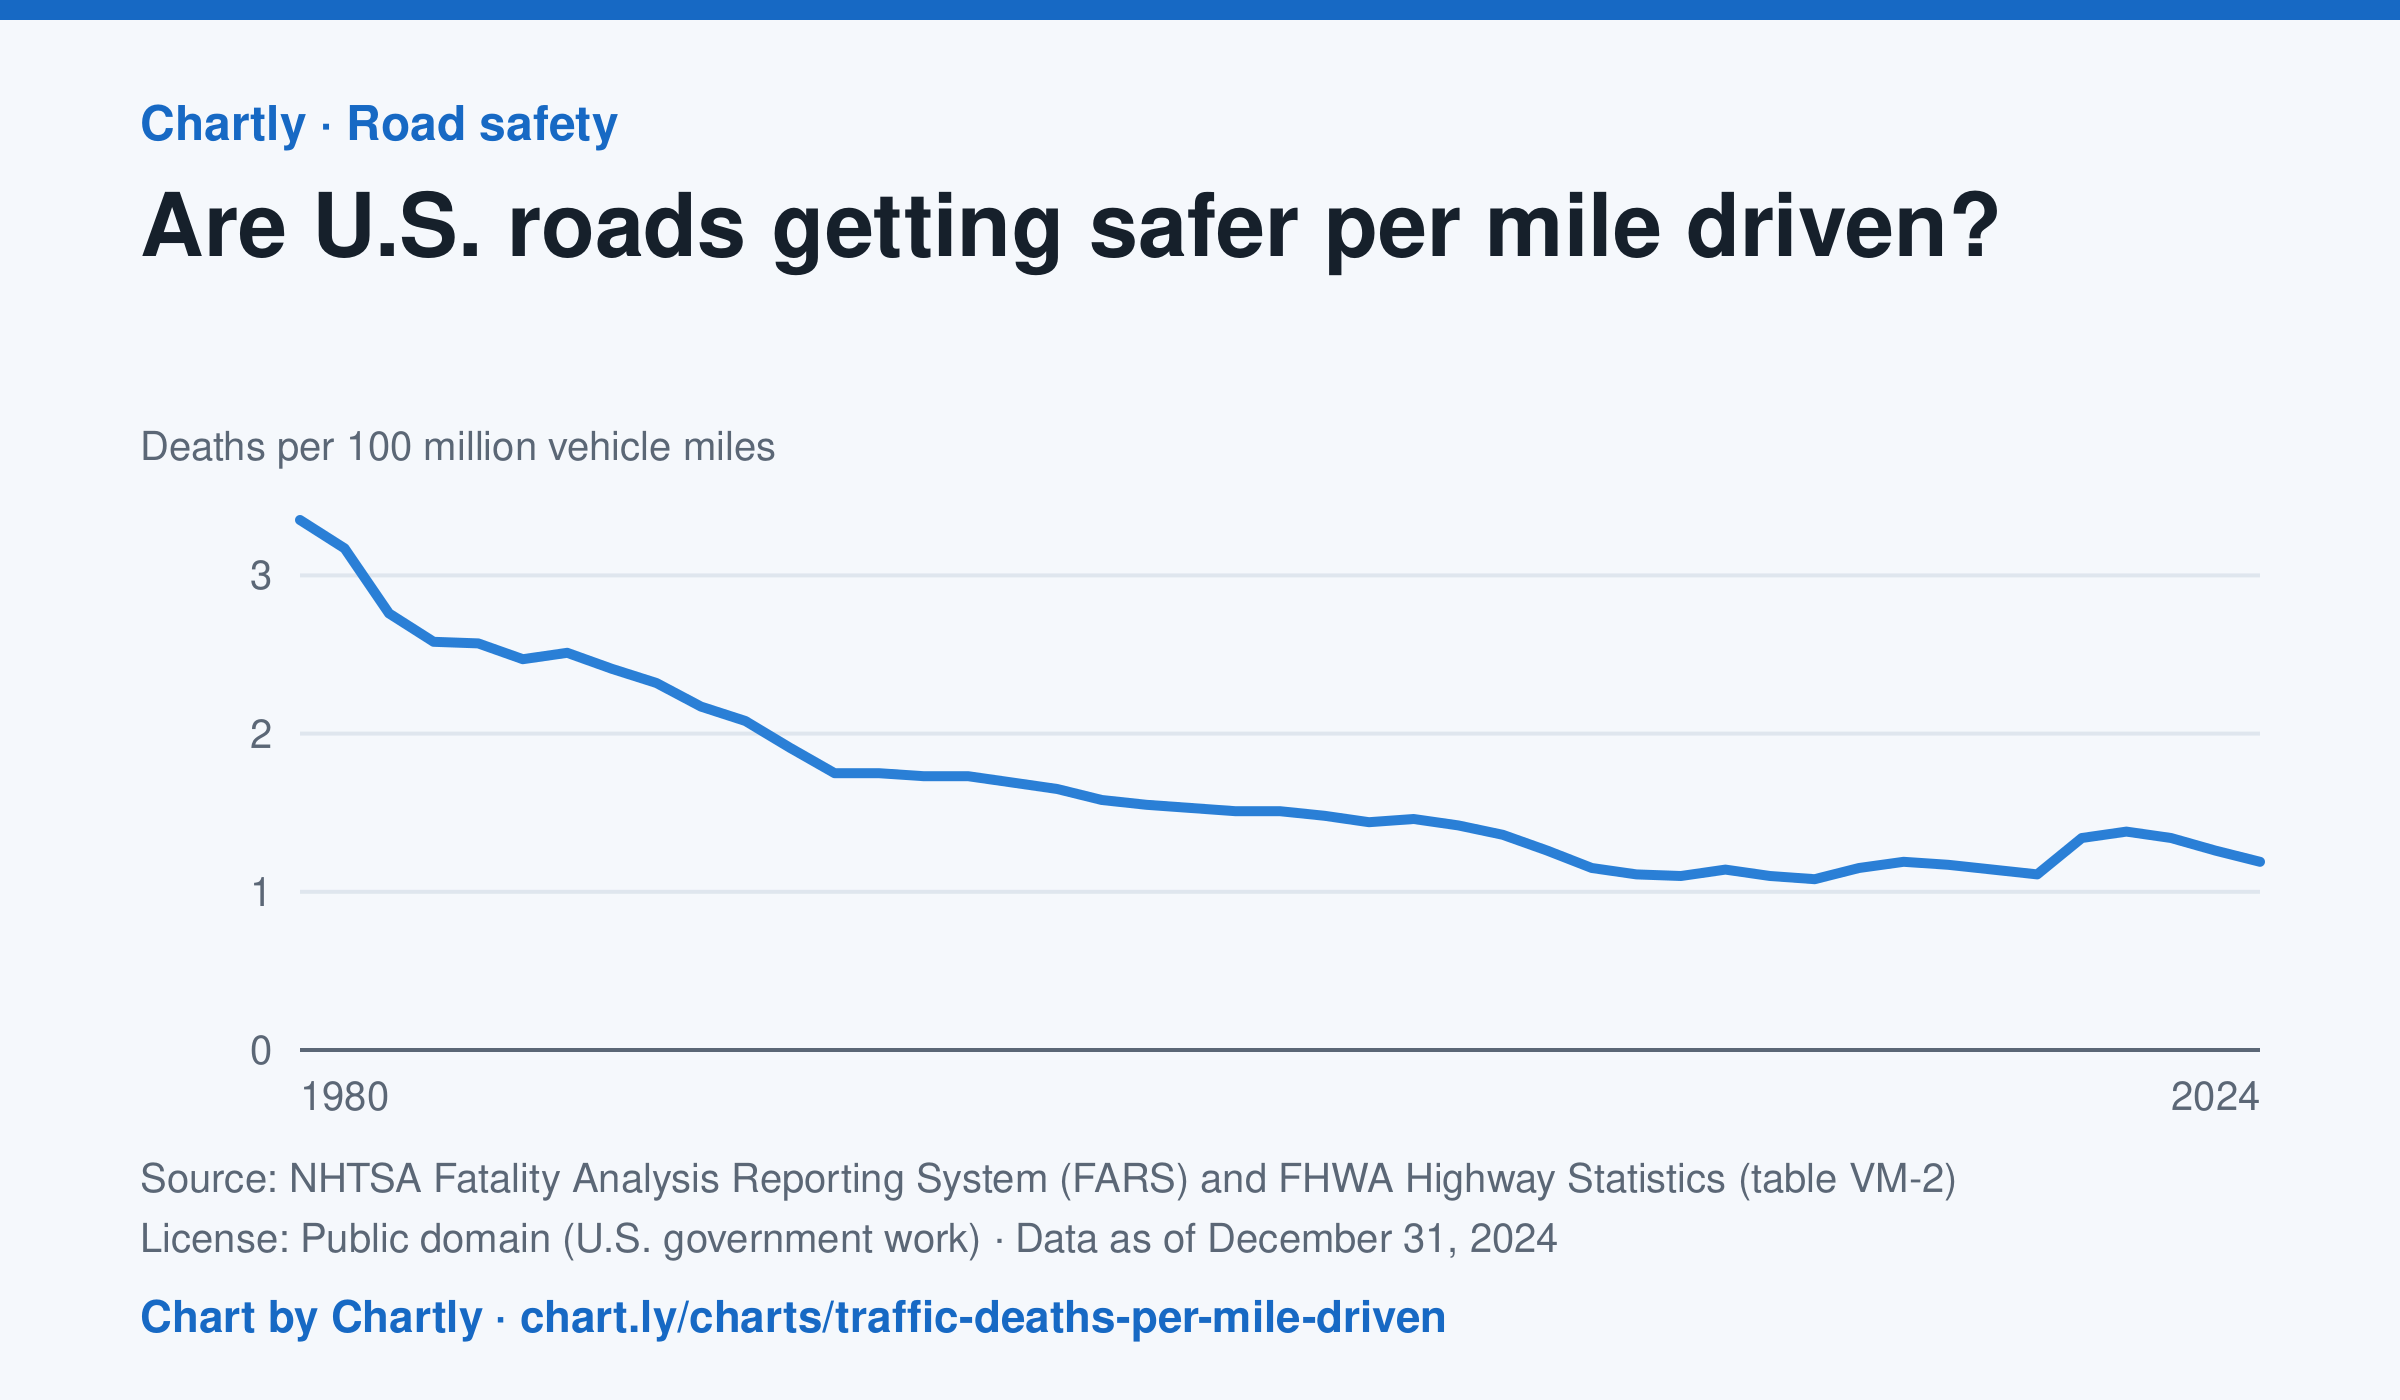
In 2024 there were 1.19 deaths for every 100 million miles driven, down from 3.35 in 1980. The lowest rate was 1.08 in 2014; it jumped to 1.34 in 2020, when people drove less but deaths rose. Miles driven are the Federal Highway Administration's estimates.
Source: NHTSA Fatality Analysis Reporting System (FARS) and FHWA Highway Statistics (table VM-2) (Public domain (U.S. government work)) · Data as of Dec 31, 2024
How to read this chart
Each point is the number of people killed in traffic crashes for every 100 million miles Americans drove that year. Dividing by miles driven turns a count into a rate, so years when people drove more or less can be compared fairly.
Questions
- About what fraction of the 1980 rate is the rate in the latest year?
- In 2020 people drove less, but the rate went up. What could explain that?
- Why is deaths per mile a fairer way to compare years than the total number of deaths?
Chart and numbers: chart.ly/charts/traffic-deaths-per-mile-driven · More free charts at chart.ly