Print this worksheet, or choose "Save as PDF" in the print window to share a file.
Chart worksheet
Charts to read and discuss
Name:
Class:
Date:
Chart 1 of 2 · Schools
How much does each state spend per public school student?
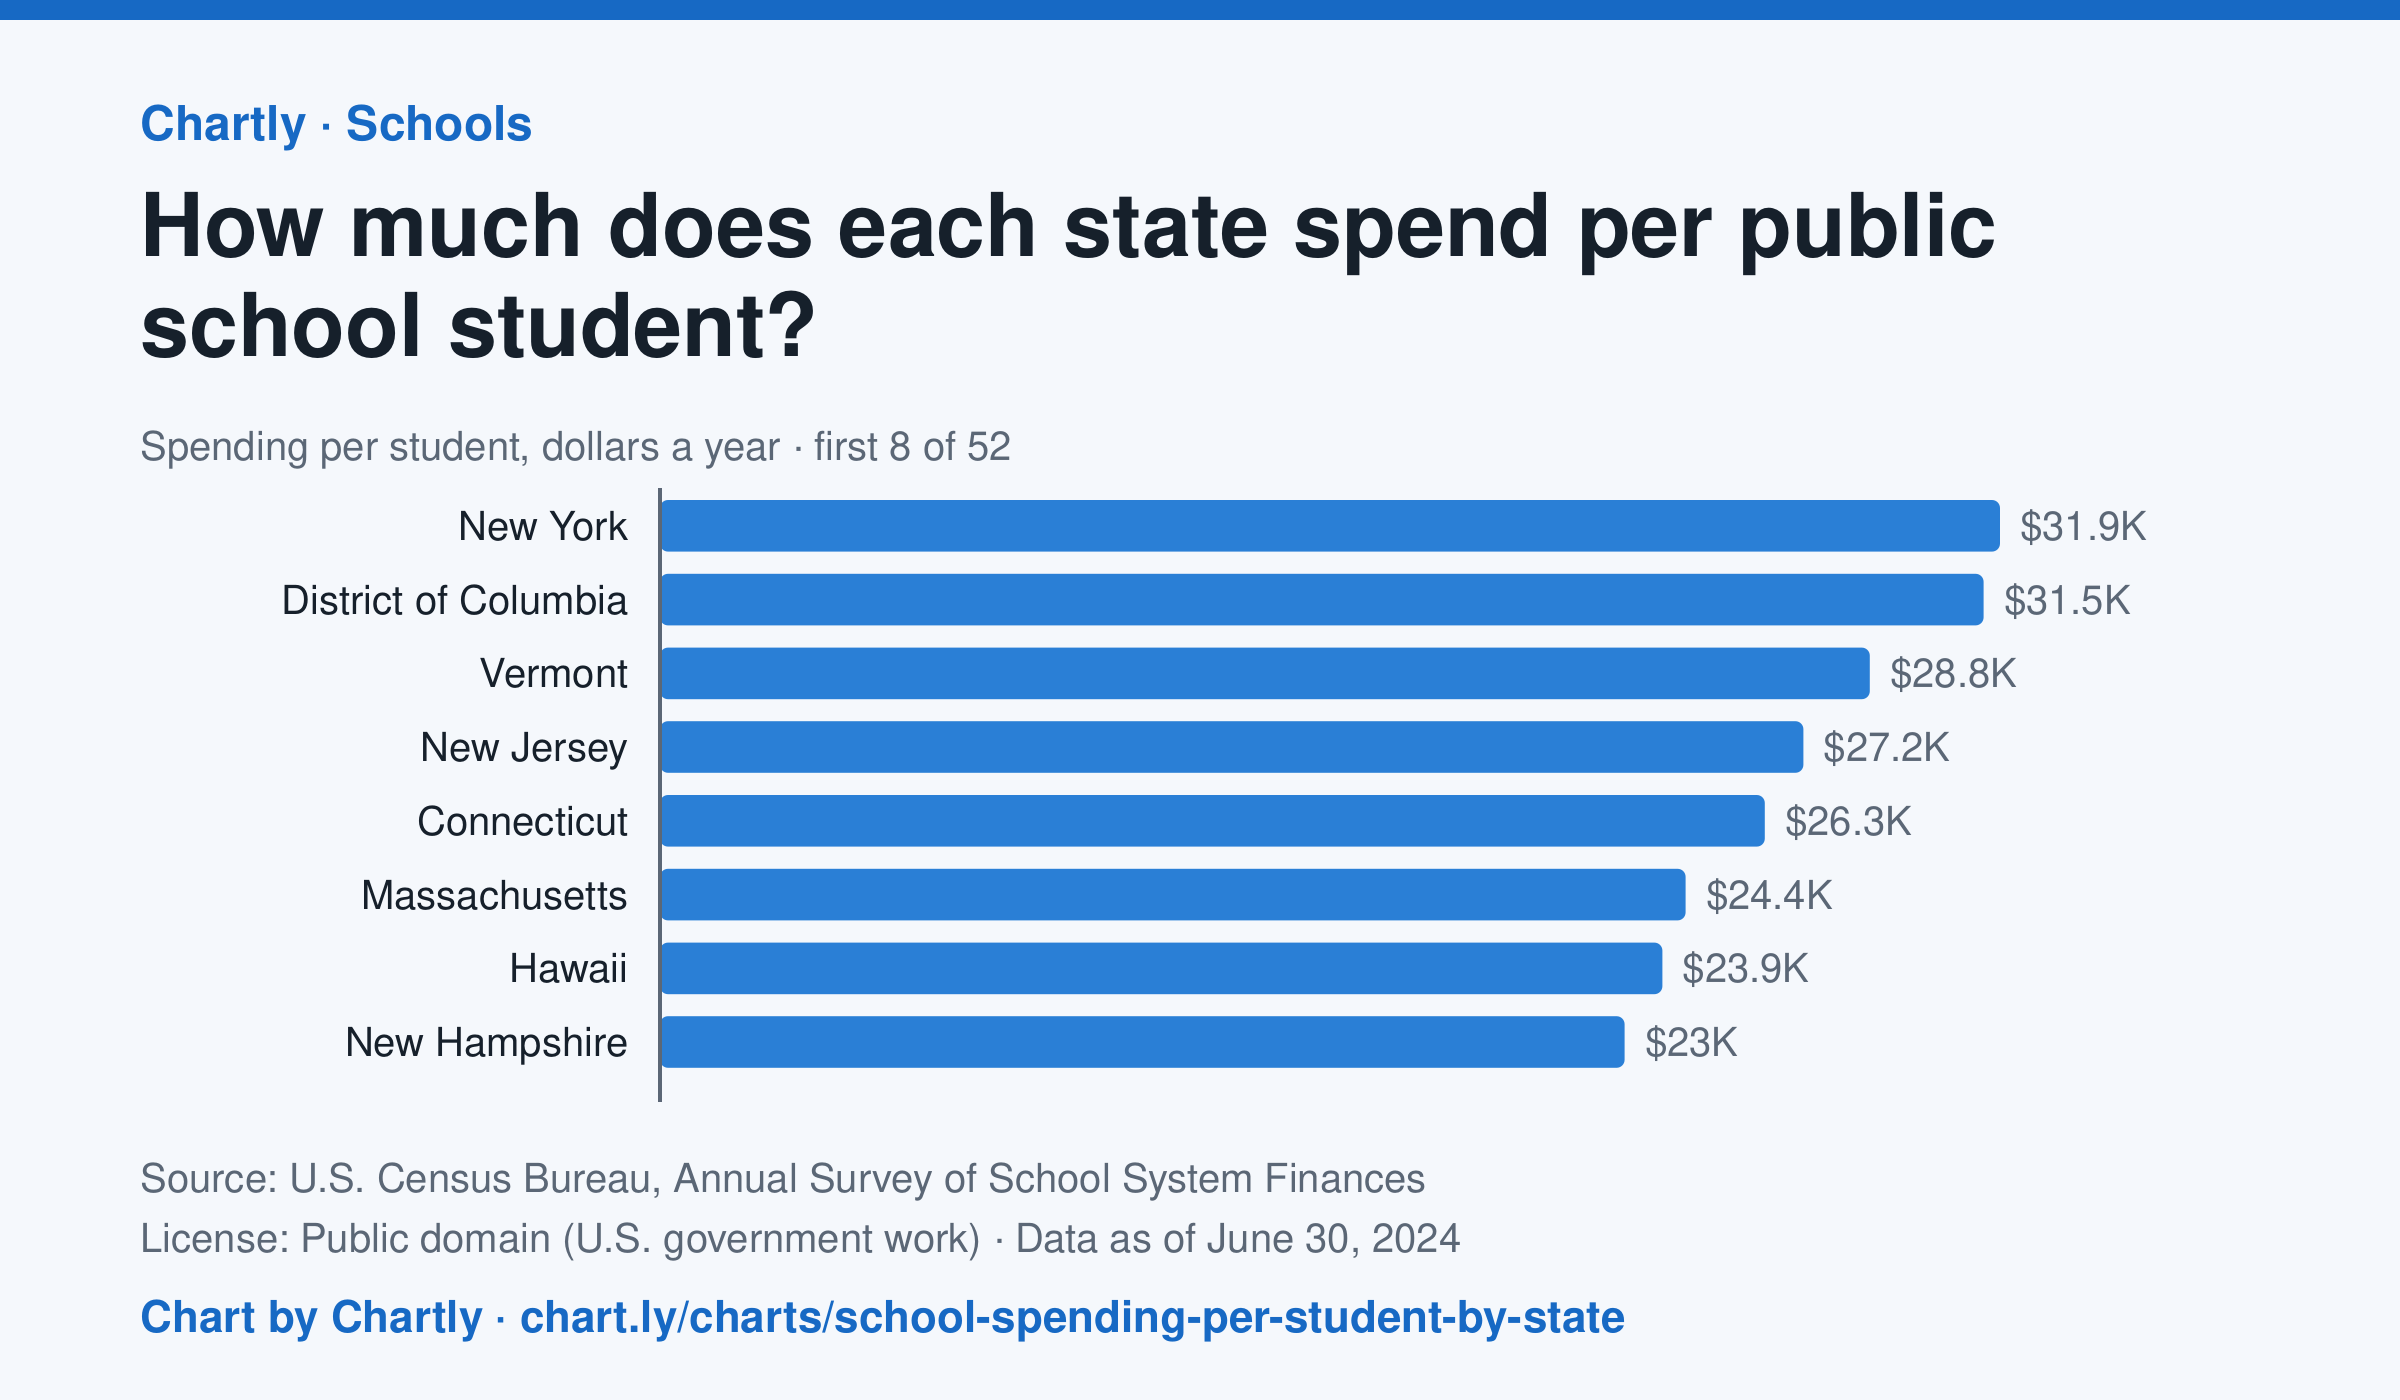
In the school year that ended in 2024, New York spent the most per public school student, $31,918, followed by District of Columbia ($31,529) and Vermont ($28,818). Idaho spent the least, $11,060, and the figure for the whole U.S. was $17,619. This is day-to-day spending on teachers, staff, supplies and buses, not on buildings or debt, and it isn't adjusted for each state's prices.
Source: U.S. Census Bureau, Annual Survey of School System Finances (Public domain (U.S. government work)) · Data as of Jun 30, 2024
How to read this chart
Each bar is how much a state's public schools spent per student in a school year, in dollars, on teachers, staff, supplies and running schools. It leaves out new buildings and debt. It is not adjusted for local prices, so a dollar goes further in some states than others. The dashed line is the U.S.
Questions
- Which state spends the most per student and which the least? How many times more is the top state?
- Where does your state rank, and is it above or below the U.S. line?
- Teachers' pay and rents cost more in some states. How could that explain part of the gap between states?
Chart and numbers: chart.ly/charts/school-spending-per-student-by-state · More free charts at chart.ly
Chart 2 of 2 · Climate
Which US states have warmed the most?
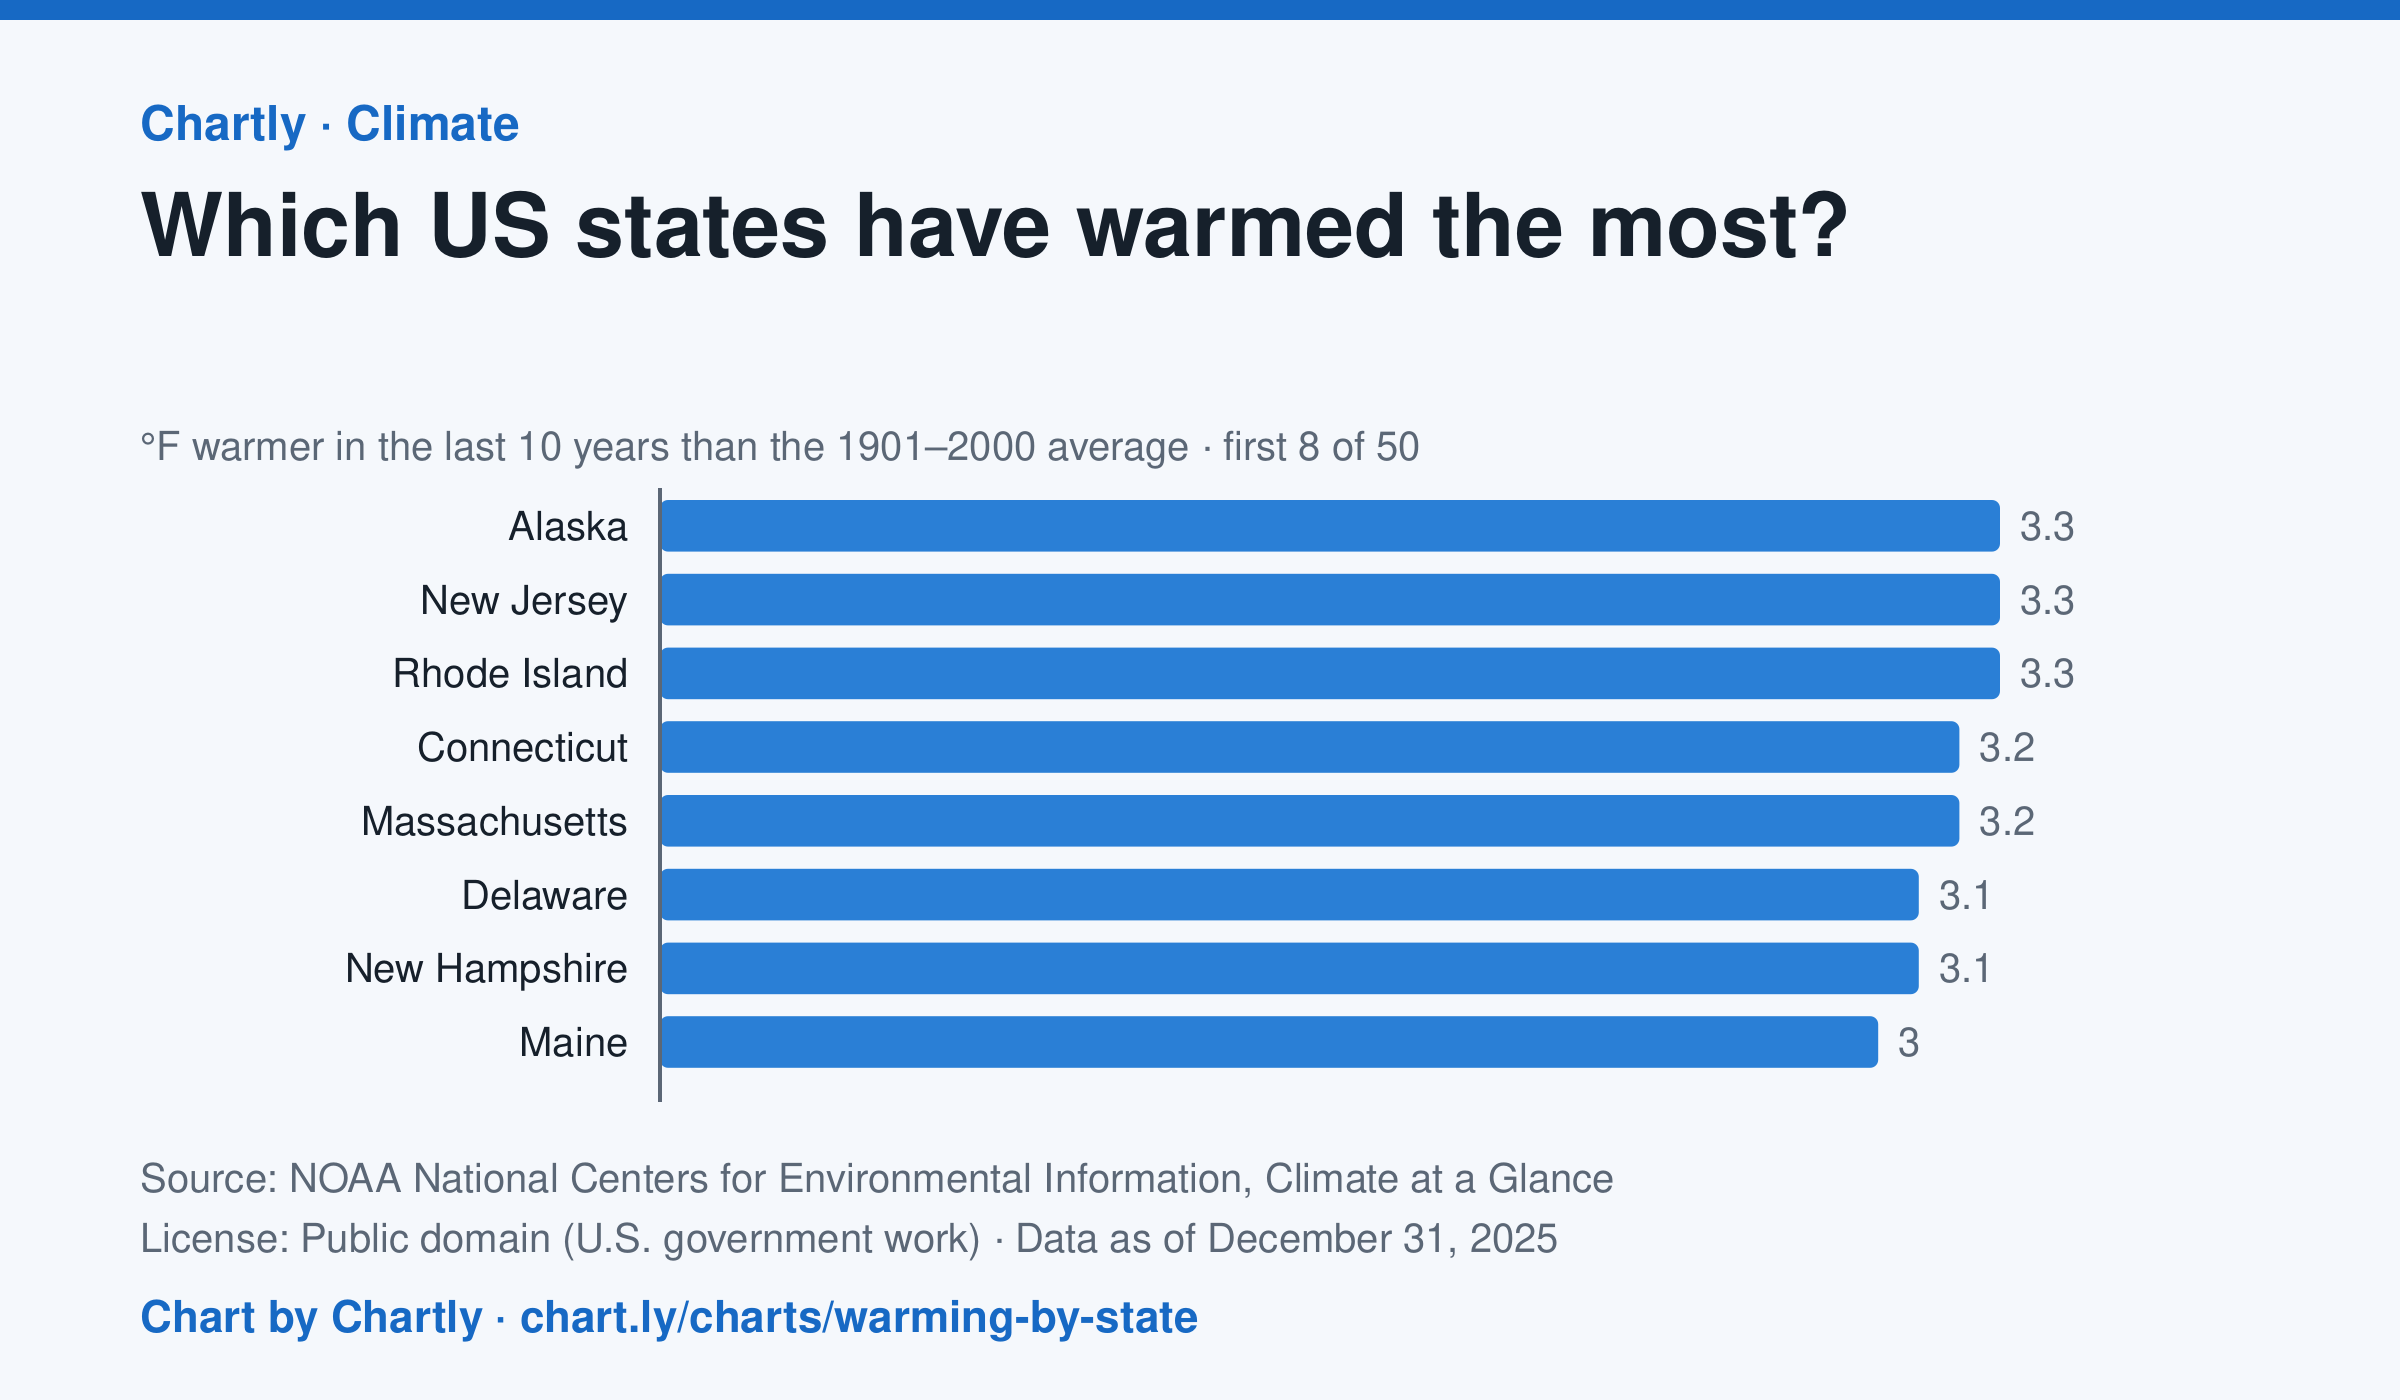
In the 10 years through 2025, Alaska was among the states that warmed most, averaging 3.3°F warmer than in 1901–2000, while Oklahoma was among those that warmed least, 1.6°F; the contiguous US warmed 2.2°F. Alaska's records start in 1925, so its baseline is 1925–2000. Hawaii's start in 1991, so it isn't included.
Source: NOAA National Centers for Environmental Information, Climate at a Glance (Public domain (U.S. government work)) · Data as of Dec 31, 2025
How to read this chart
Each bar shows how much warmer a state's last 10 years were than its average for 1901 to 2000, in degrees Fahrenheit. Ten years are averaged so one hot or cold year doesn't decide a state's place. The dashed line is the whole lower 48 states.
Questions
- Which states warmed the most and the least? How many degrees apart are they?
- Do the states that warmed most sit together in one part of the country, or are they spread out?
- Why do scientists compare with a long average like 1901 to 2000 instead of with just last year?
Chart and numbers: chart.ly/charts/warming-by-state · More free charts at chart.ly