Print this worksheet, or choose "Save as PDF" in the print window to share a file.
Chart worksheet
Charts to read and discuss
Name:
Class:
Date:
Chart 1 of 2 · Schools
How much does each state spend per public school student?
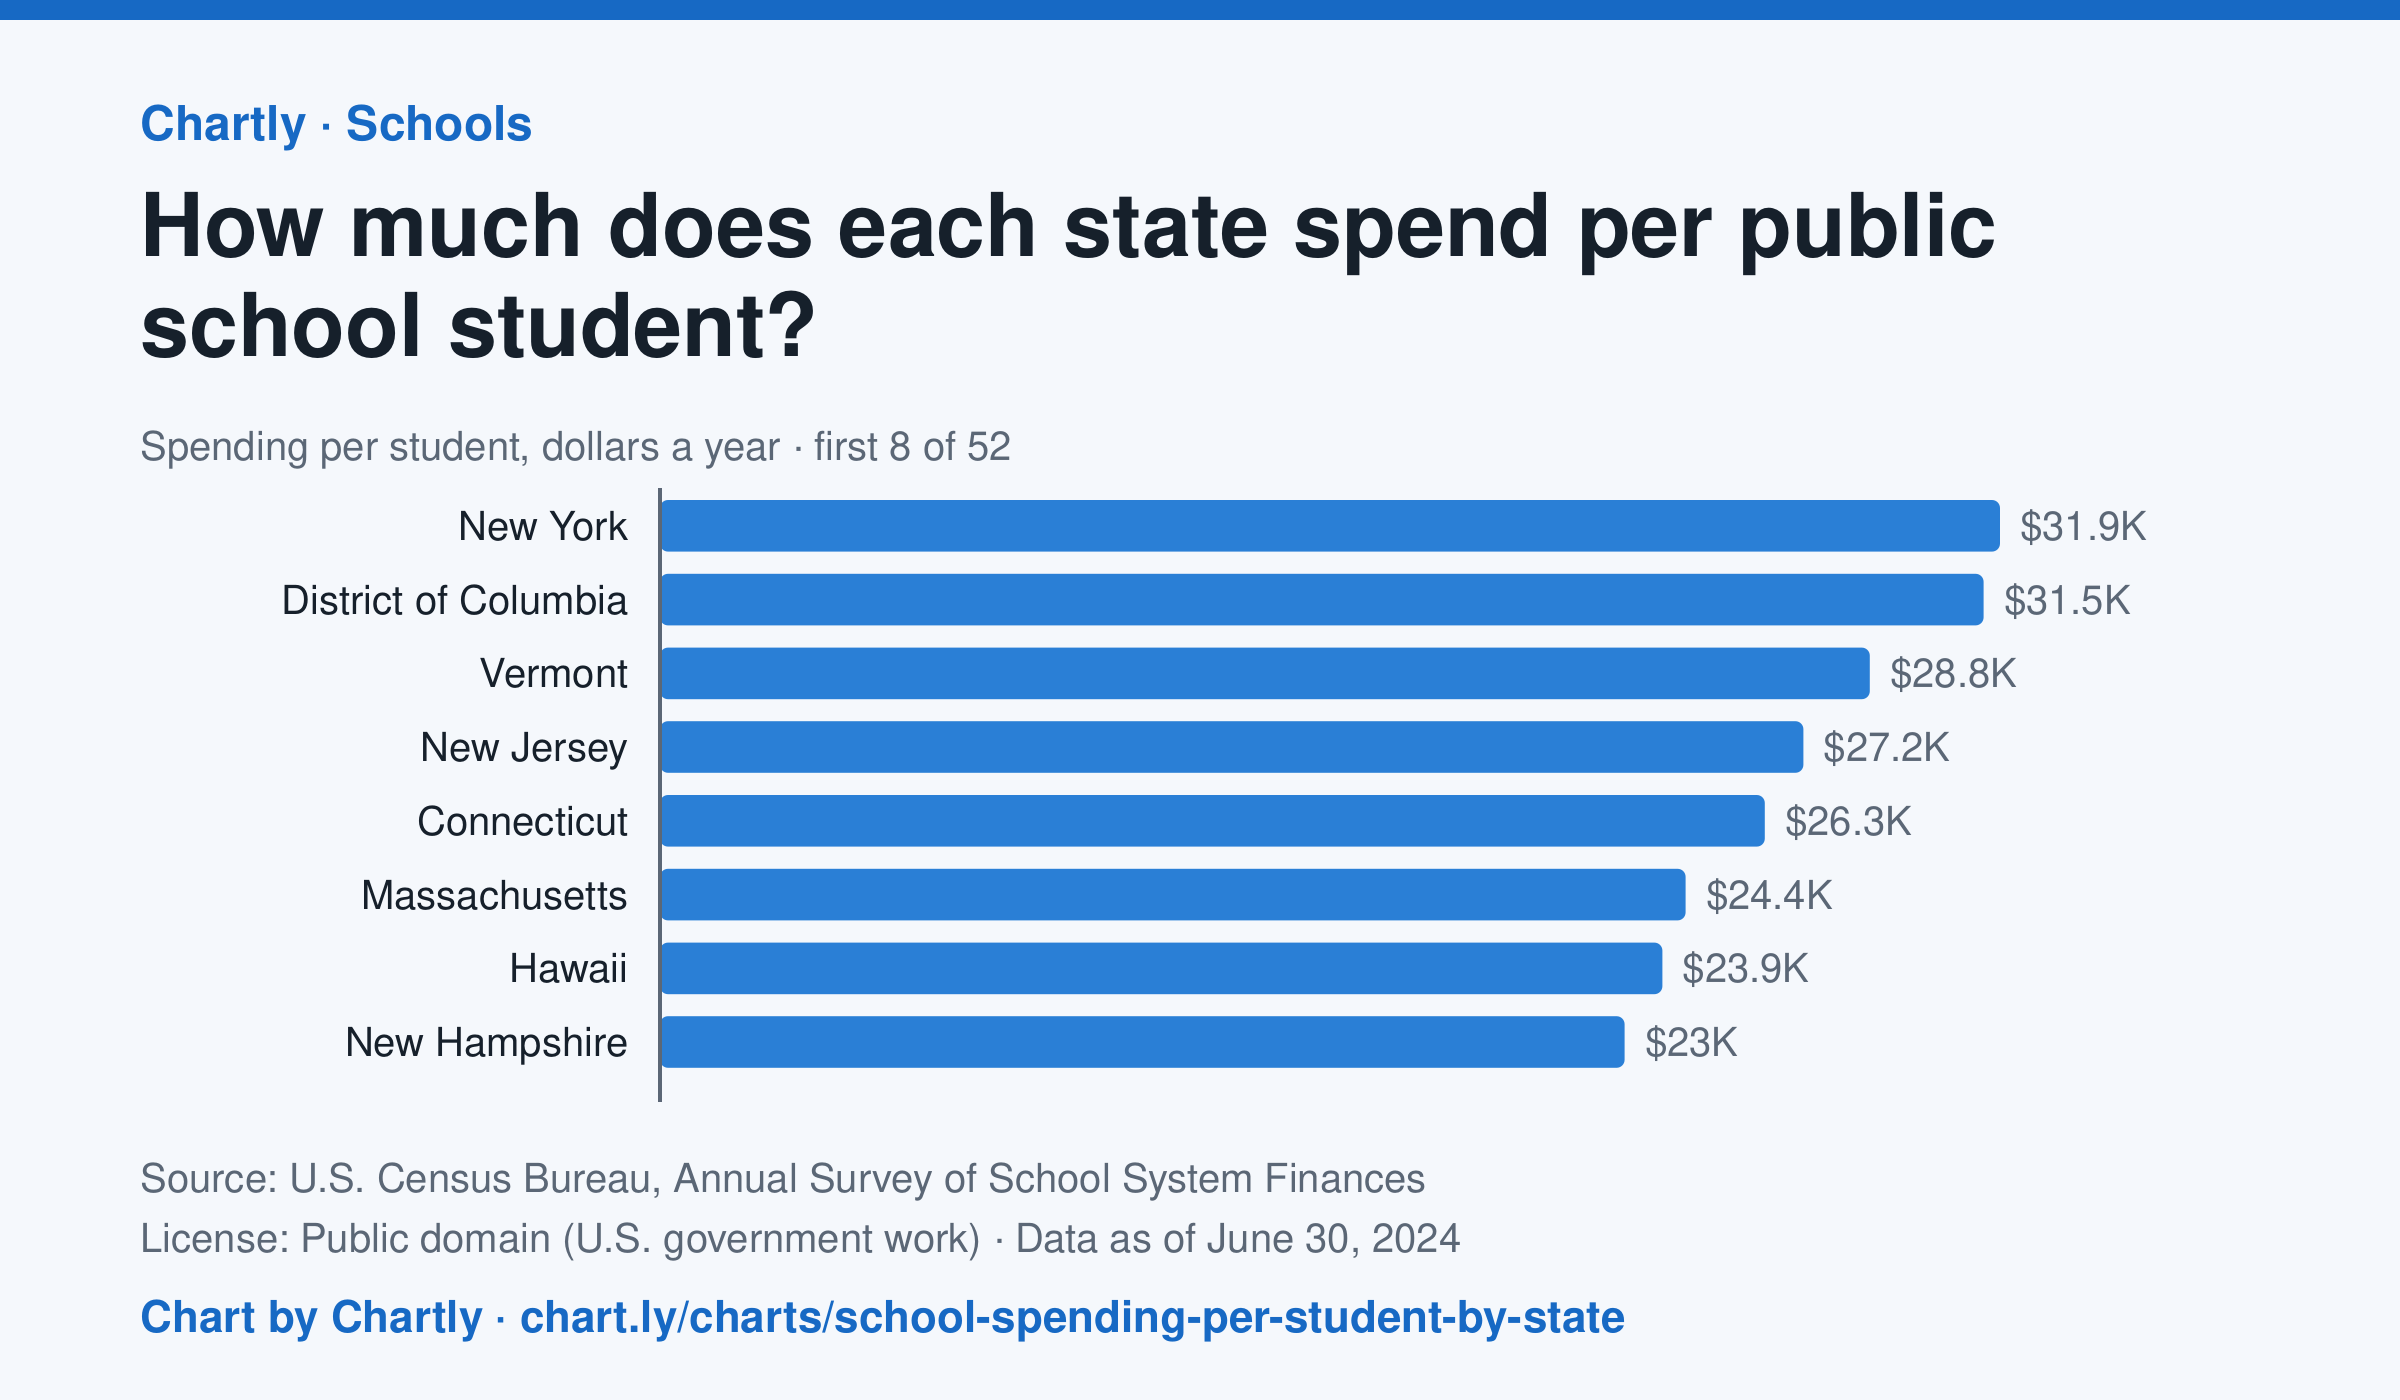
In the school year that ended in 2024, New York spent the most per public school student, $31,918, followed by District of Columbia ($31,529) and Vermont ($28,818). Idaho spent the least, $11,060, and the figure for the whole U.S. was $17,619. This is day-to-day spending on teachers, staff, supplies and buses, not on buildings or debt, and it isn't adjusted for each state's prices.
Source: U.S. Census Bureau, Annual Survey of School System Finances (Public domain (U.S. government work)) · Data as of Jun 30, 2024
How to read this chart
Each bar is how much a state's public schools spent per student in a school year, in dollars, on teachers, staff, supplies and running schools. It leaves out new buildings and debt. It is not adjusted for local prices, so a dollar goes further in some states than others. The dashed line is the U.S.
Questions
- Which state spends the most per student and which the least? How many times more is the top state?
- Where does your state rank, and is it above or below the U.S. line?
- Teachers' pay and rents cost more in some states. How could that explain part of the gap between states?
Chart and numbers: chart.ly/charts/school-spending-per-student-by-state · More free charts at chart.ly
Chart 2 of 2 · World
How many people live in each country?
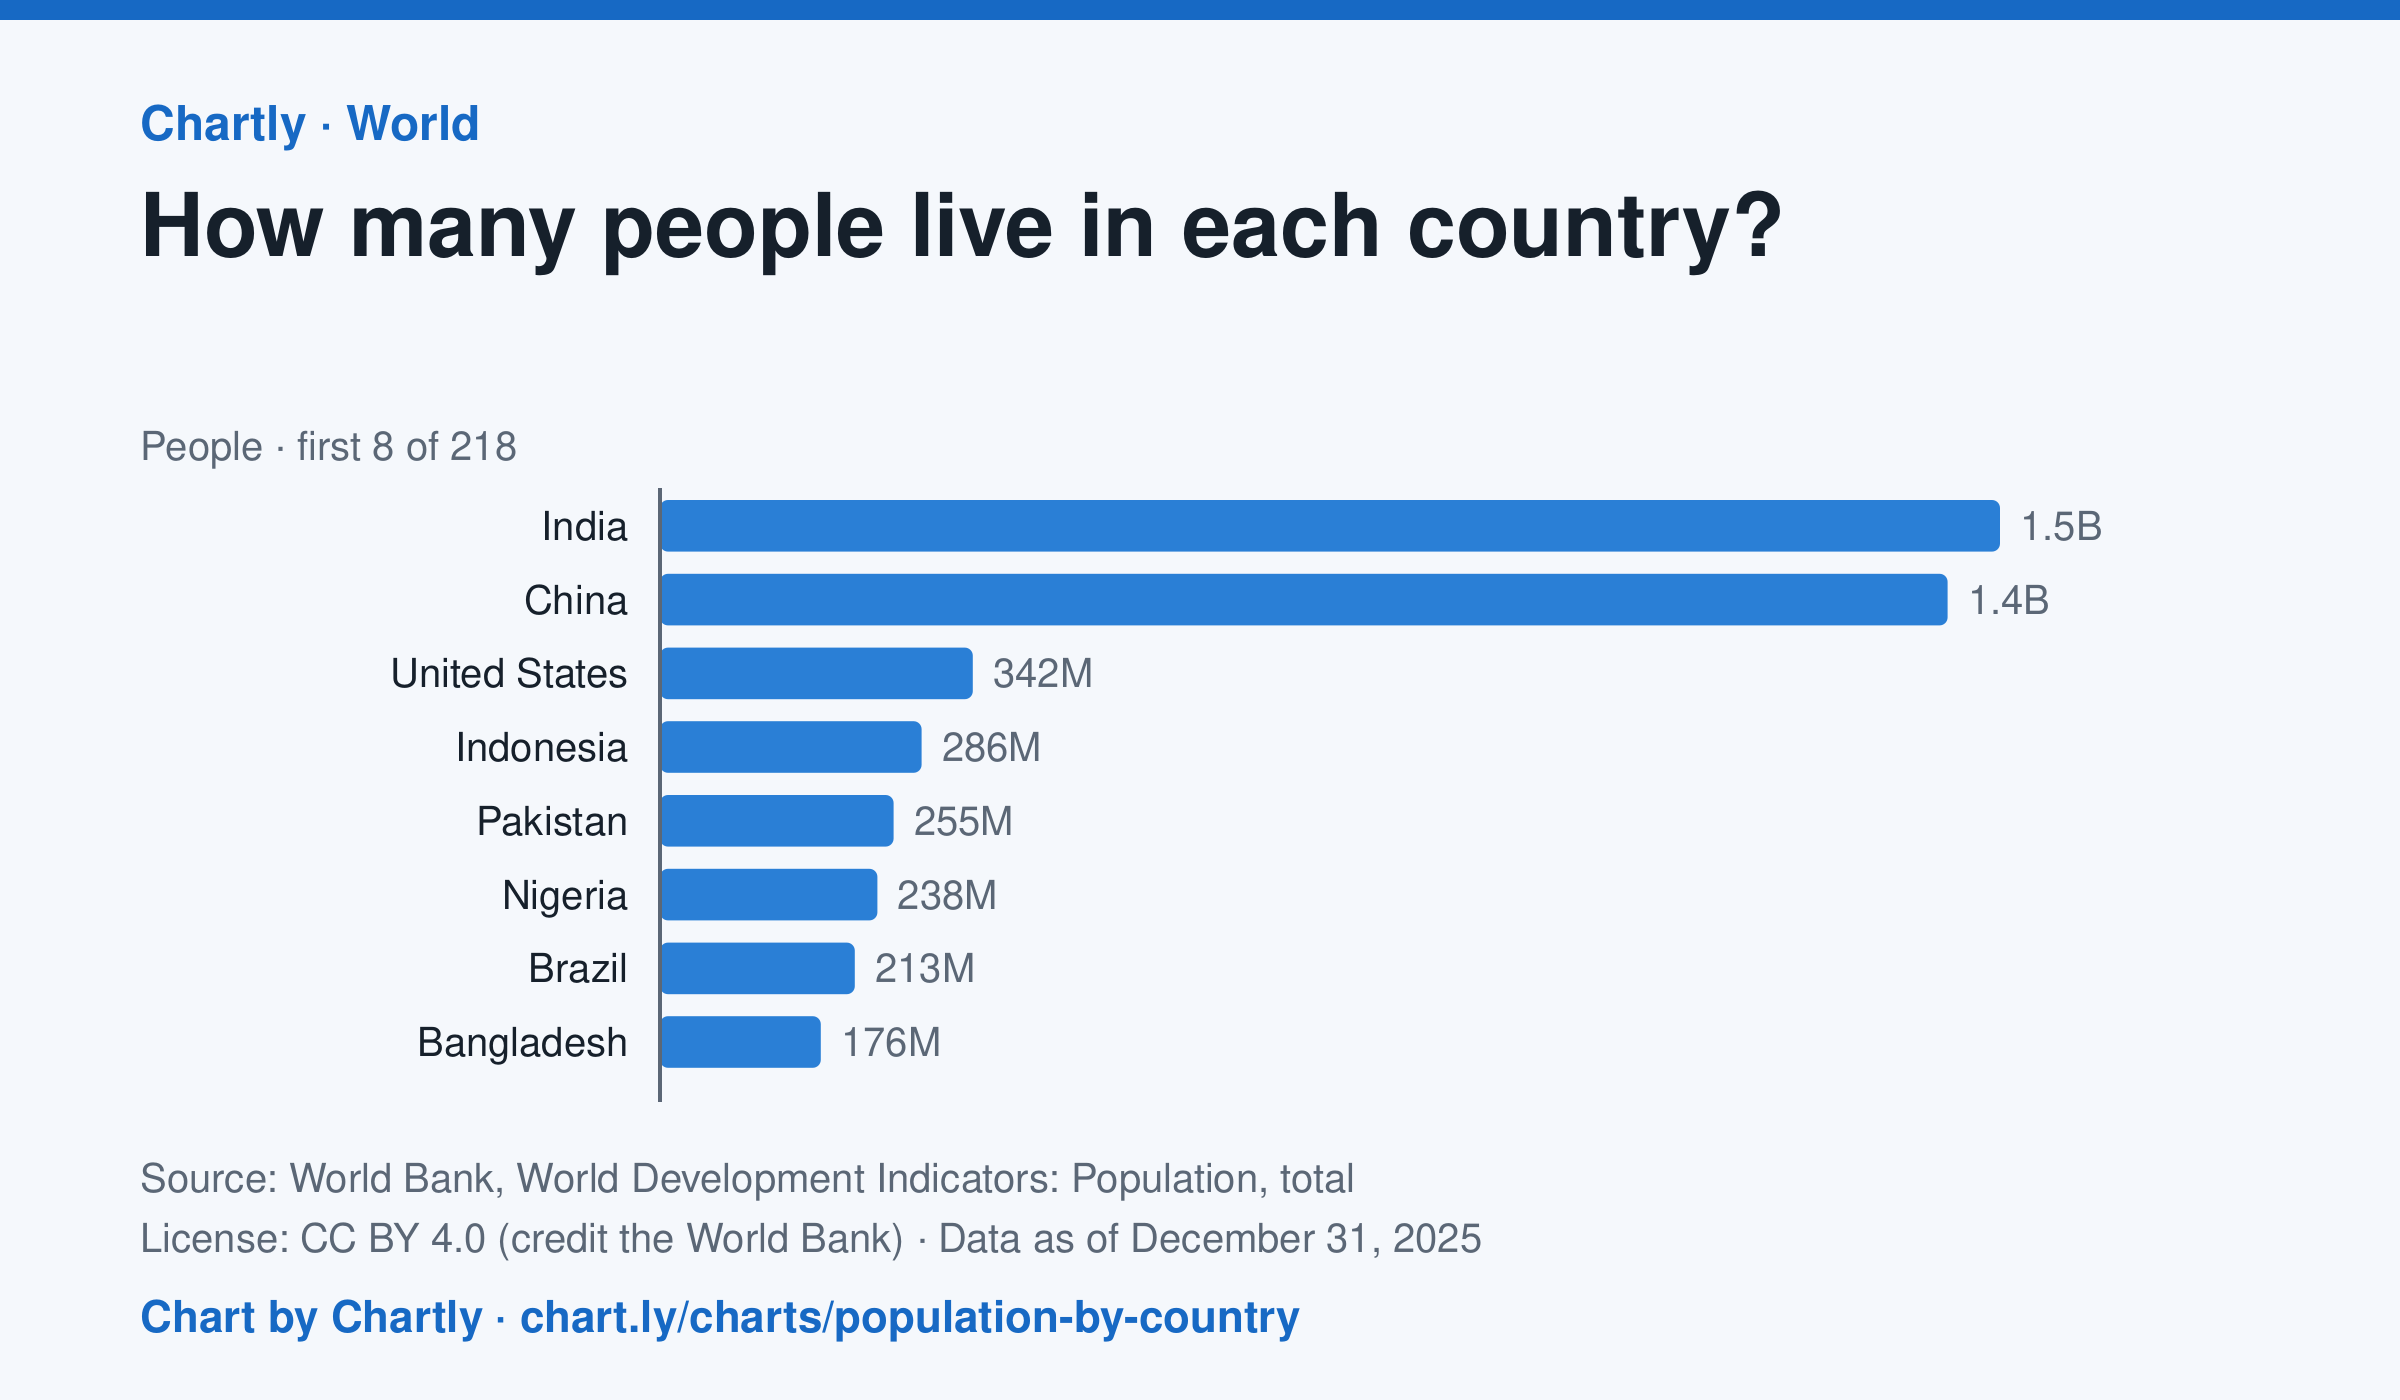
India, with 1.46 billion people in 2025, and China, with 1.41 billion, are far larger than any other country; the United States is third with 342 million. The smallest, Tuvalu, had about 9,500 people. Search 217 countries and territories. Figures are mid-year estimates, many from the United Nations.
Source: World Bank, World Development Indicators: Population, total (CC BY 4.0 (credit the World Bank)) · Data as of Dec 31, 2025
How to read this chart
Each bar is how many people lived in a country in a year, estimated by the United Nations and reported by the World Bank. On a phone the chart opens on the 10 biggest and smallest; search for any country. The bars start at zero, so a bar twice as long means twice as many people.
Questions
- Which two countries have the most people, and how far ahead are they of the third?
- About what share of the world's people live in the top two countries?
- A country with many people isn't always crowded. What other number would you need to know how crowded it is?
Chart and numbers: chart.ly/charts/population-by-country · More free charts at chart.ly