Print this worksheet, or choose "Save as PDF" in the print window to share a file.
Chart worksheet
Charts to read and discuss
Name:
Class:
Date:
Chart 1 of 2 · Schools
How much does each state spend per public school student?
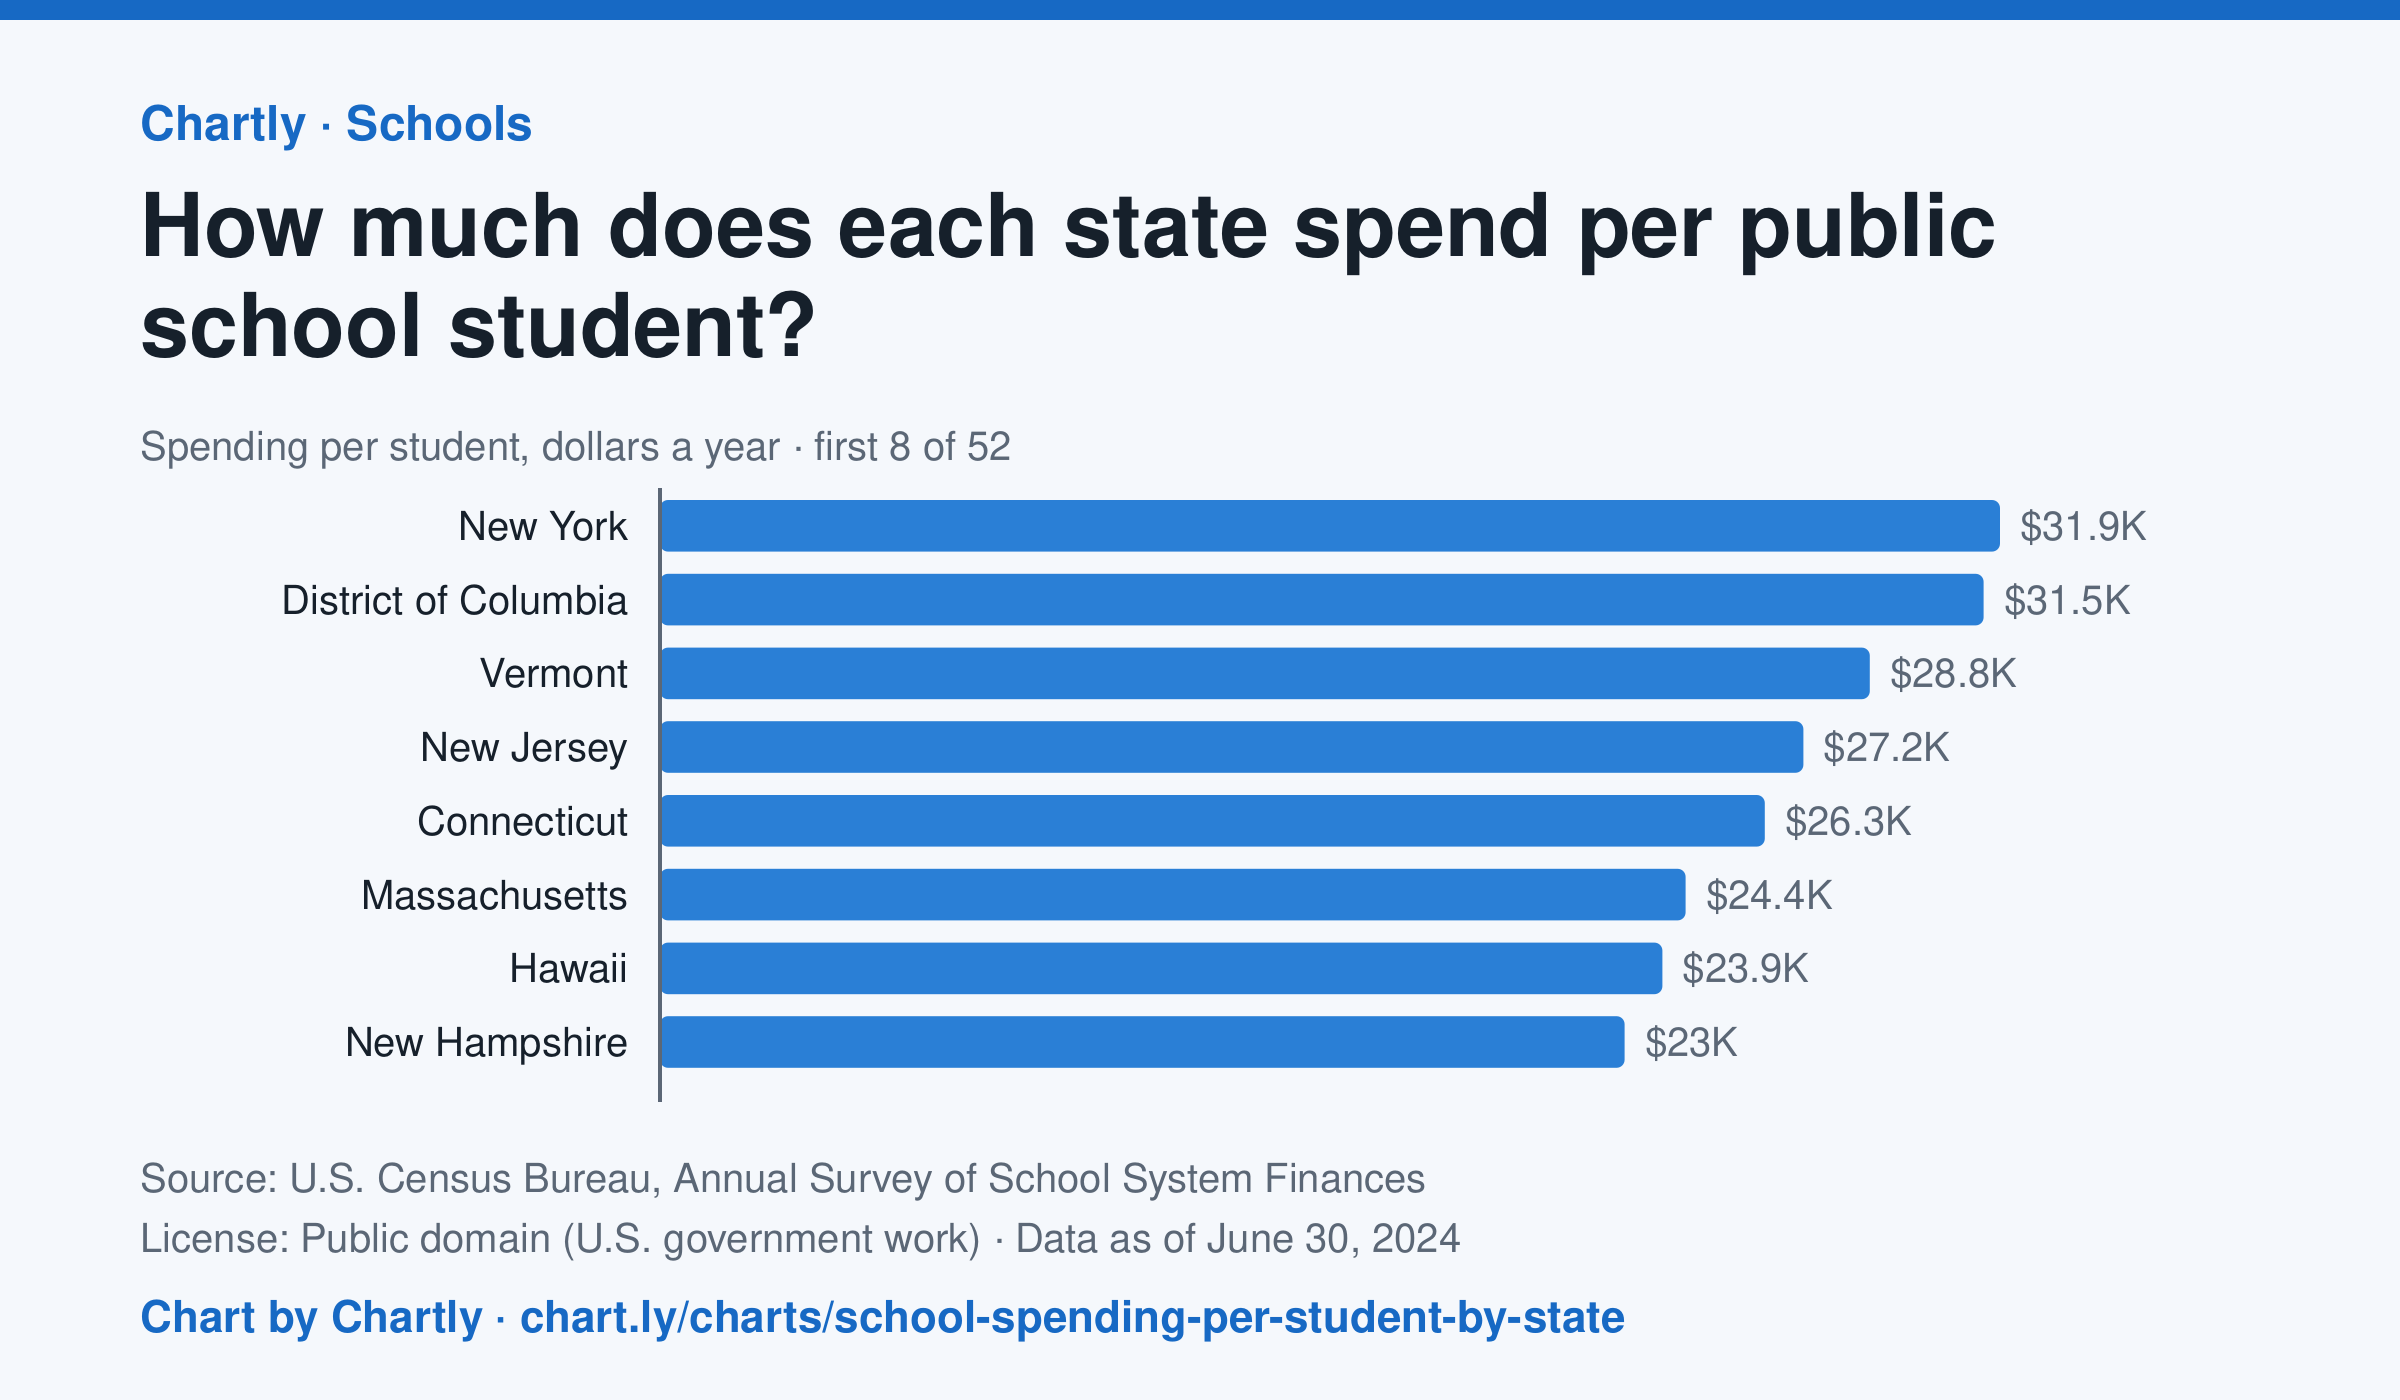
In the school year that ended in 2024, New York spent the most per public school student, $31,918, followed by District of Columbia ($31,529) and Vermont ($28,818). Idaho spent the least, $11,060, and the figure for the whole U.S. was $17,619. This is day-to-day spending on teachers, staff, supplies and buses, not on buildings or debt, and it isn't adjusted for each state's prices.
Source: U.S. Census Bureau, Annual Survey of School System Finances (Public domain (U.S. government work)) · Data as of Jun 30, 2024
How to read this chart
Each bar is how much a state's public schools spent per student in a school year, in dollars, on teachers, staff, supplies and running schools. It leaves out new buildings and debt. It is not adjusted for local prices, so a dollar goes further in some states than others. The dashed line is the U.S.
Questions
- Which state spends the most per student and which the least? How many times more is the top state?
- Where does your state rank, and is it above or below the U.S. line?
- Teachers' pay and rents cost more in some states. How could that explain part of the gap between states?
Chart and numbers: chart.ly/charts/school-spending-per-student-by-state · More free charts at chart.ly
Chart 2 of 2 · Inflation
How much have US consumer prices risen since 1913?
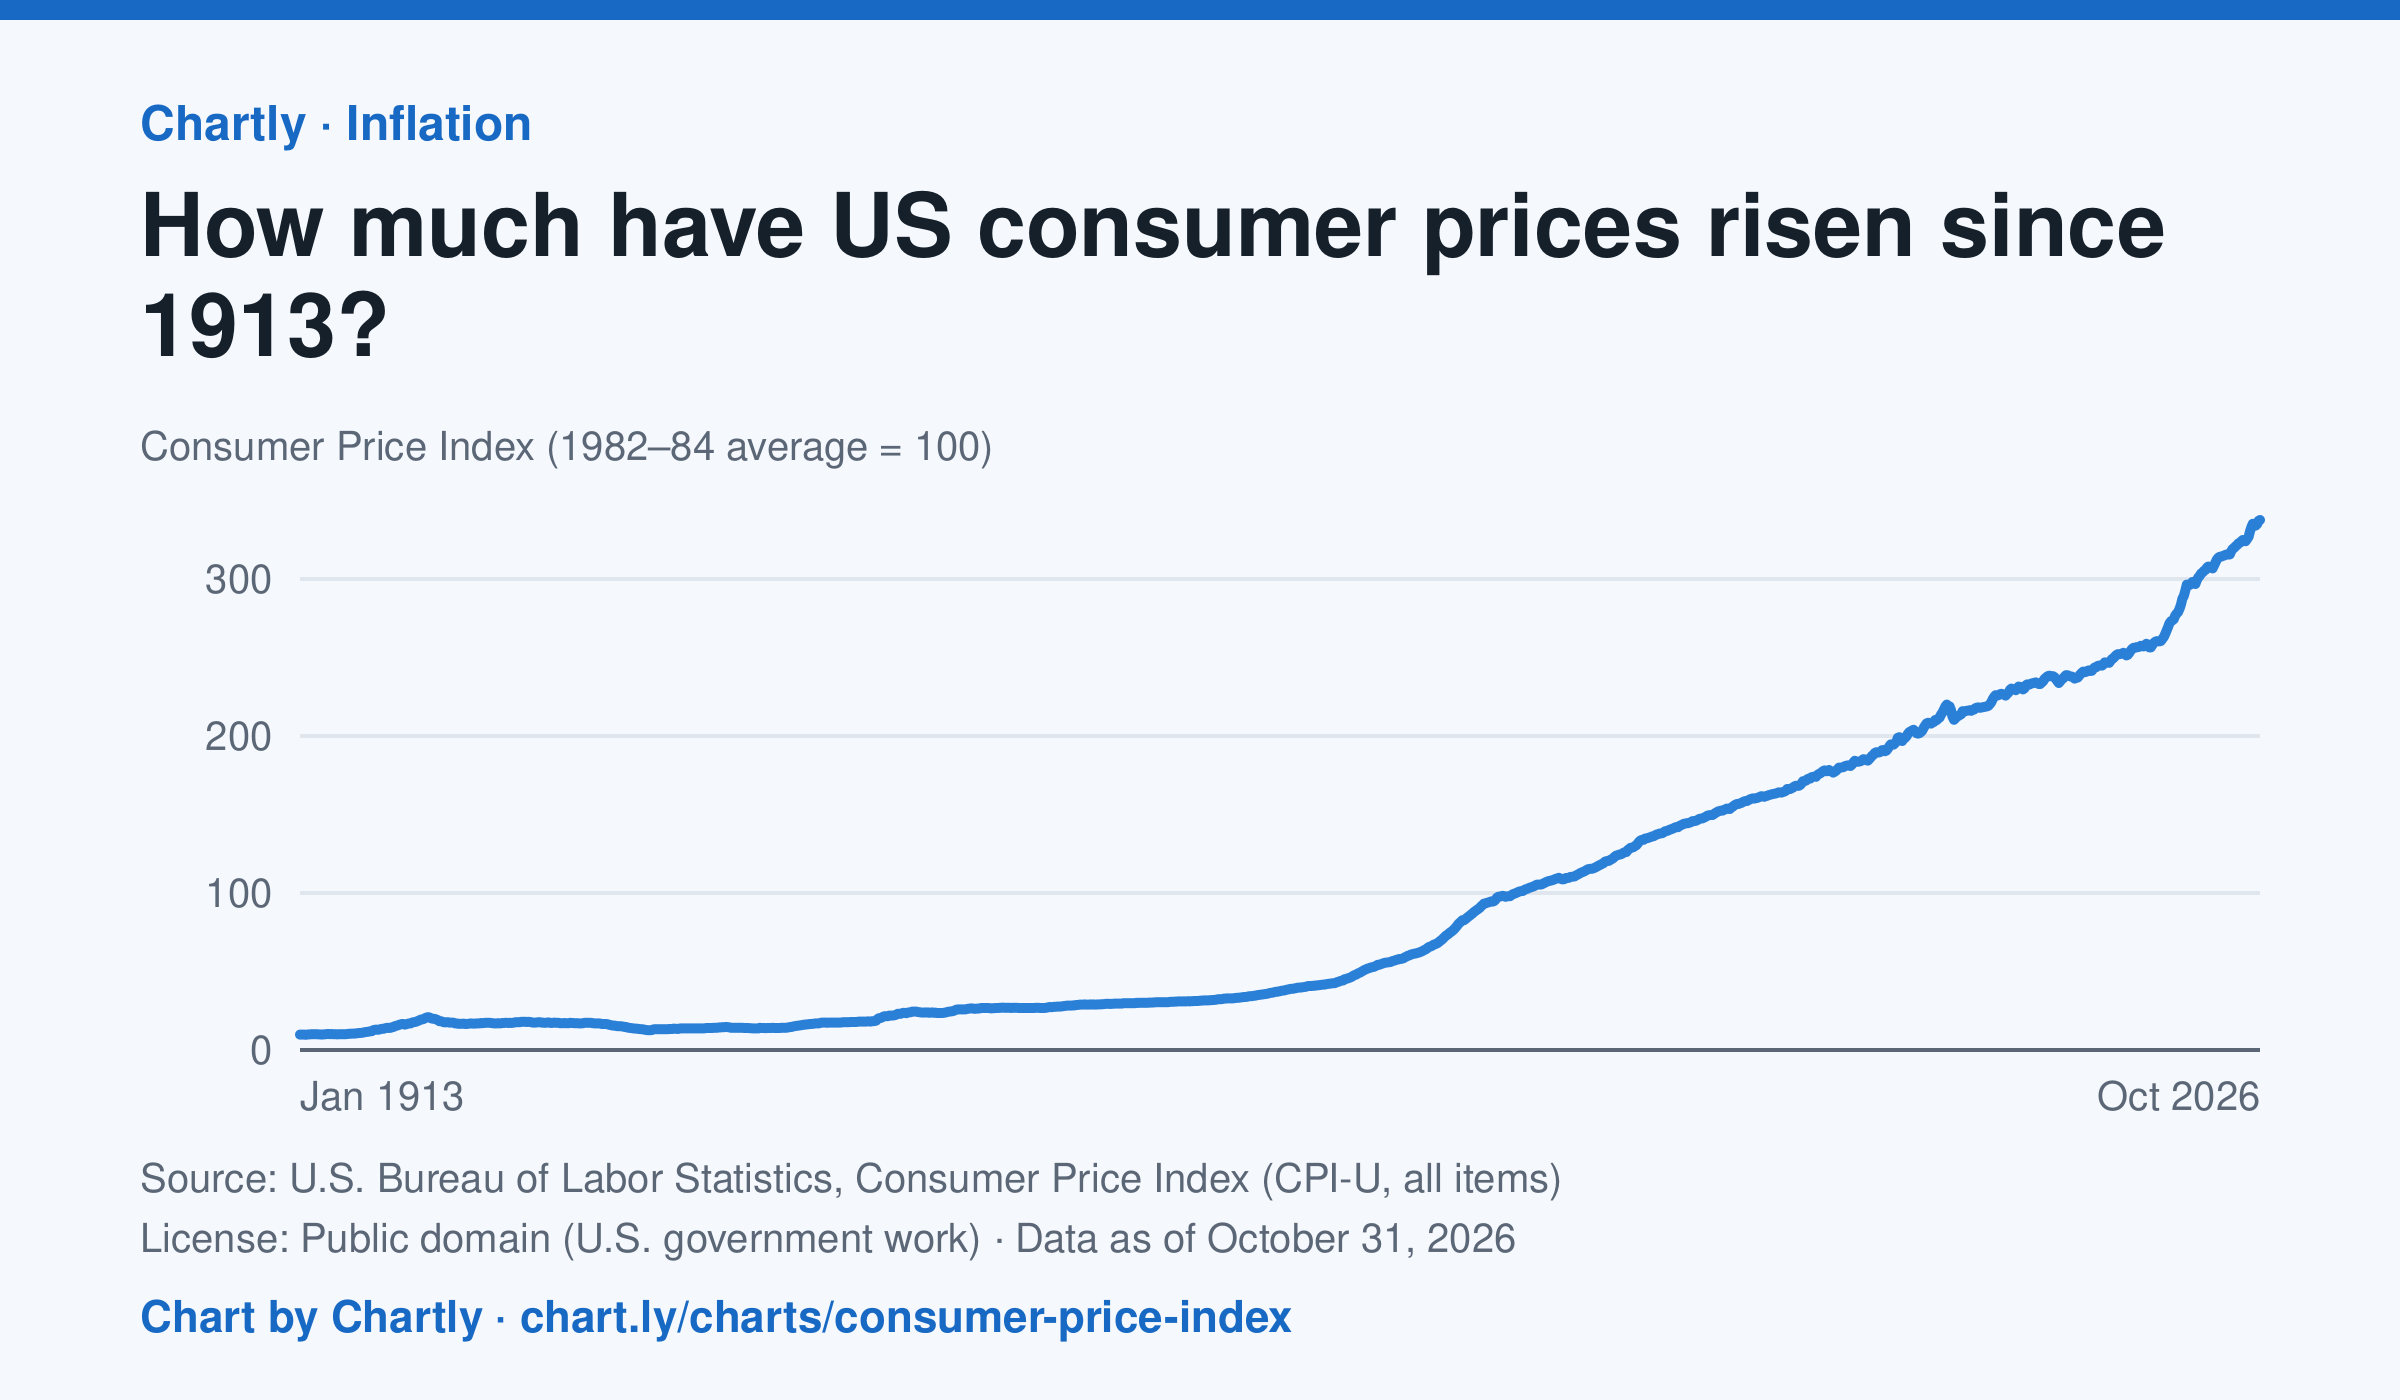
Consumer prices in October 2026 were 34 times their level in January 1913, when the Consumer Price Index begins: what cost $1 then cost about $34 in 2026. They were 2 times their level of January 2000. The index tracks what a typical basket of goods and services costs city households, with 100 as its 1982–84 average. Prices fell after 1920 and again in the early 1930s. October 2025 is missing because BLS collected no prices that month, during a lapse in federal funding.
Source: U.S. Bureau of Labor Statistics, Consumer Price Index (CPI-U, all items) (Public domain (U.S. government work)) · Data as of Oct 31, 2026
How to read this chart
The Consumer Price Index tracks the price of a fixed basket of things people buy, like food, rent, gas and clothing. It is an index, not dollars: prices in 1982 to 1984 are set to 100, so a value of 300 means the basket costs three times what it did then. Divide any two points to see how many times prices grew between them.
Questions
- How many times higher is the newest value than the first value on the chart? What does that mean for what $1 bought in 1913?
- Find a stretch where the line goes down. What does a falling index mean for prices, and when did it happen?
- Why does the government use a basket of many things instead of the price of just one item, like bread?
Chart and numbers: chart.ly/charts/consumer-price-index · More free charts at chart.ly