Print this worksheet, or choose "Save as PDF" in the print window to share a file.
Chart worksheet
Charts to read and discuss
Name:
Class:
Date:
Chart 1 of 3 · Crime
Which big U.S. cities have the most robberies?
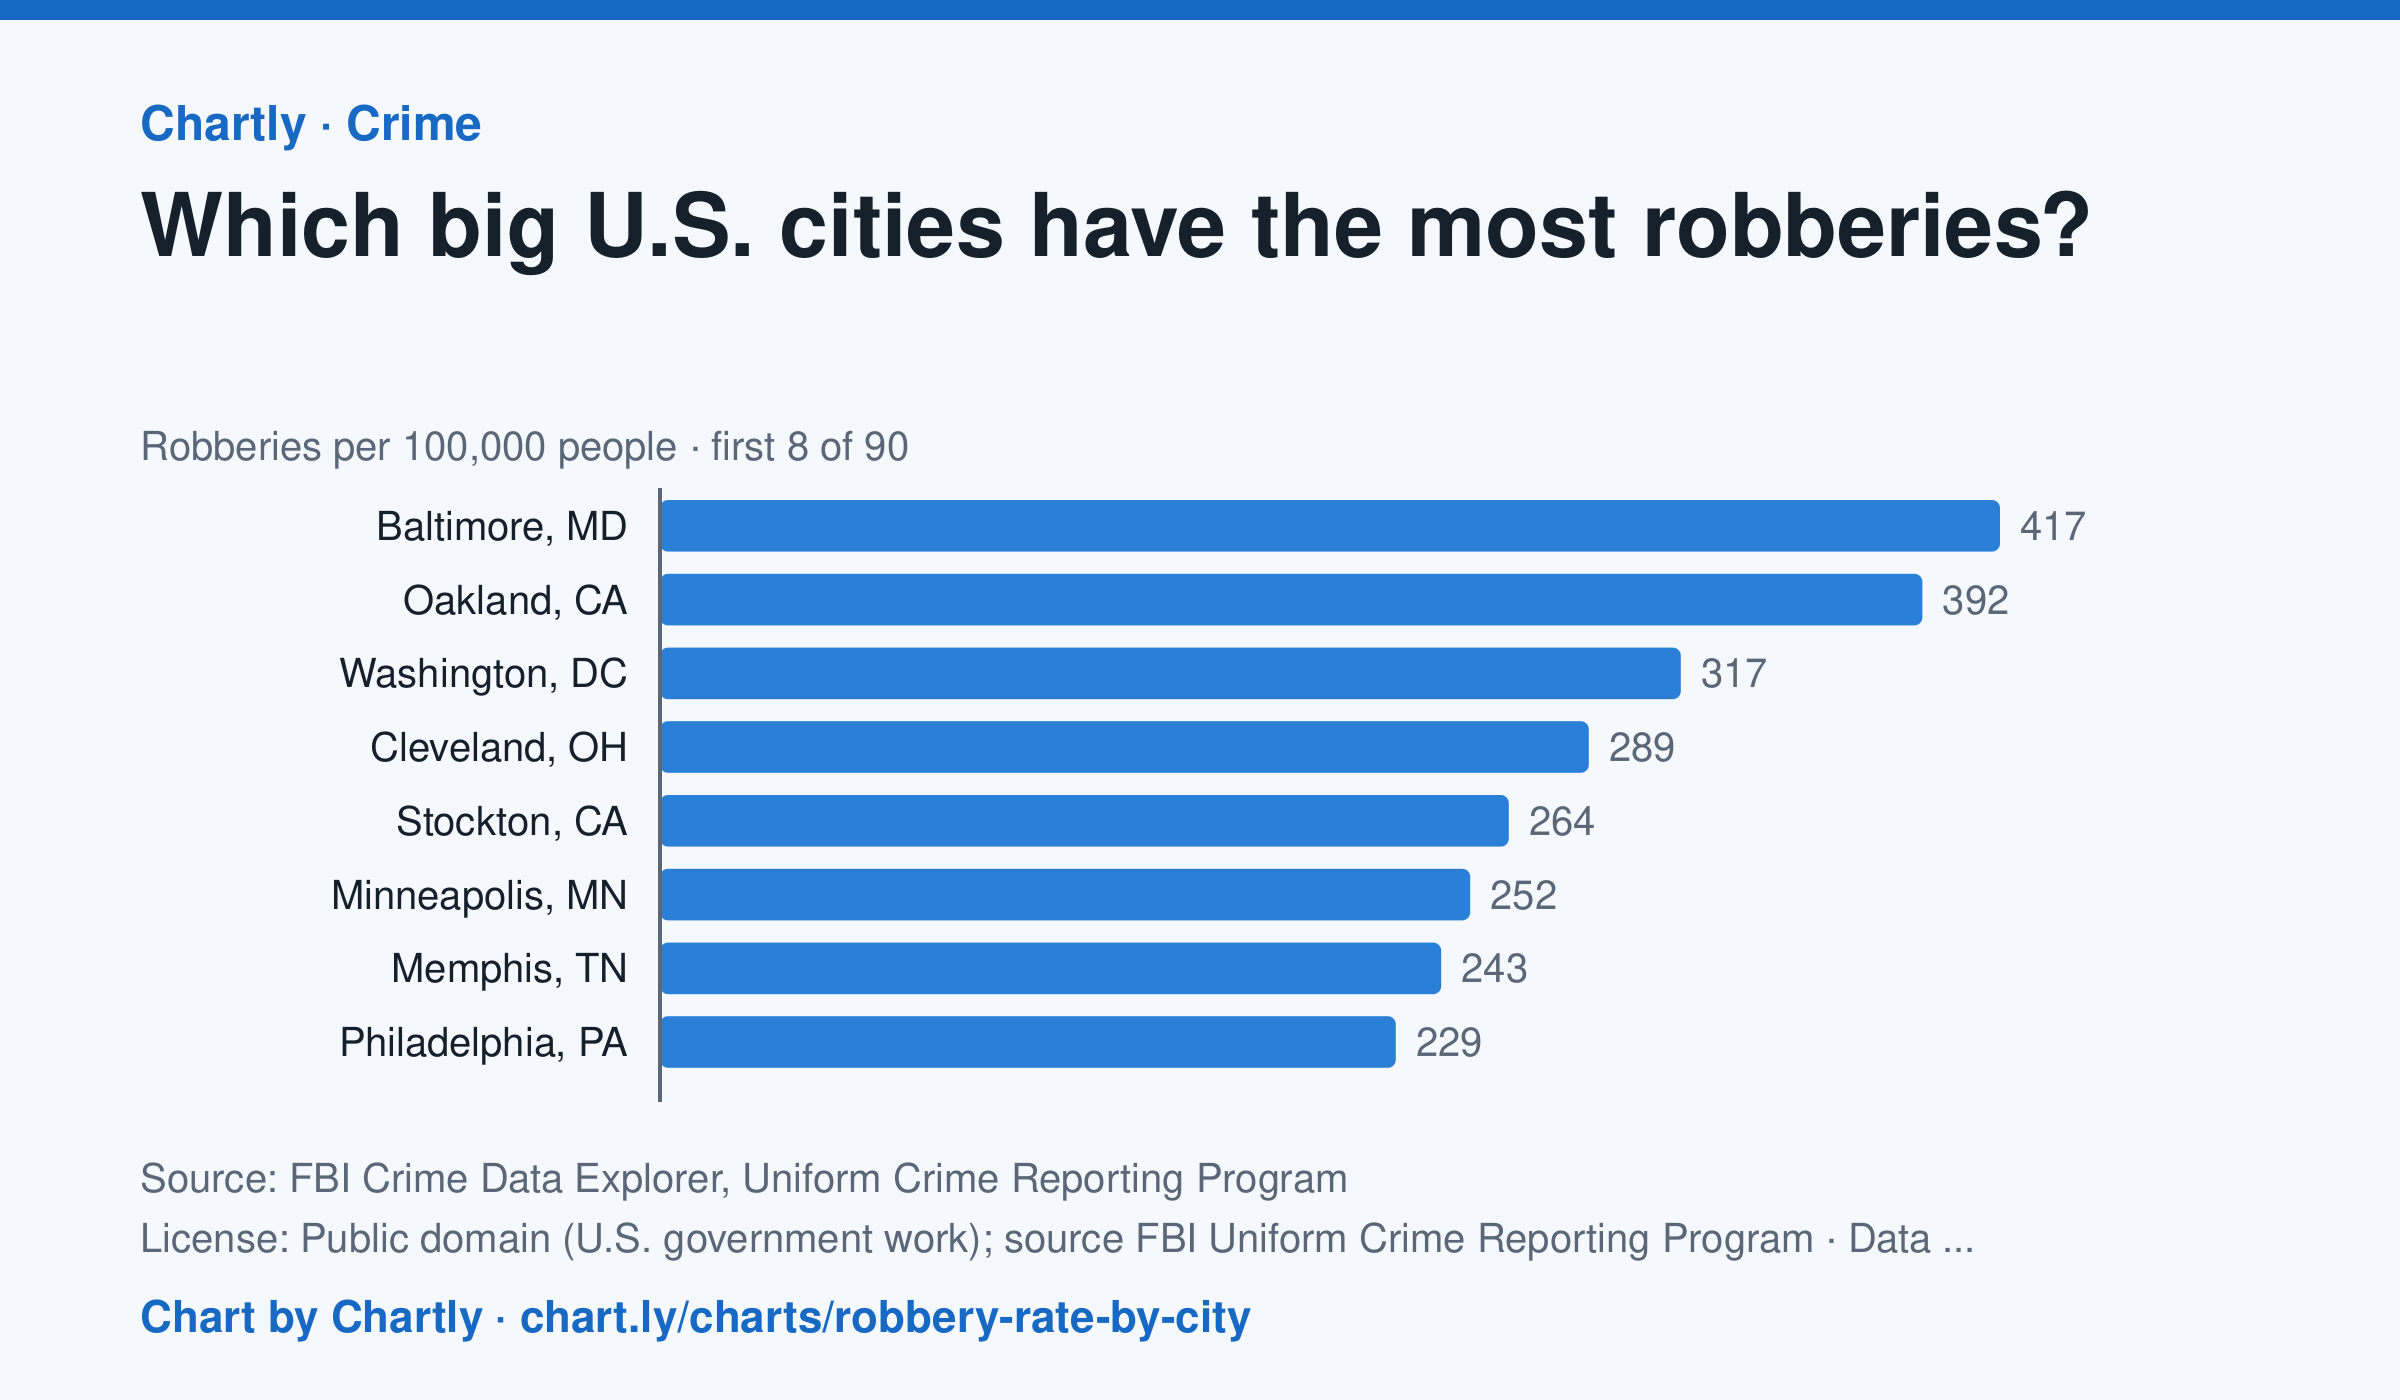
In 2025, Baltimore, MD had the highest robbery rate of the 89 biggest U.S. cities whose police reported a full year to the FBI, about 417 per 100,000 people, followed by Oakland, CA (392) and Washington, DC (317). Gilbert, AZ (8) and Chandler, AZ (15) had the lowest; the U.S. rate was about 50. A robbery is taking something from a person by force or threat of force. Departments that didn't report a full year are left out (for 2025, New Orleans, Orlando and St. Petersburg, Florida). Rates count only crimes reported to police. Each rate is per person the department serves, and a few, such as Las Vegas, Honolulu, Jacksonville and Louisville, serve their whole county. A city's rate also depends on where its borders fall, so compare cities with care.
Source: FBI Crime Data Explorer, Uniform Crime Reporting Program (Public domain (U.S. government work); source FBI Uniform Crime Reporting Program) · Data as of Dec 31, 2025
Questions
- In one sentence of your own, what does this chart show?
- Find the biggest change or difference in the chart. What might explain it?
- Who collected these numbers, and how recent are they? What else would you want to know before drawing a conclusion?
Chart and numbers: chart.ly/charts/robbery-rate-by-city · More free charts at chart.ly
Chart 2 of 3 · Inflation
How fast are US prices rising?
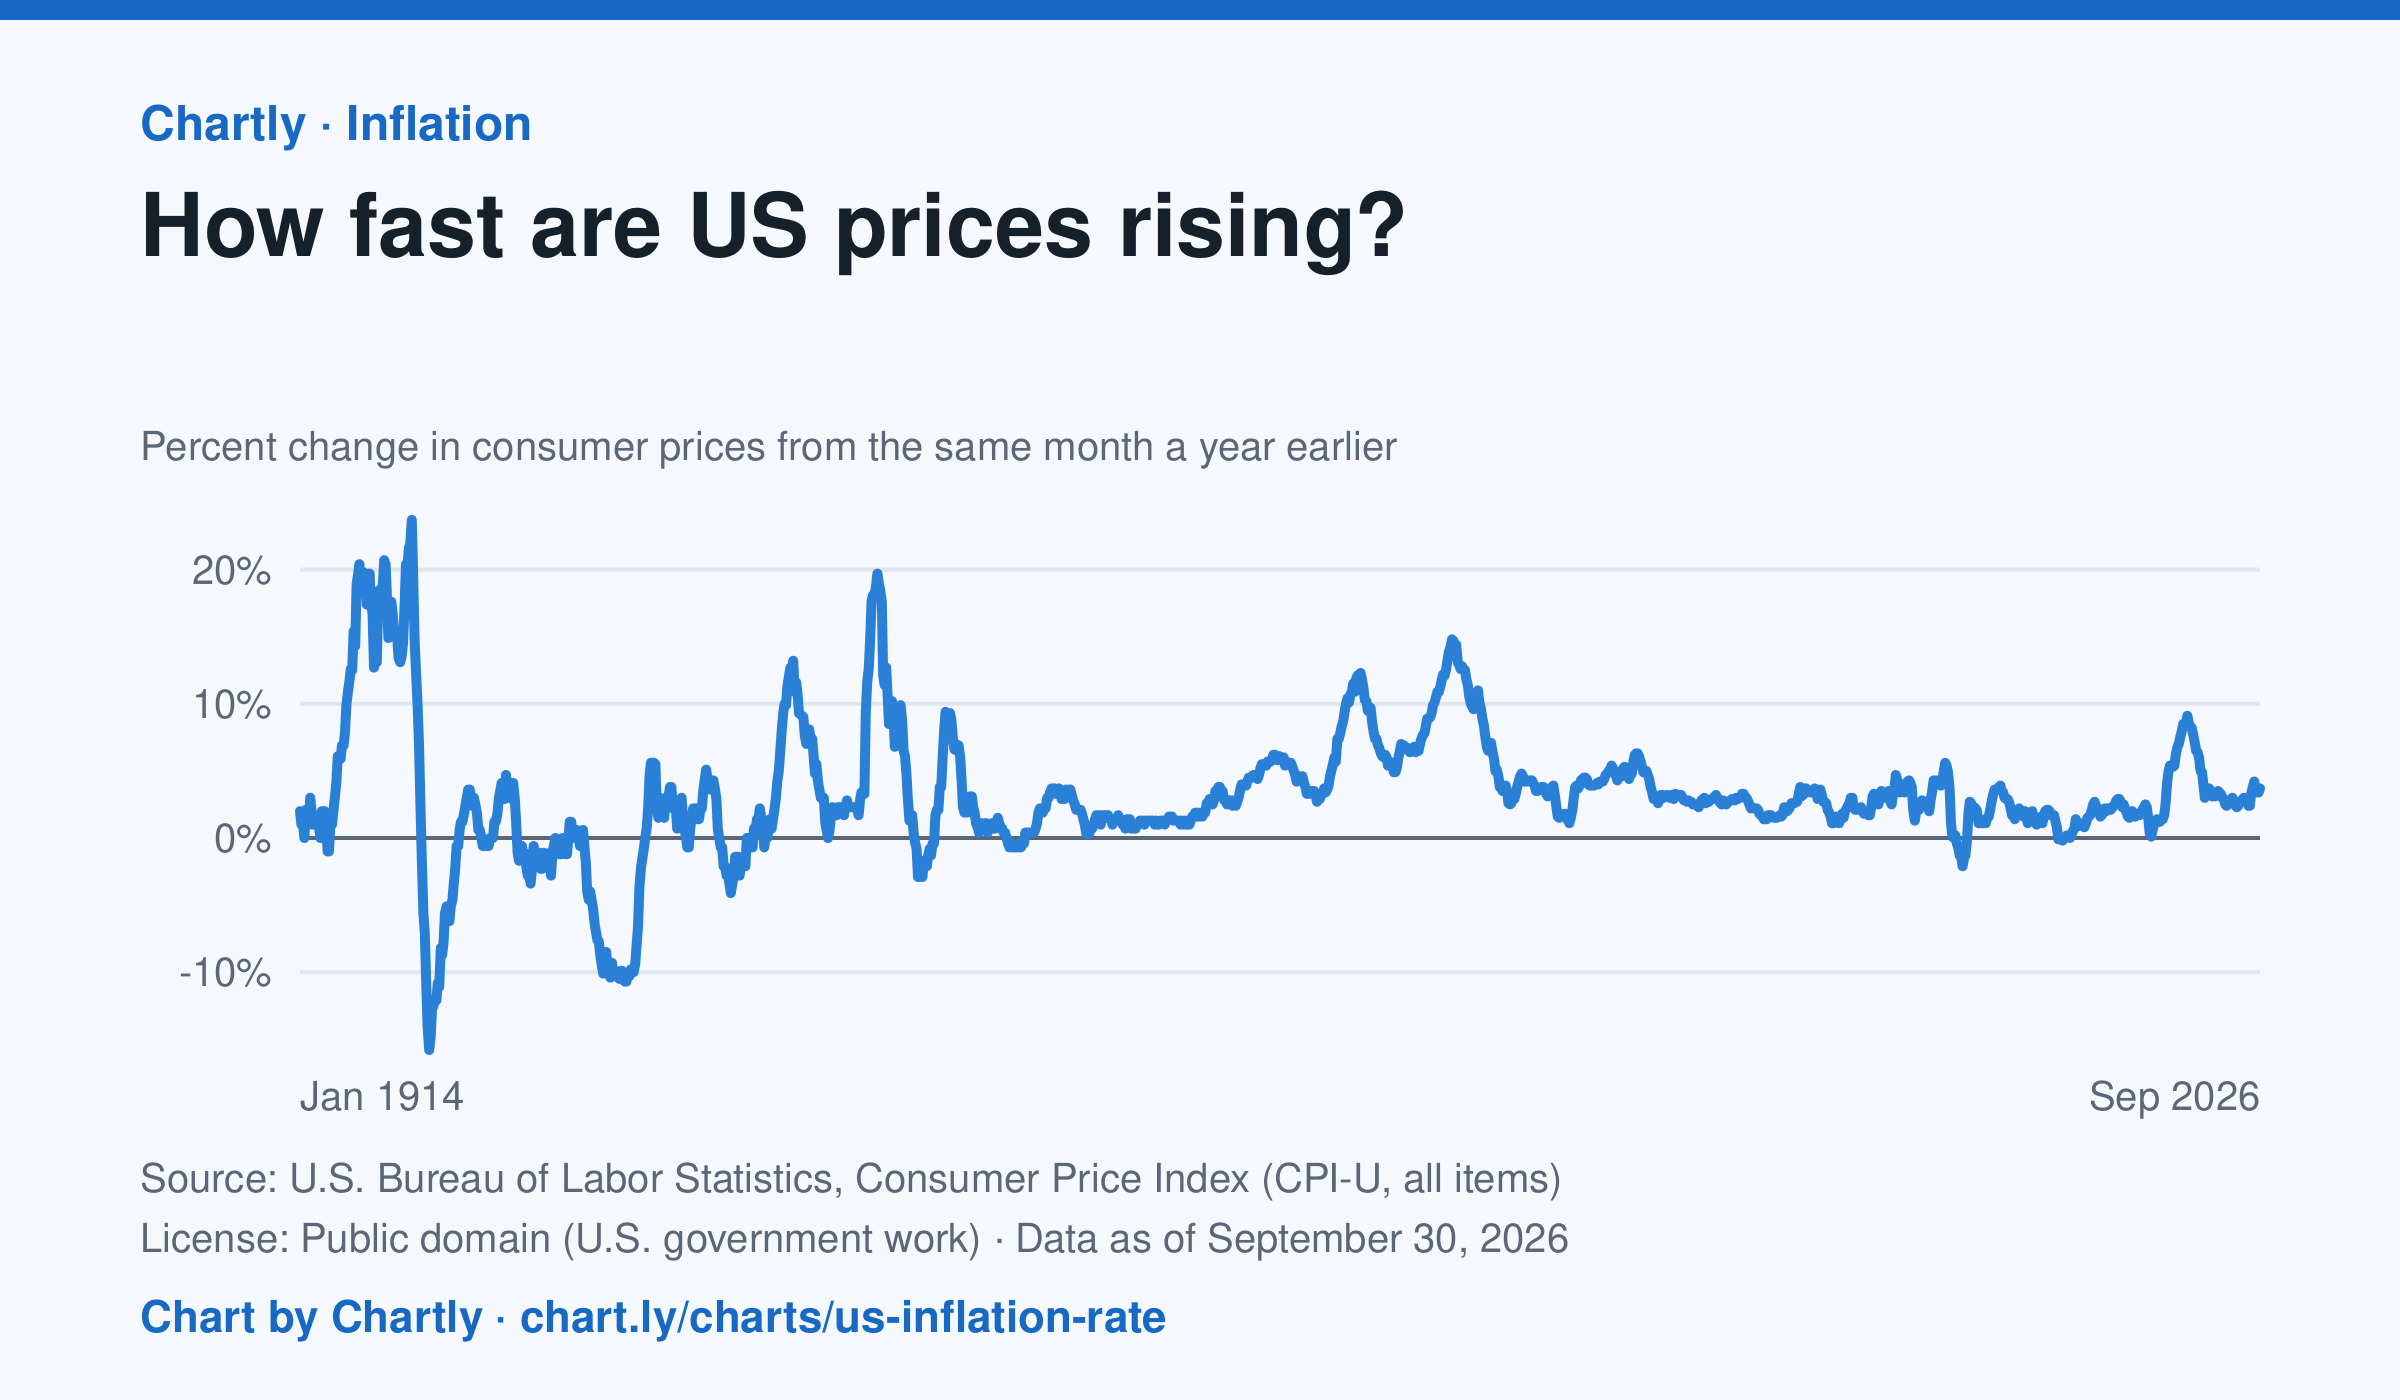
The inflation rate was 3.7% in September 2026: how much consumer prices changed from the same month a year earlier. Each point makes that comparison, back to 1914, the first year BLS can compare. Inflation peaked at 23.7% in June 1920 and at 14.8% in March 1980; the 9.1% of June 2022 was the highest since 1981. Prices fell as fast as 15.8% a year in 1921 and 10.7% in 1932. BLS collected no prices in October 2025, during a lapse in federal funding, so that month and October 2026 are missing.
Source: U.S. Bureau of Labor Statistics, Consumer Price Index (CPI-U, all items) (Public domain (U.S. government work)) · Data as of Sep 30, 2026
How to read this chart
Each point compares consumer prices in a month with the same month a year earlier. A value of 3 means things cost about 3% more than a year before; below zero means prices fell. The chart shows how fast prices change, not how high they are.
Questions
- Find two times when inflation was highest. What was happening in the country then?
- If inflation falls from 8% to 3%, are prices going down, or just rising more slowly?
- Find a stretch when the line is below zero. Why might falling prices be bad news for workers and businesses?
Chart and numbers: chart.ly/charts/us-inflation-rate · More free charts at chart.ly
Chart 3 of 3 · World
How fast has the world come online?
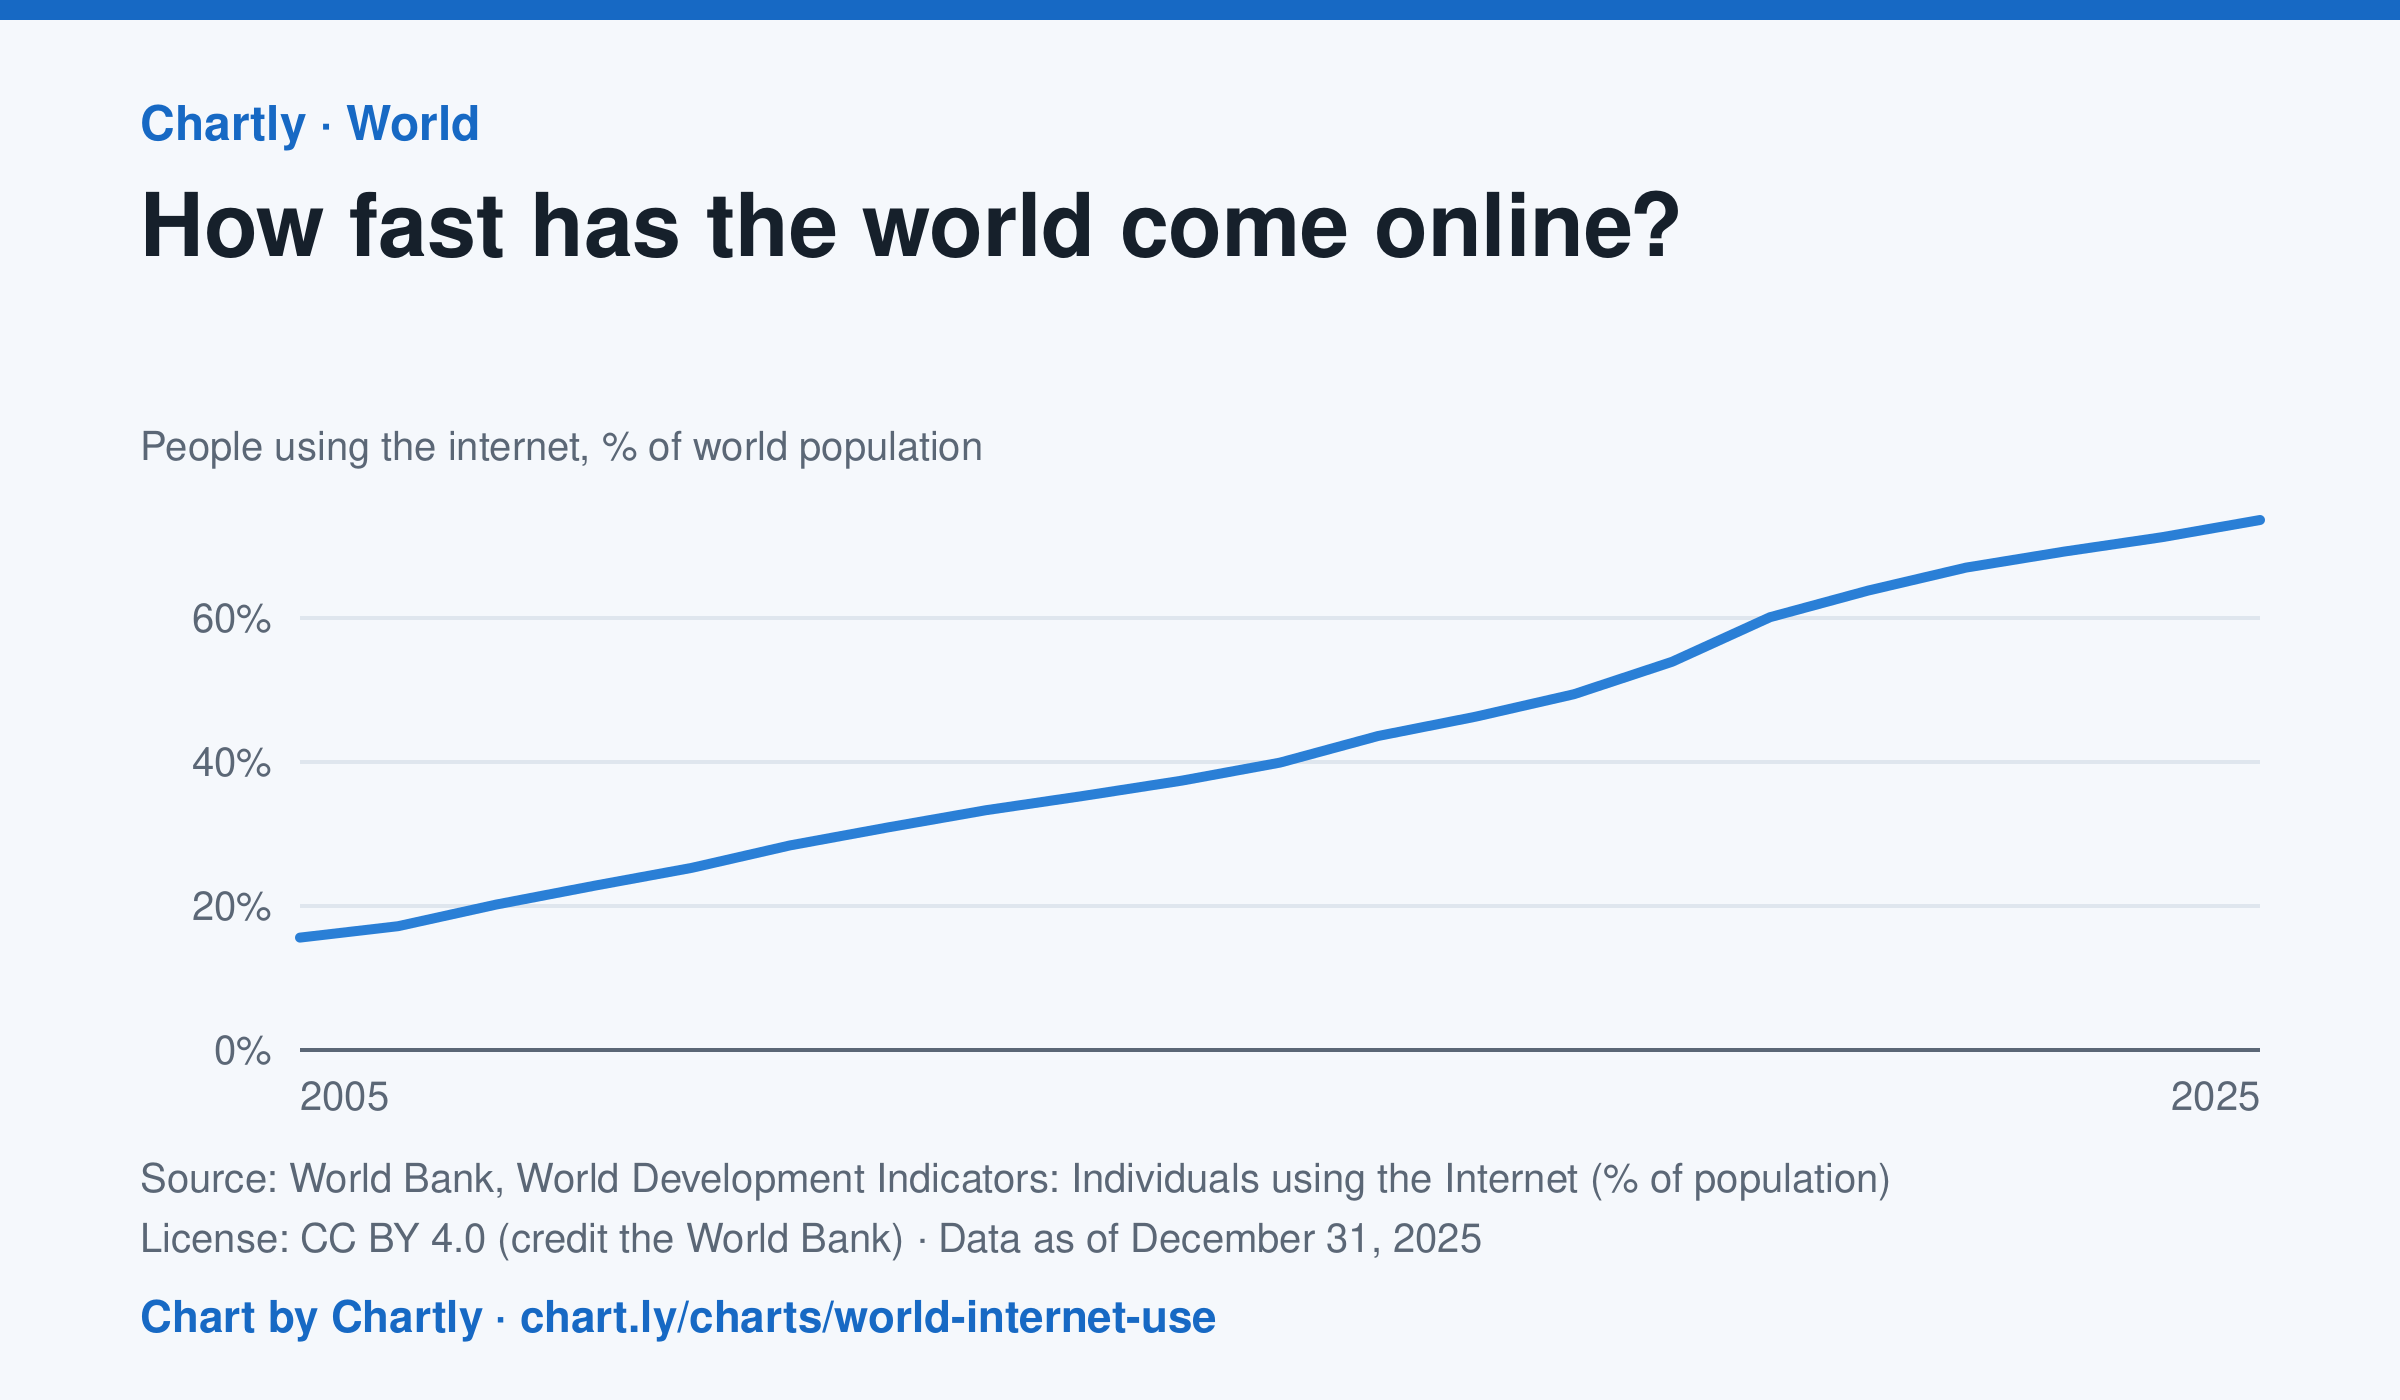
73.6% of the world's people used the internet in 2025, up from 15.6% in 2005, the first year the World Bank gives a world figure. It counts people who used the internet at least once in the previous three months. The world figures are estimates by the International Telecommunication Union.
Source: World Bank, World Development Indicators: Individuals using the Internet (% of population) (CC BY 4.0 (credit the World Bank)) · Data as of Dec 31, 2025
How to read this chart
Each point is the share of the world's people who used the internet at least once in the previous three months, as estimated by the International Telecommunication Union. The axis starts at zero, so the height shows the true share. The steeper the line, the faster people were coming online.
Questions
- About what share of the world was online in the first year on the chart, and in the latest year?
- Did the share grow faster in some years than others? What could have sped it up?
- Using the internet once in three months counts here. What does this number leave out about how people get online?
Chart and numbers: chart.ly/charts/world-internet-use · More free charts at chart.ly