Print this worksheet, or choose "Save as PDF" in the print window to share a file.
Chart worksheet
Charts to read and discuss
Name:
Class:
Date:
Chart 1 of 2 · Crime
Which big U.S. cities have the most robberies?
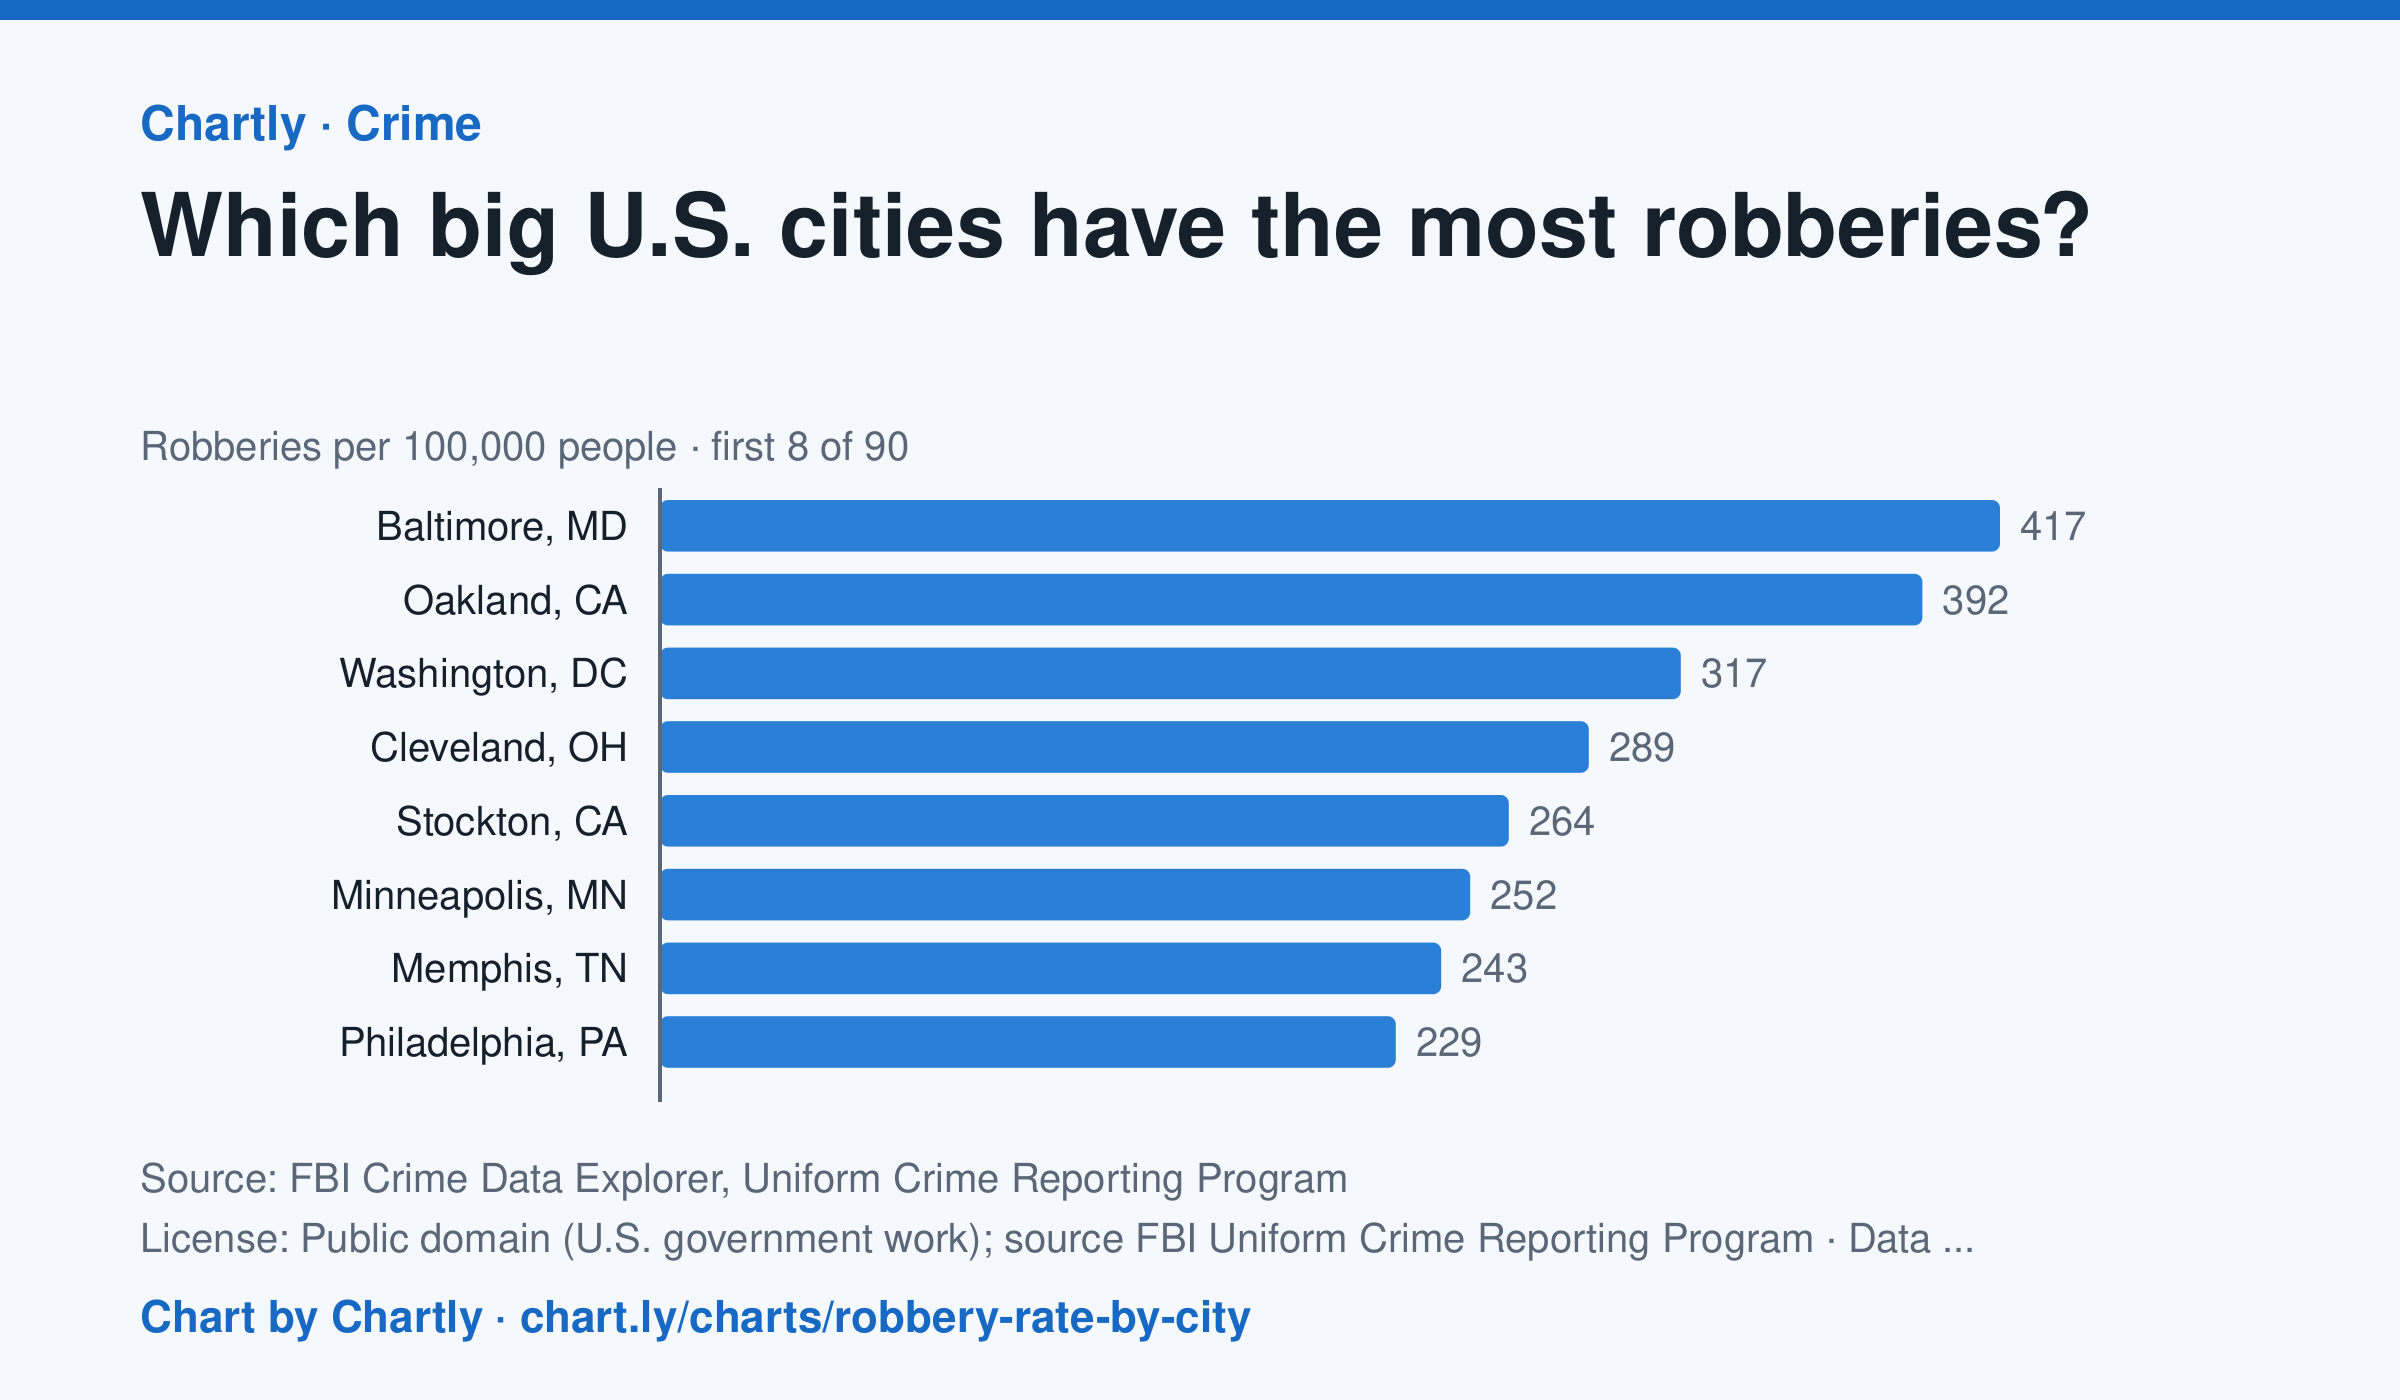
In 2025, Baltimore, MD had the highest robbery rate of the 89 biggest U.S. cities whose police reported a full year to the FBI, about 417 per 100,000 people, followed by Oakland, CA (392) and Washington, DC (317). Gilbert, AZ (8) and Chandler, AZ (15) had the lowest; the U.S. rate was about 50. A robbery is taking something from a person by force or threat of force. Departments that didn't report a full year are left out (for 2025, New Orleans, Orlando and St. Petersburg, Florida). Rates count only crimes reported to police. Each rate is per person the department serves, and a few, such as Las Vegas, Honolulu, Jacksonville and Louisville, serve their whole county. A city's rate also depends on where its borders fall, so compare cities with care.
Source: FBI Crime Data Explorer, Uniform Crime Reporting Program (Public domain (U.S. government work); source FBI Uniform Crime Reporting Program) · Data as of Dec 31, 2025
Questions
- In one sentence of your own, what does this chart show?
- Find the biggest change or difference in the chart. What might explain it?
- Who collected these numbers, and how recent are they? What else would you want to know before drawing a conclusion?
Chart and numbers: chart.ly/charts/robbery-rate-by-city · More free charts at chart.ly
Chart 2 of 2 · World
How much does each country spend on health care per person?
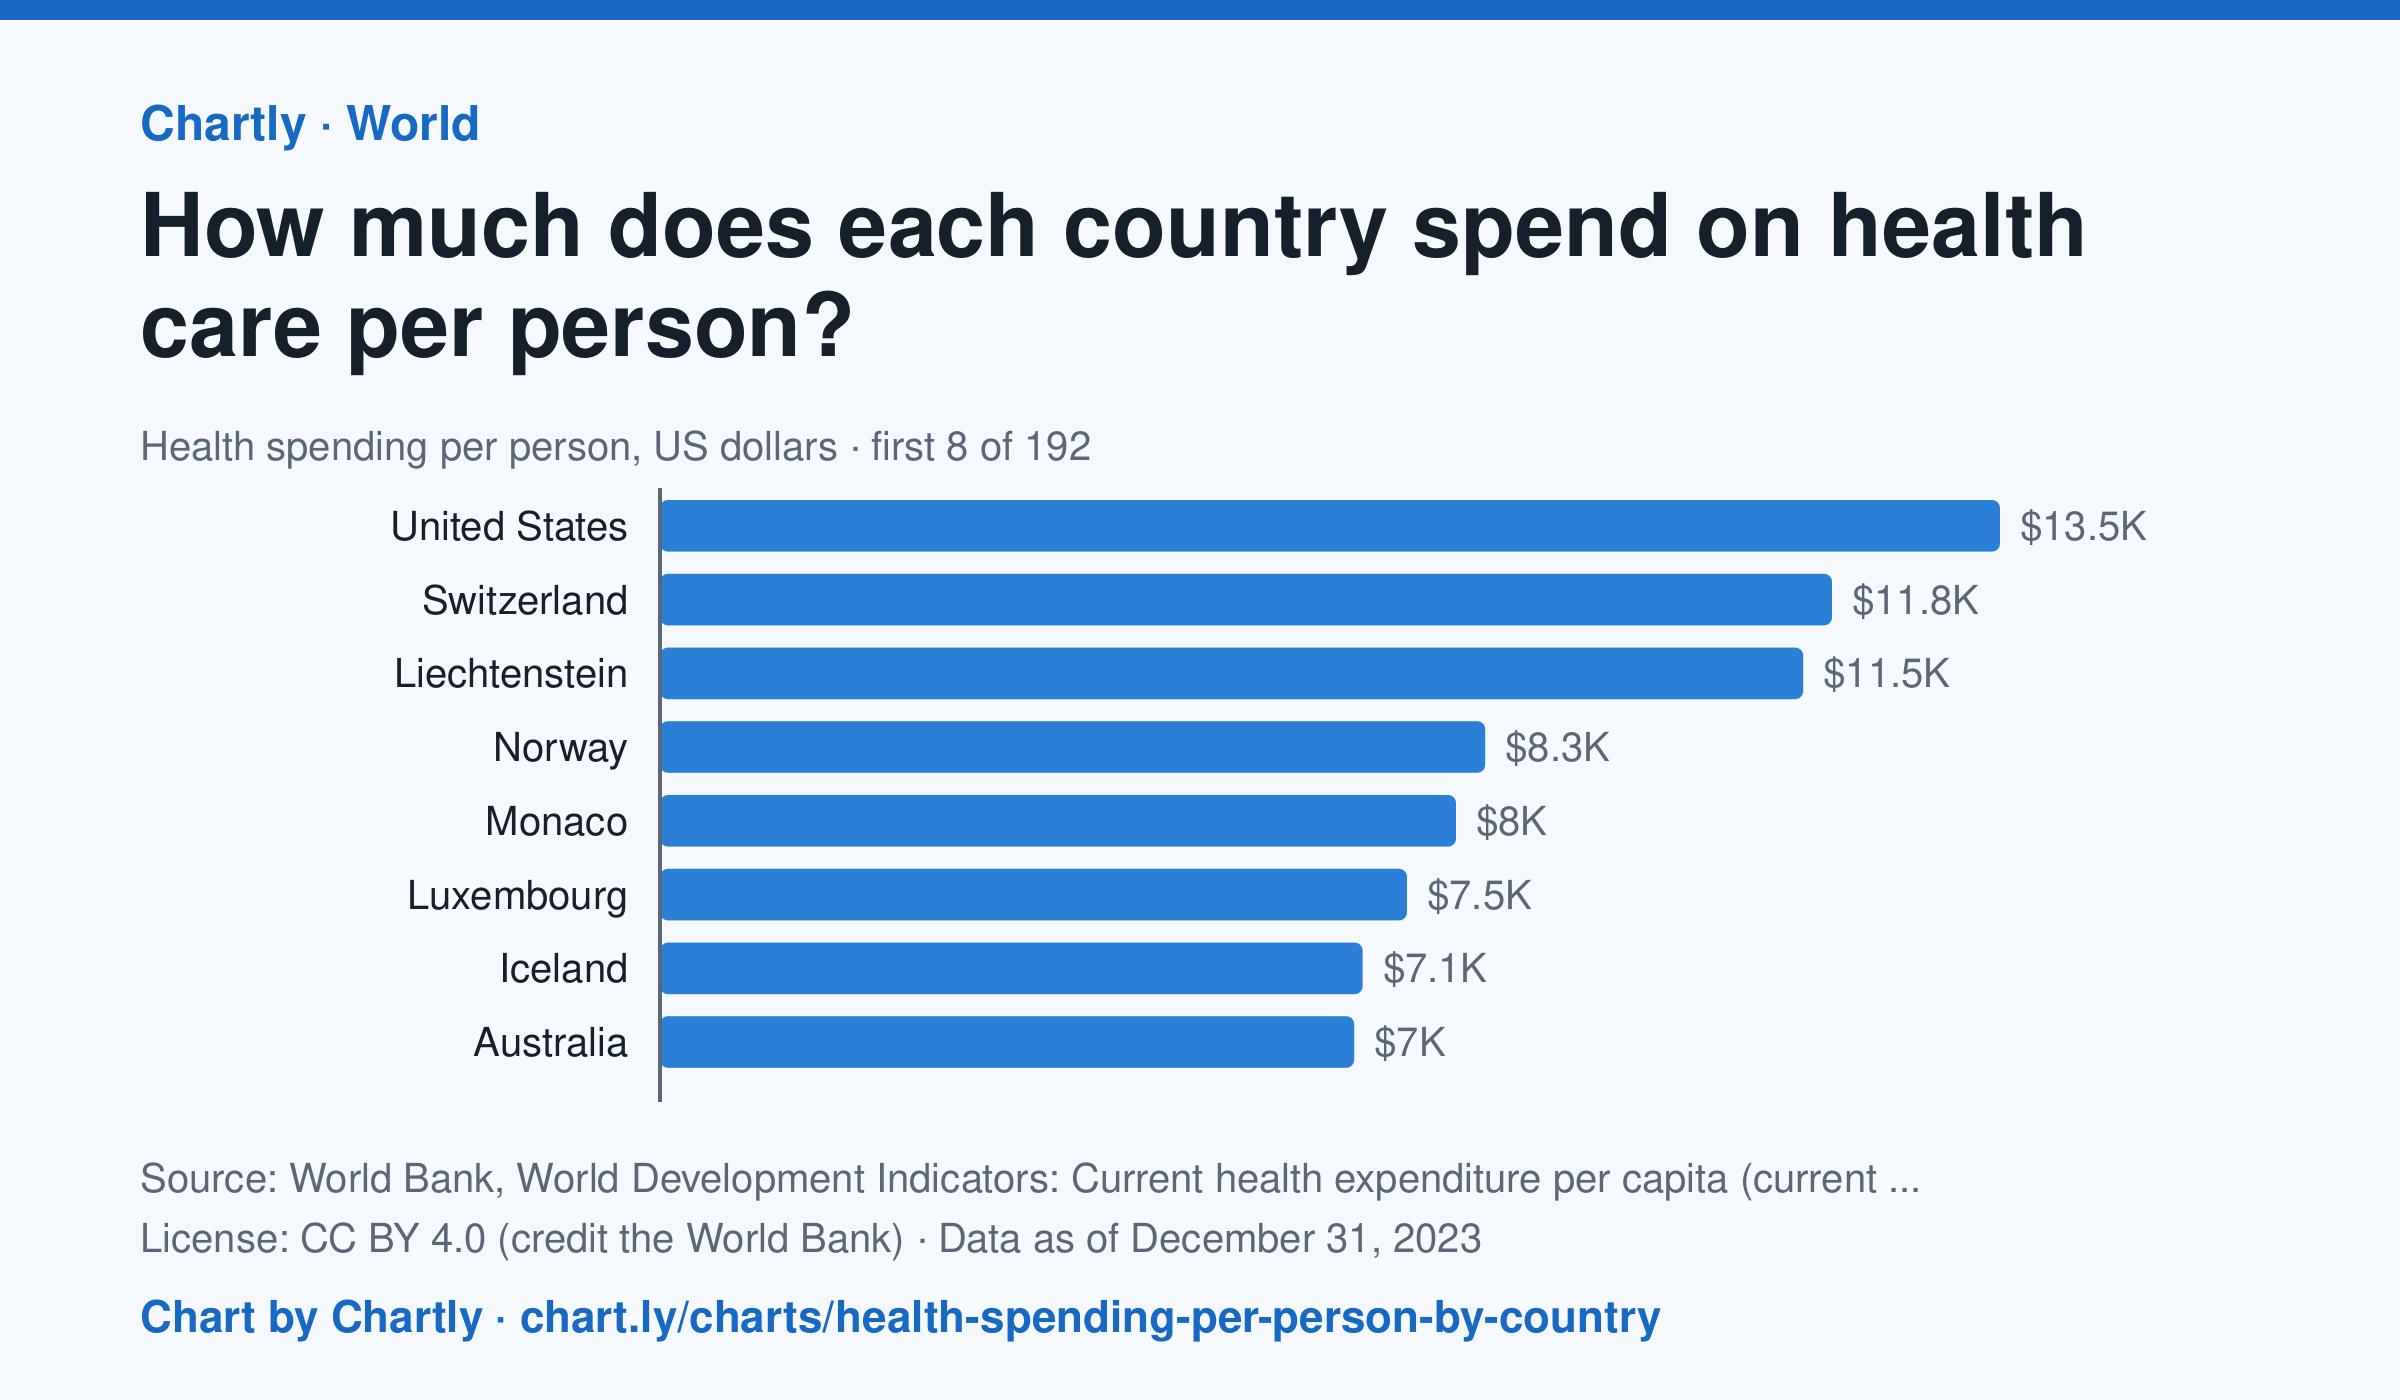
In 2023, the United States spent $13,473 per person on health care, about 10 times the world figure of $1,317. Germany spent $6,395, Japan $3,638, China $763 and India $85; Madagascar spent the least, $17. Search 191 countries and territories. Spending counts what governments, insurers and households paid for health care, but not new hospitals or equipment, in US dollars at each year's exchange rates, not adjusted for differences in prices.
Source: World Bank, World Development Indicators: Current health expenditure per capita (current US$) (CC BY 4.0 (credit the World Bank)) · Data as of Dec 31, 2023
How to read this chart
Each bar is what a country spent on health care in a year, by governments, insurers and households together, divided by its population and turned into U.S. dollars. The dashed line is the world. The figures aren't adjusted for prices, so a dollar buys more care in some countries than others.
Questions
- About how many times the world figure does the United States spend per person?
- Does spending more on health care per person always mean people live longer? What other chart on Chartly could help you check?
- Doctors and nurses are paid less in some countries. How would that change what these dollar figures can tell you?
Chart and numbers: chart.ly/charts/health-spending-per-person-by-country · More free charts at chart.ly