Print this worksheet, or choose "Save as PDF" in the print window to share a file.
Chart worksheet
Charts to read and discuss
Name:
Class:
Date:
Chart 1 of 2 · Crime
Which big U.S. cities have the most property crime?
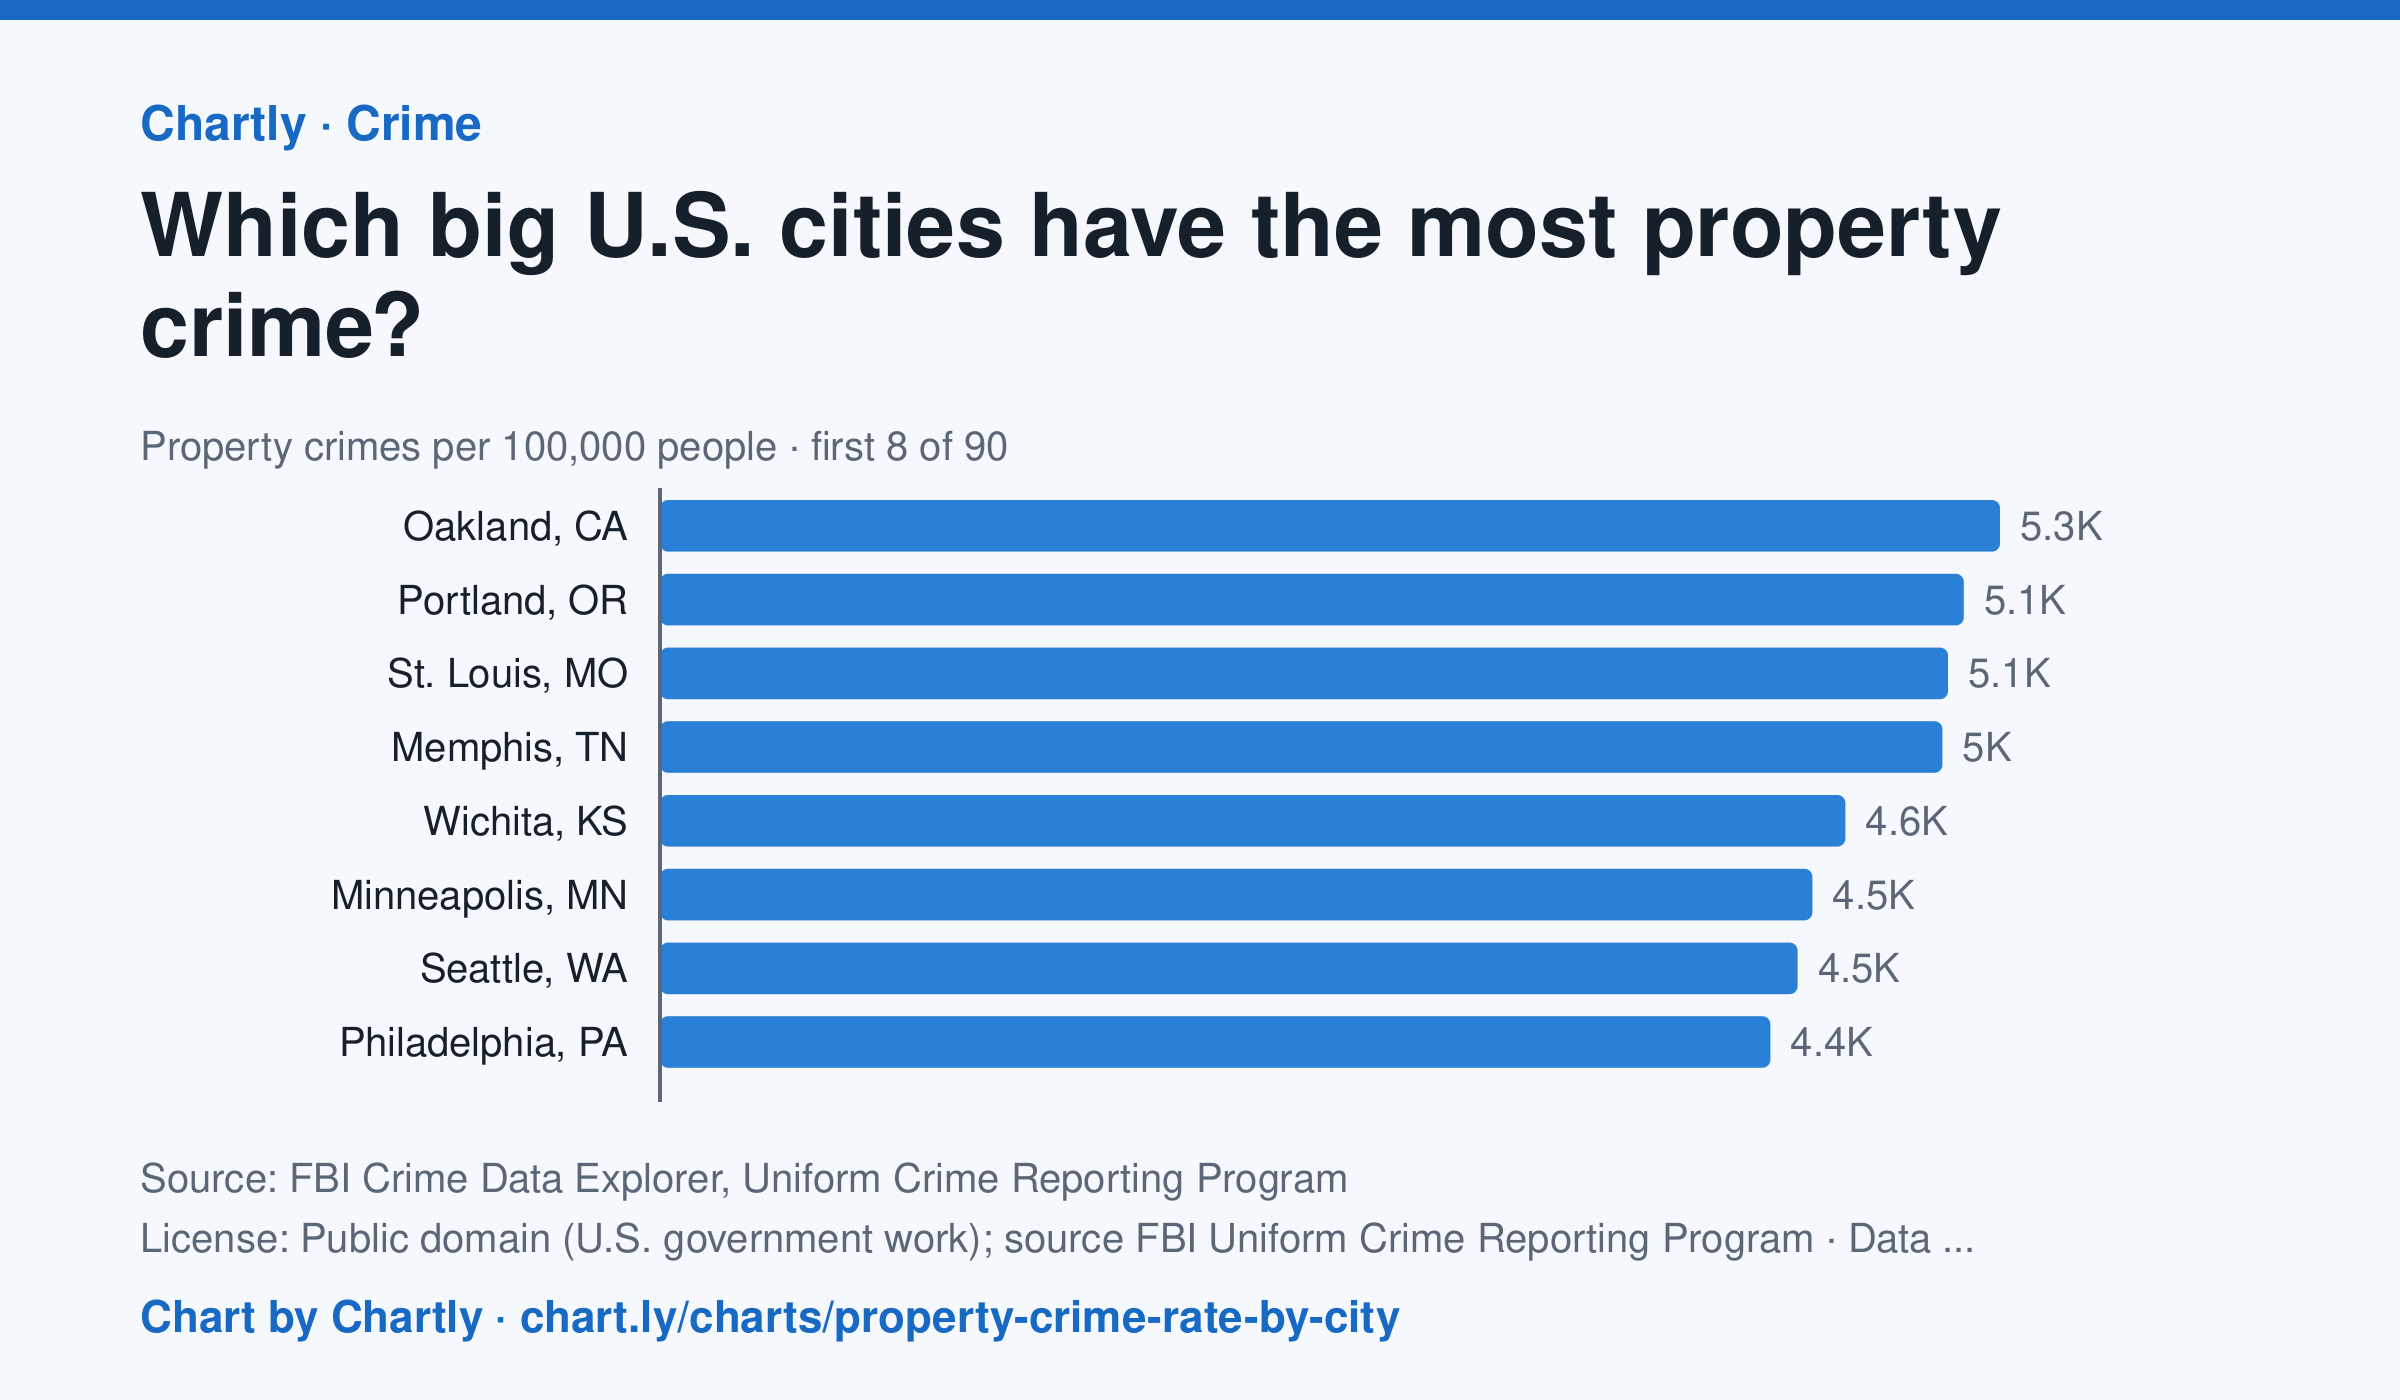
In 2025, Oakland, CA had the highest property crime rate of the 89 biggest U.S. cities whose police reported a full year to the FBI, about 5,255 per 100,000 people, followed by Portland, OR (5,113) and St. Louis, MO (5,051). Gilbert, AZ (878) and Tampa, FL (991) had the lowest; the U.S. rate was about 1,552. Property crime is burglary, theft, car theft and arson. Departments that didn't report a full year are left out (for 2025, New Orleans, Orlando and St. Petersburg, Florida). Rates count only crimes reported to police. Each rate is per person the department serves, and a few, such as Las Vegas, Honolulu, Jacksonville and Louisville, serve their whole county. A city's rate also depends on where its borders fall, so compare cities with care.
Source: FBI Crime Data Explorer, Uniform Crime Reporting Program (Public domain (U.S. government work); source FBI Uniform Crime Reporting Program) · Data as of Dec 31, 2025
Questions
- In one sentence of your own, what does this chart show?
- Find the biggest change or difference in the chart. What might explain it?
- Who collected these numbers, and how recent are they? What else would you want to know before drawing a conclusion?
Chart and numbers: chart.ly/charts/property-crime-rate-by-city · More free charts at chart.ly
Chart 2 of 2 · Income and poverty
What is the typical household income in each state?
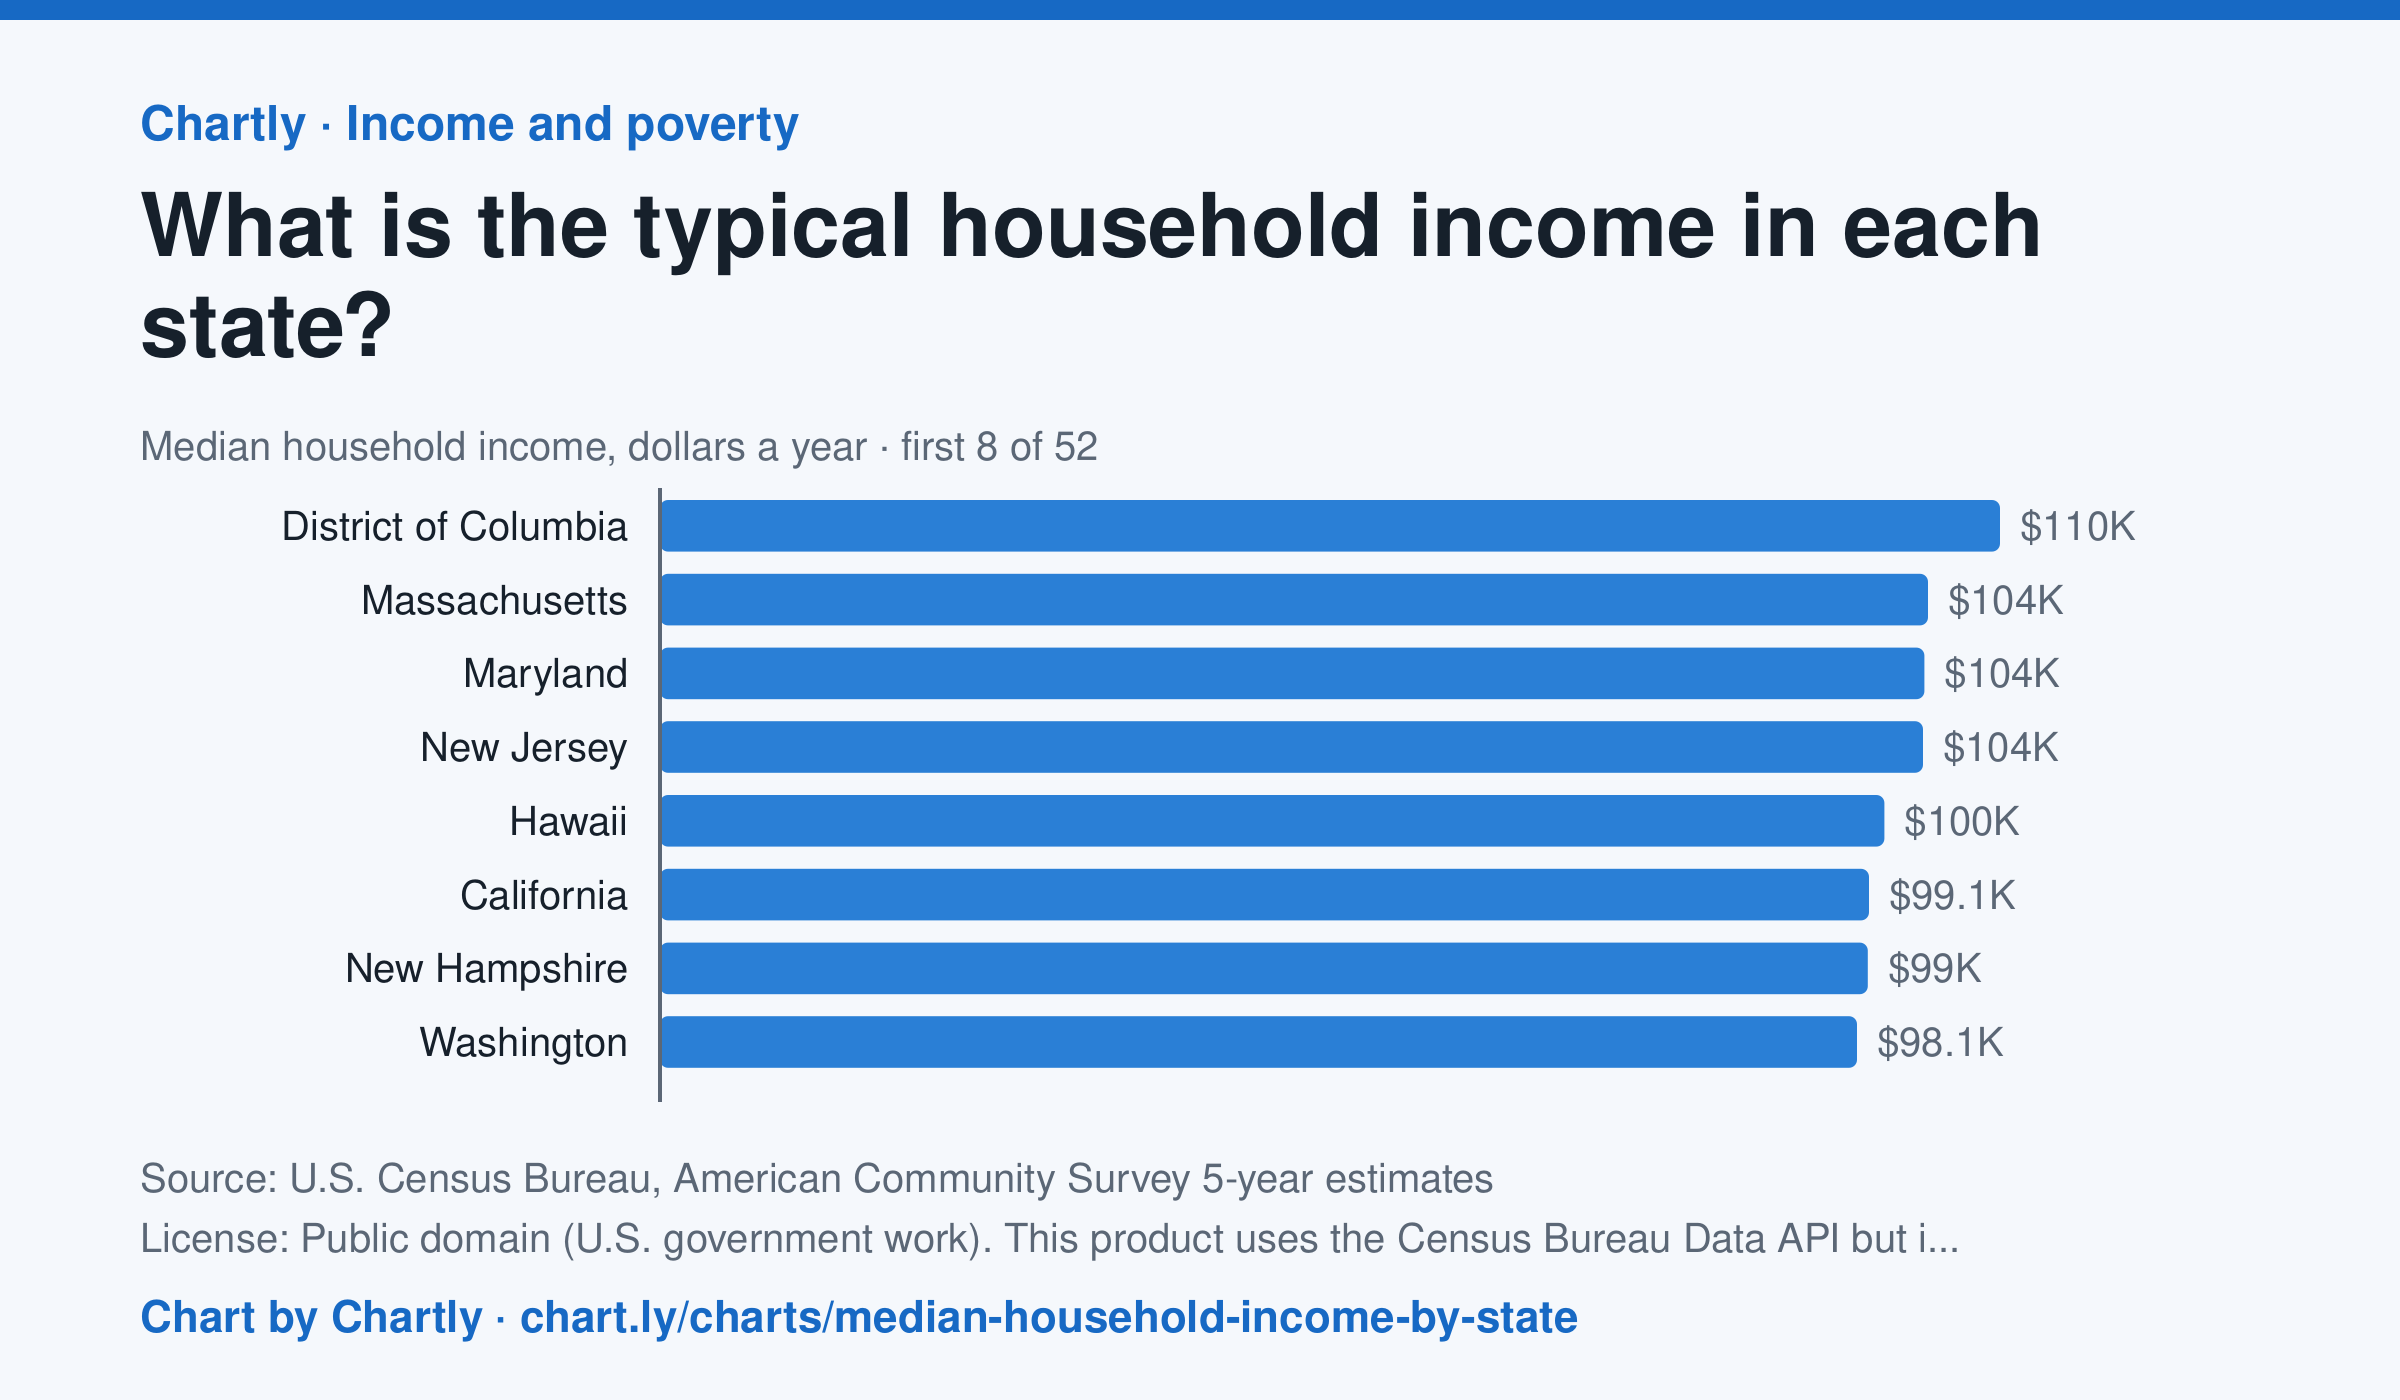
In the Census Bureau's 5-year survey ending in 2024, the typical household in District of Columbia earned $109,870 a year, the most, followed by Massachusetts ($103,960) and Maryland ($103,678). Mississippi was lowest at $56,447, and the U.S. median was $80,734. These are 5-year estimates in 2024 dollars, each with a margin of error.
Source: U.S. Census Bureau, American Community Survey 5-year estimates (Public domain (U.S. government work). This product uses the Census Bureau Data API but is not endorsed or certified by the Census Bureau.) · Data as of Dec 31, 2024
How to read this chart
Each bar is the median household income in a state: half of households earn more and half earn less. The dashed line is the whole U.S., for comparison. These are survey estimates, and each has a margin of error: the true value is likely within that range, so states with overlapping ranges may not really differ.
Questions
- Find your state. Is it above or below the U.S. median, and by about how much?
- Why do statisticians often use the median instead of the average (mean) for income?
- Housing and groceries cost more in some states. What would you need to know to compare what these incomes can buy?
Chart and numbers: chart.ly/charts/median-household-income-by-state · More free charts at chart.ly