Print this worksheet, or choose "Save as PDF" in the print window to share a file.
Chart worksheet
AP Statistics chart assignment
Name:
Class:
Date:
Chart 1 of 1 · Crime
Which big U.S. cities have the highest murder rates?
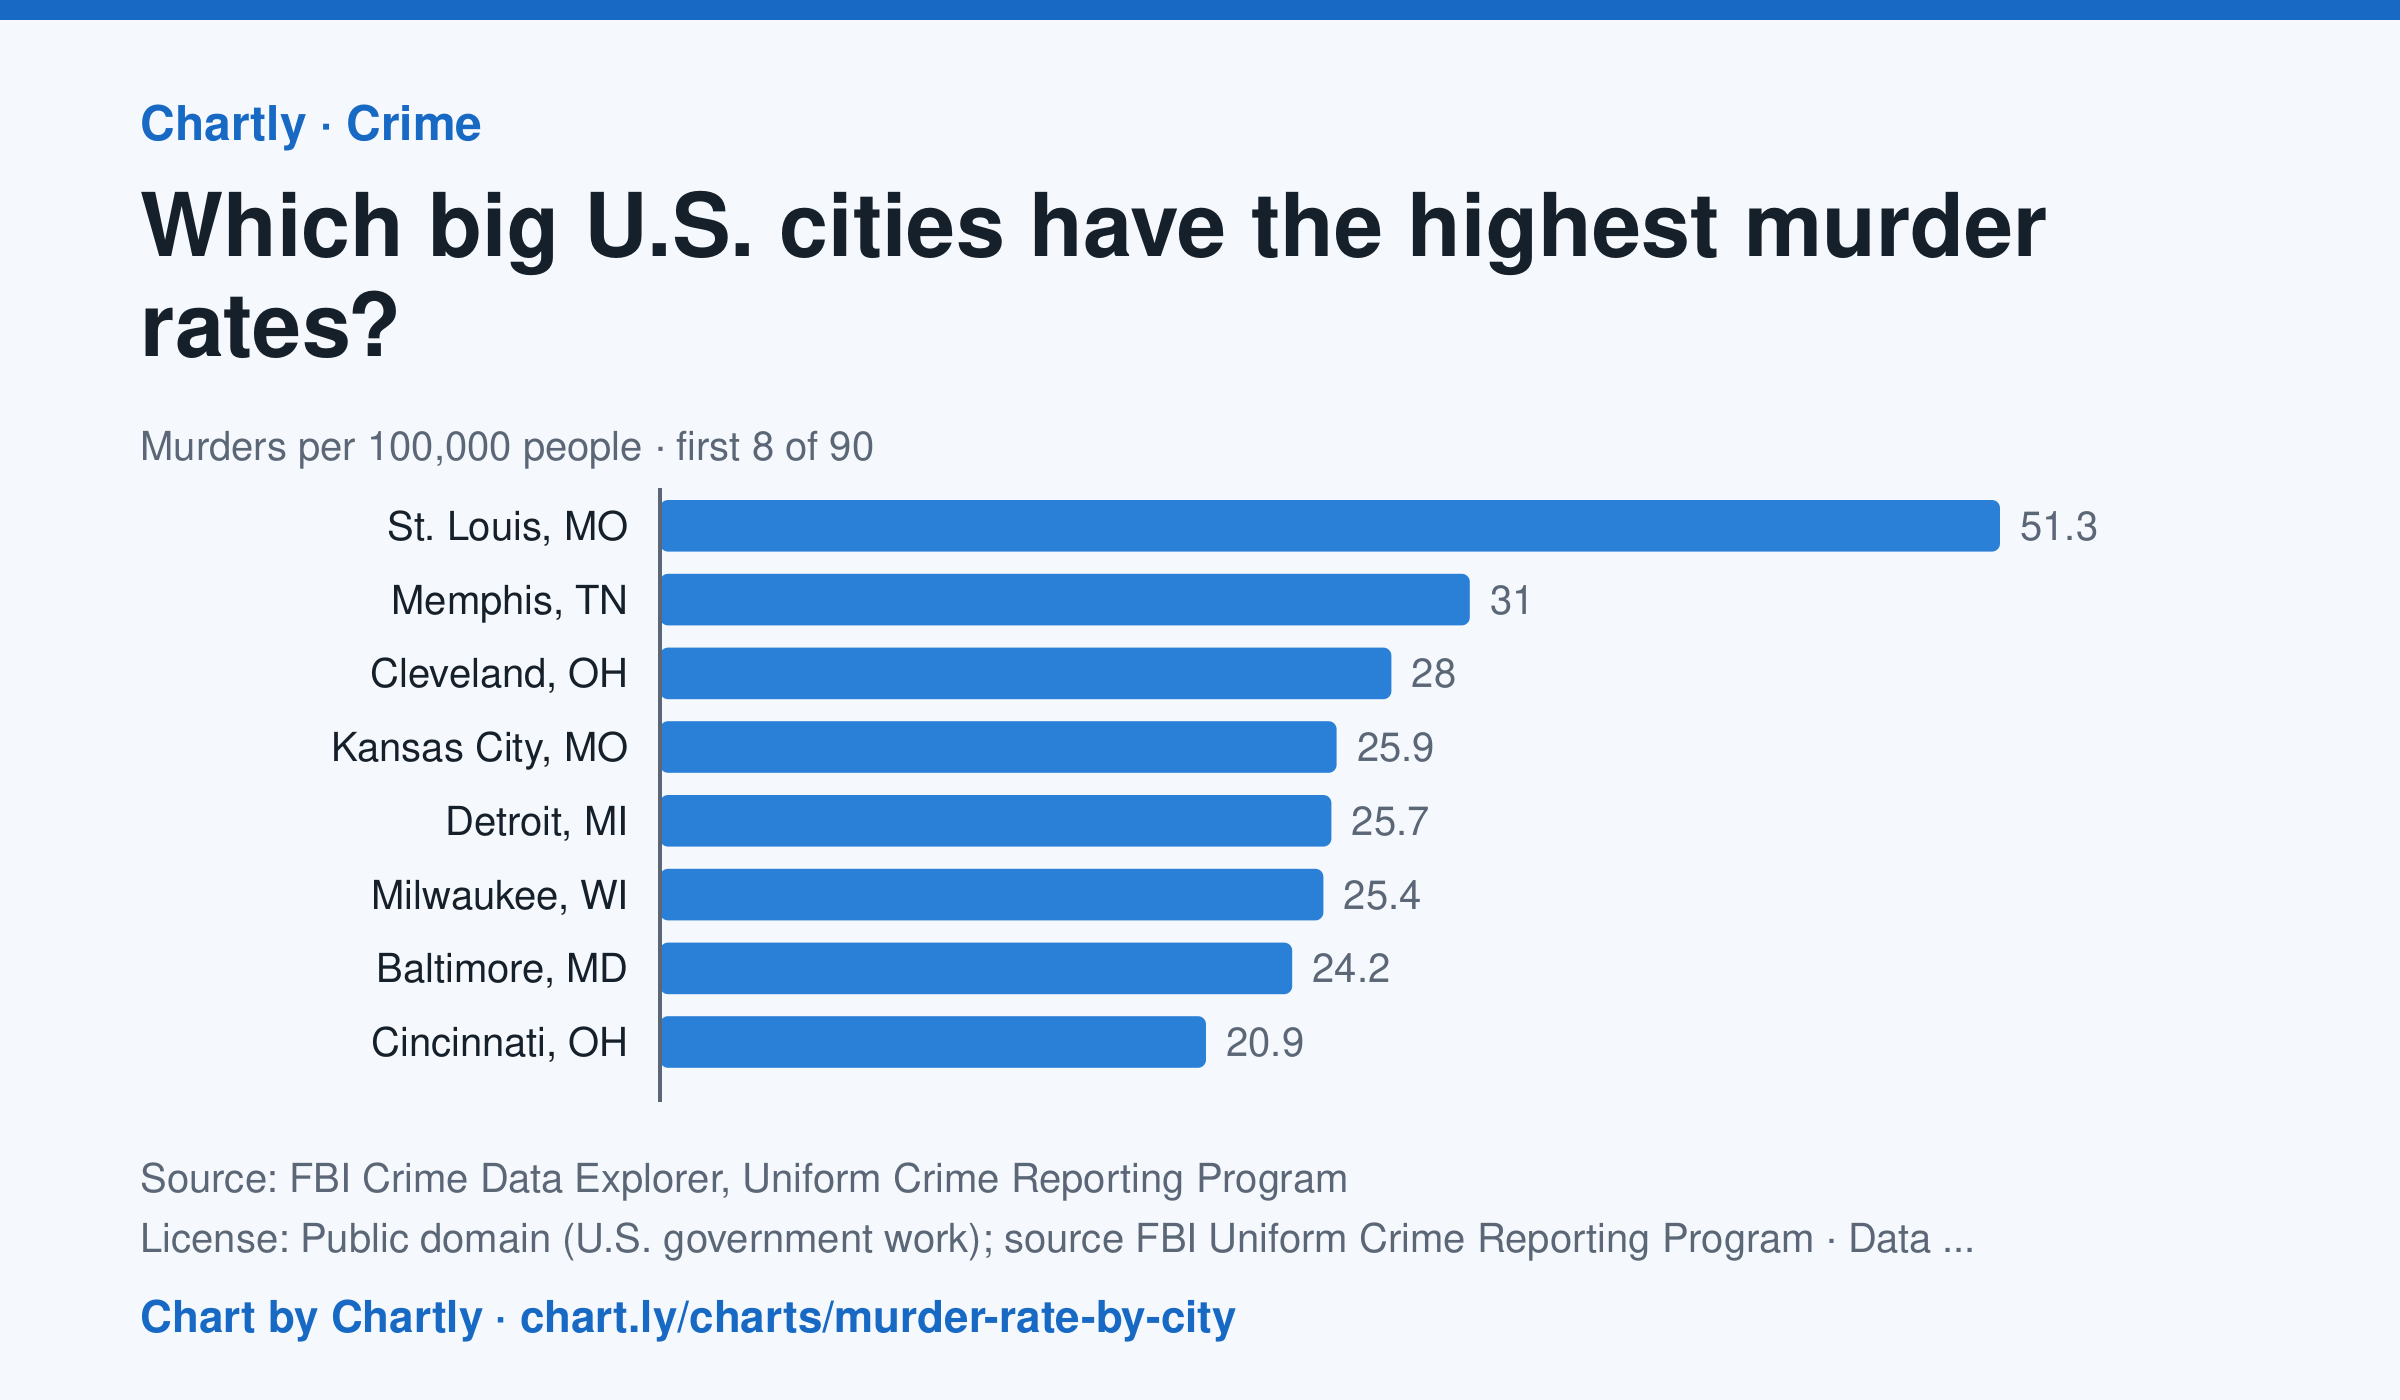
In 2025 St. Louis, MO had the highest murder rate of the 89 biggest U.S. cities whose police reported a full year to the FBI, about 51.3 per 100,000 people, followed by Memphis, TN (31.0) and Cleveland, OH (28.0). Irvine, CA (0.0) and Plano, TX (0.7) had the lowest; the U.S. rate was about 4.4. Departments that didn't report a full year are left out (for 2025, New Orleans, Orlando and St. Petersburg, Florida). Each rate is per person the department serves, and a few, such as Las Vegas, Honolulu, Jacksonville and Louisville, serve their whole county. A city's rate also depends on where its borders fall, so compare cities with care.
Source: FBI Crime Data Explorer, Uniform Crime Reporting Program (Public domain (U.S. government work); source FBI Uniform Crime Reporting Program) · Data as of Dec 31, 2025
How to read this chart
Each bar is the number of murders in a city in one year for every 100,000 people its police department serves. The dashed line is the U.S. rate. Murders are rare, so in a smaller city a handful more or fewer in one year can move its rate and its rank a lot.
Questions
- How many cities on the chart have a murder rate above the U.S. rate, and how many are below it?
- Why does a chart like this use murders per 100,000 people instead of the total number of murders in each city?
- A city's rank can jump from one year to the next. Why might small numbers make rates bounce around?
Chart and numbers: chart.ly/charts/murder-rate-by-city · More free charts at chart.ly