Print this worksheet, or choose "Save as PDF" in the print window to share a file.
Chart worksheet
Charts to read and discuss
Name:
Class:
Date:
Chart 1 of 2 · Wealth
What is the median household net worth by age?
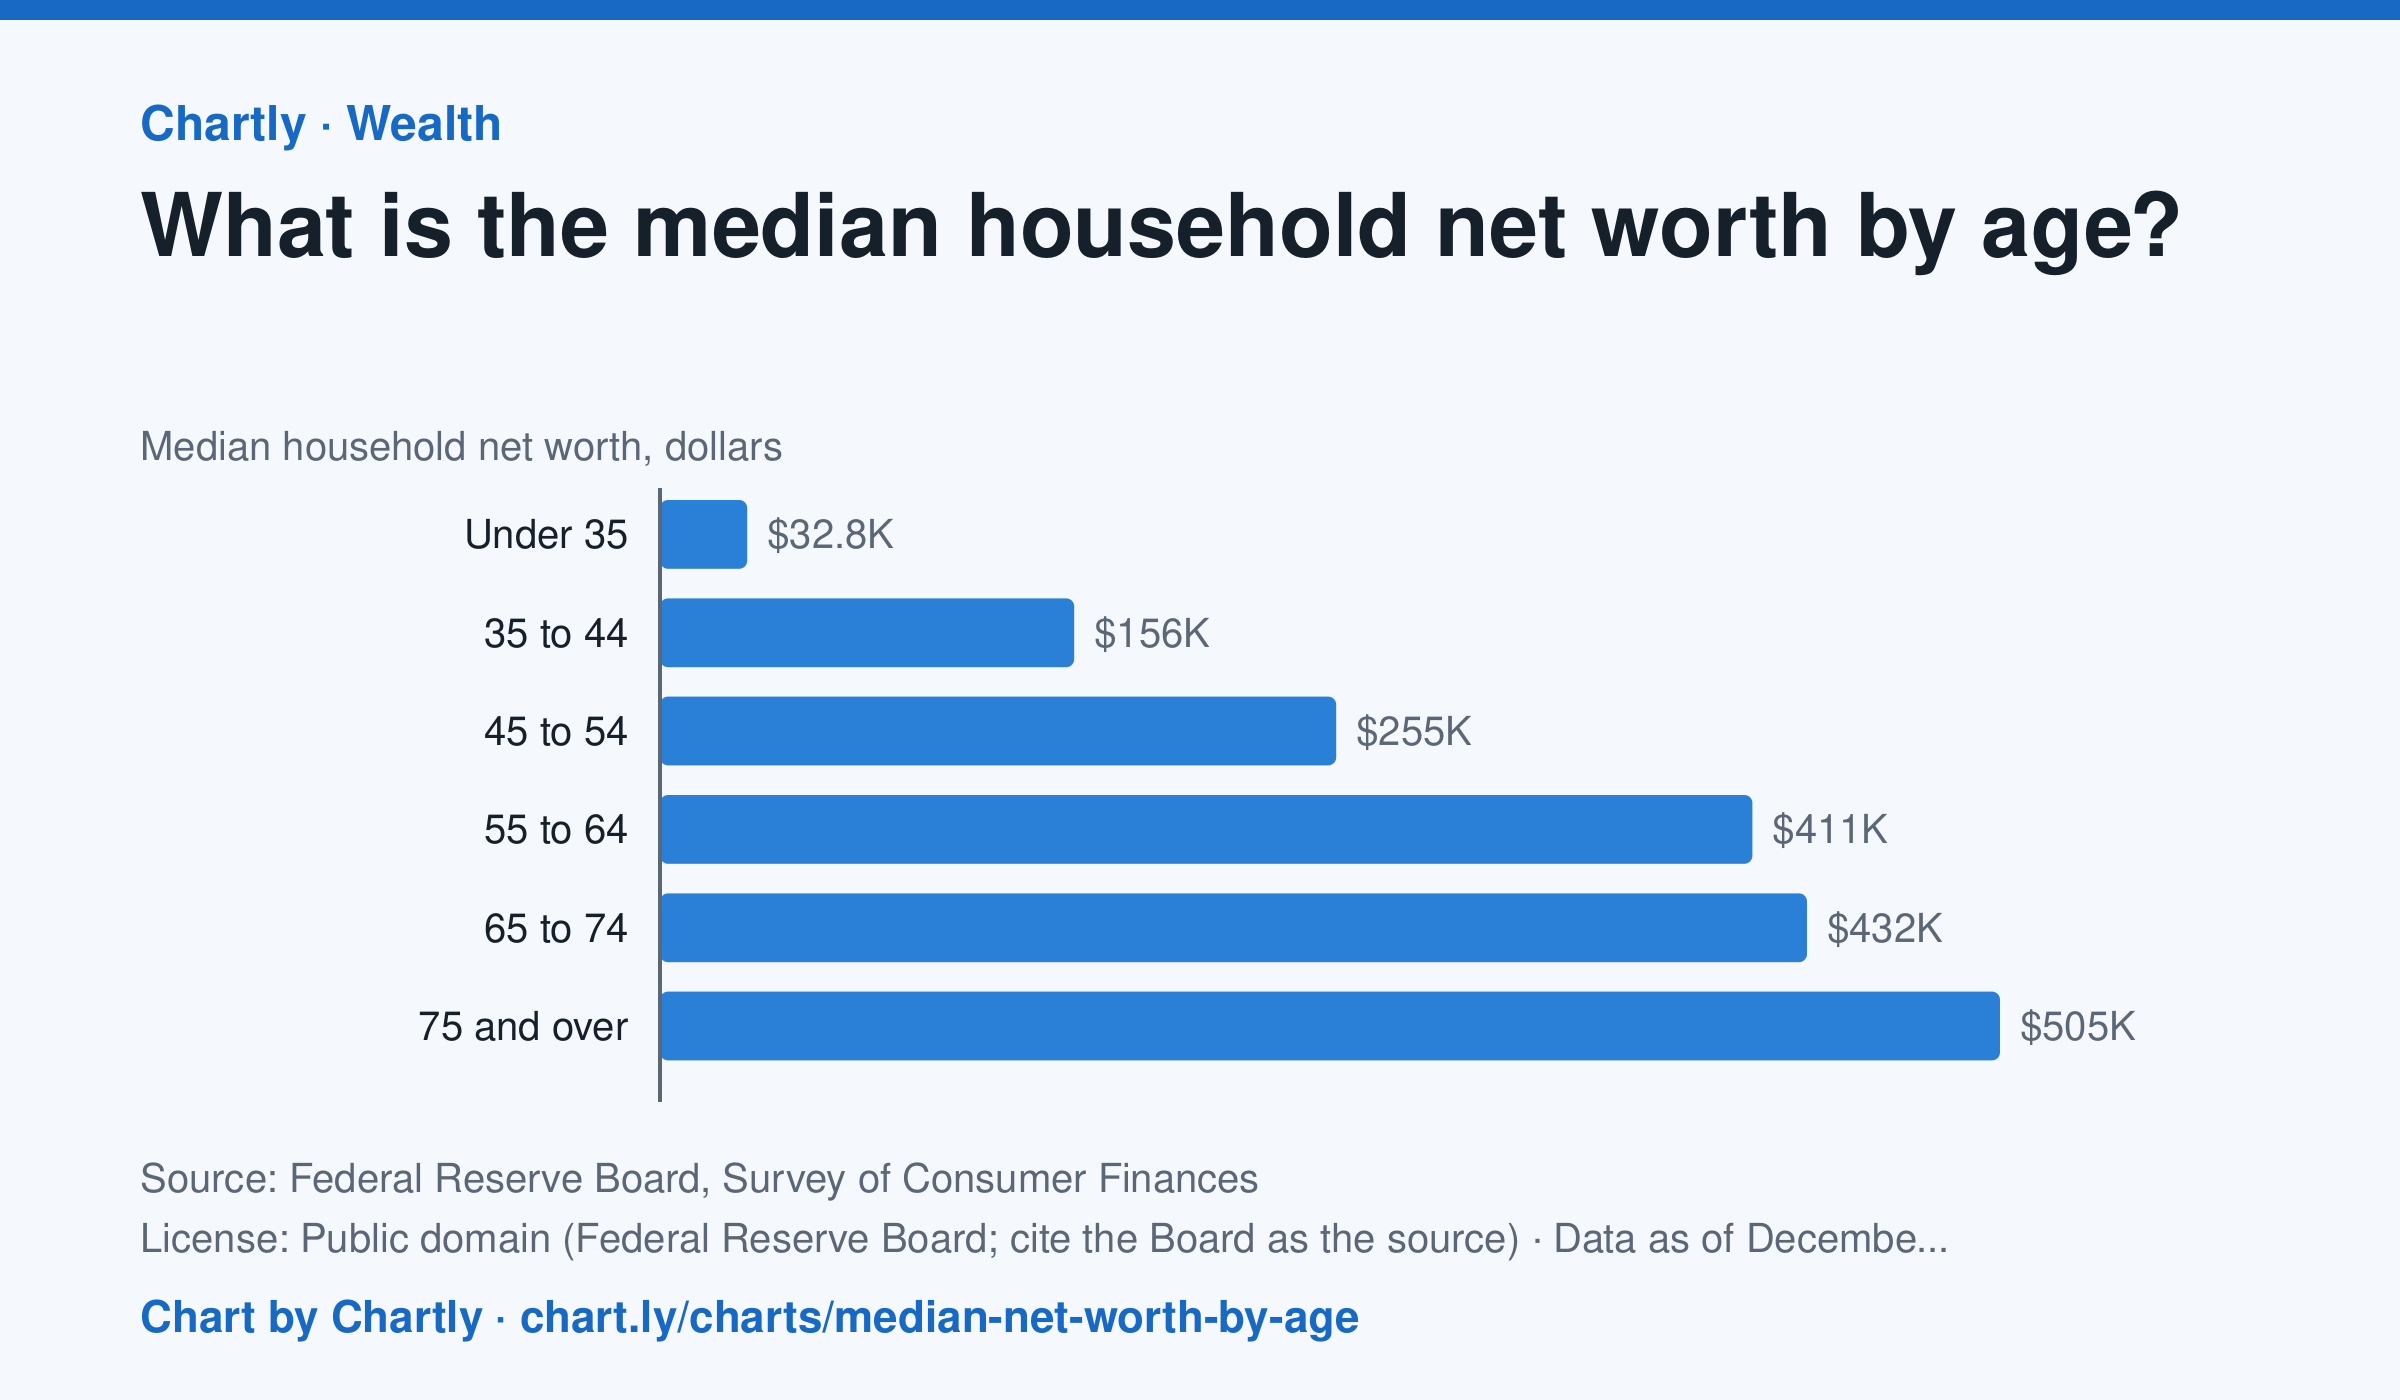
In the Federal Reserve's 2025 survey, the typical (median) household headed by someone under 35 had a net worth of $32,820, and one headed by someone 35 to 44 had $156,000. The median was $254,670 for ages 45 to 54, $411,340 for 55 to 64, $431,900 for 65 to 74 and $504,600 for 75 and over, about 15 times the under-35s'. The median is the household in the middle: half have more and half less. Averages are much higher, because a few households are very rich. Net worth is what a household owns (homes, retirement accounts, stocks, businesses, cars, bank accounts) minus what it owes (mortgages, student and car loans, credit cards). The survey is taken every three years, and figures are in dollars of the survey year. People of different ages also lived through different times, so this compares age groups, not one household's path through life.
Source: Federal Reserve Board, Survey of Consumer Finances (Public domain (Federal Reserve Board; cite the Board as the source)) · Data as of Dec 31, 2025
How to read this chart
Each bar is the median net worth of households, grouped by the age of the person who heads them. Net worth is what a household owns, such as a home, savings and retirement accounts, minus what it owes, such as a mortgage or student loans. The median is the household in the middle: half have more and half have less.
Questions
- Which age group has the highest median net worth, and about how many times the under-35 group's is it?
- Why might net worth keep rising through most of a working life, and why might it fall for the oldest group?
- A few very rich households pull the average far above the median. Why is the median a better picture of a typical household?
Chart and numbers: chart.ly/charts/median-net-worth-by-age · More free charts at chart.ly
Chart 2 of 2 · World
How long do people around the world live, and how has that changed since 1960?
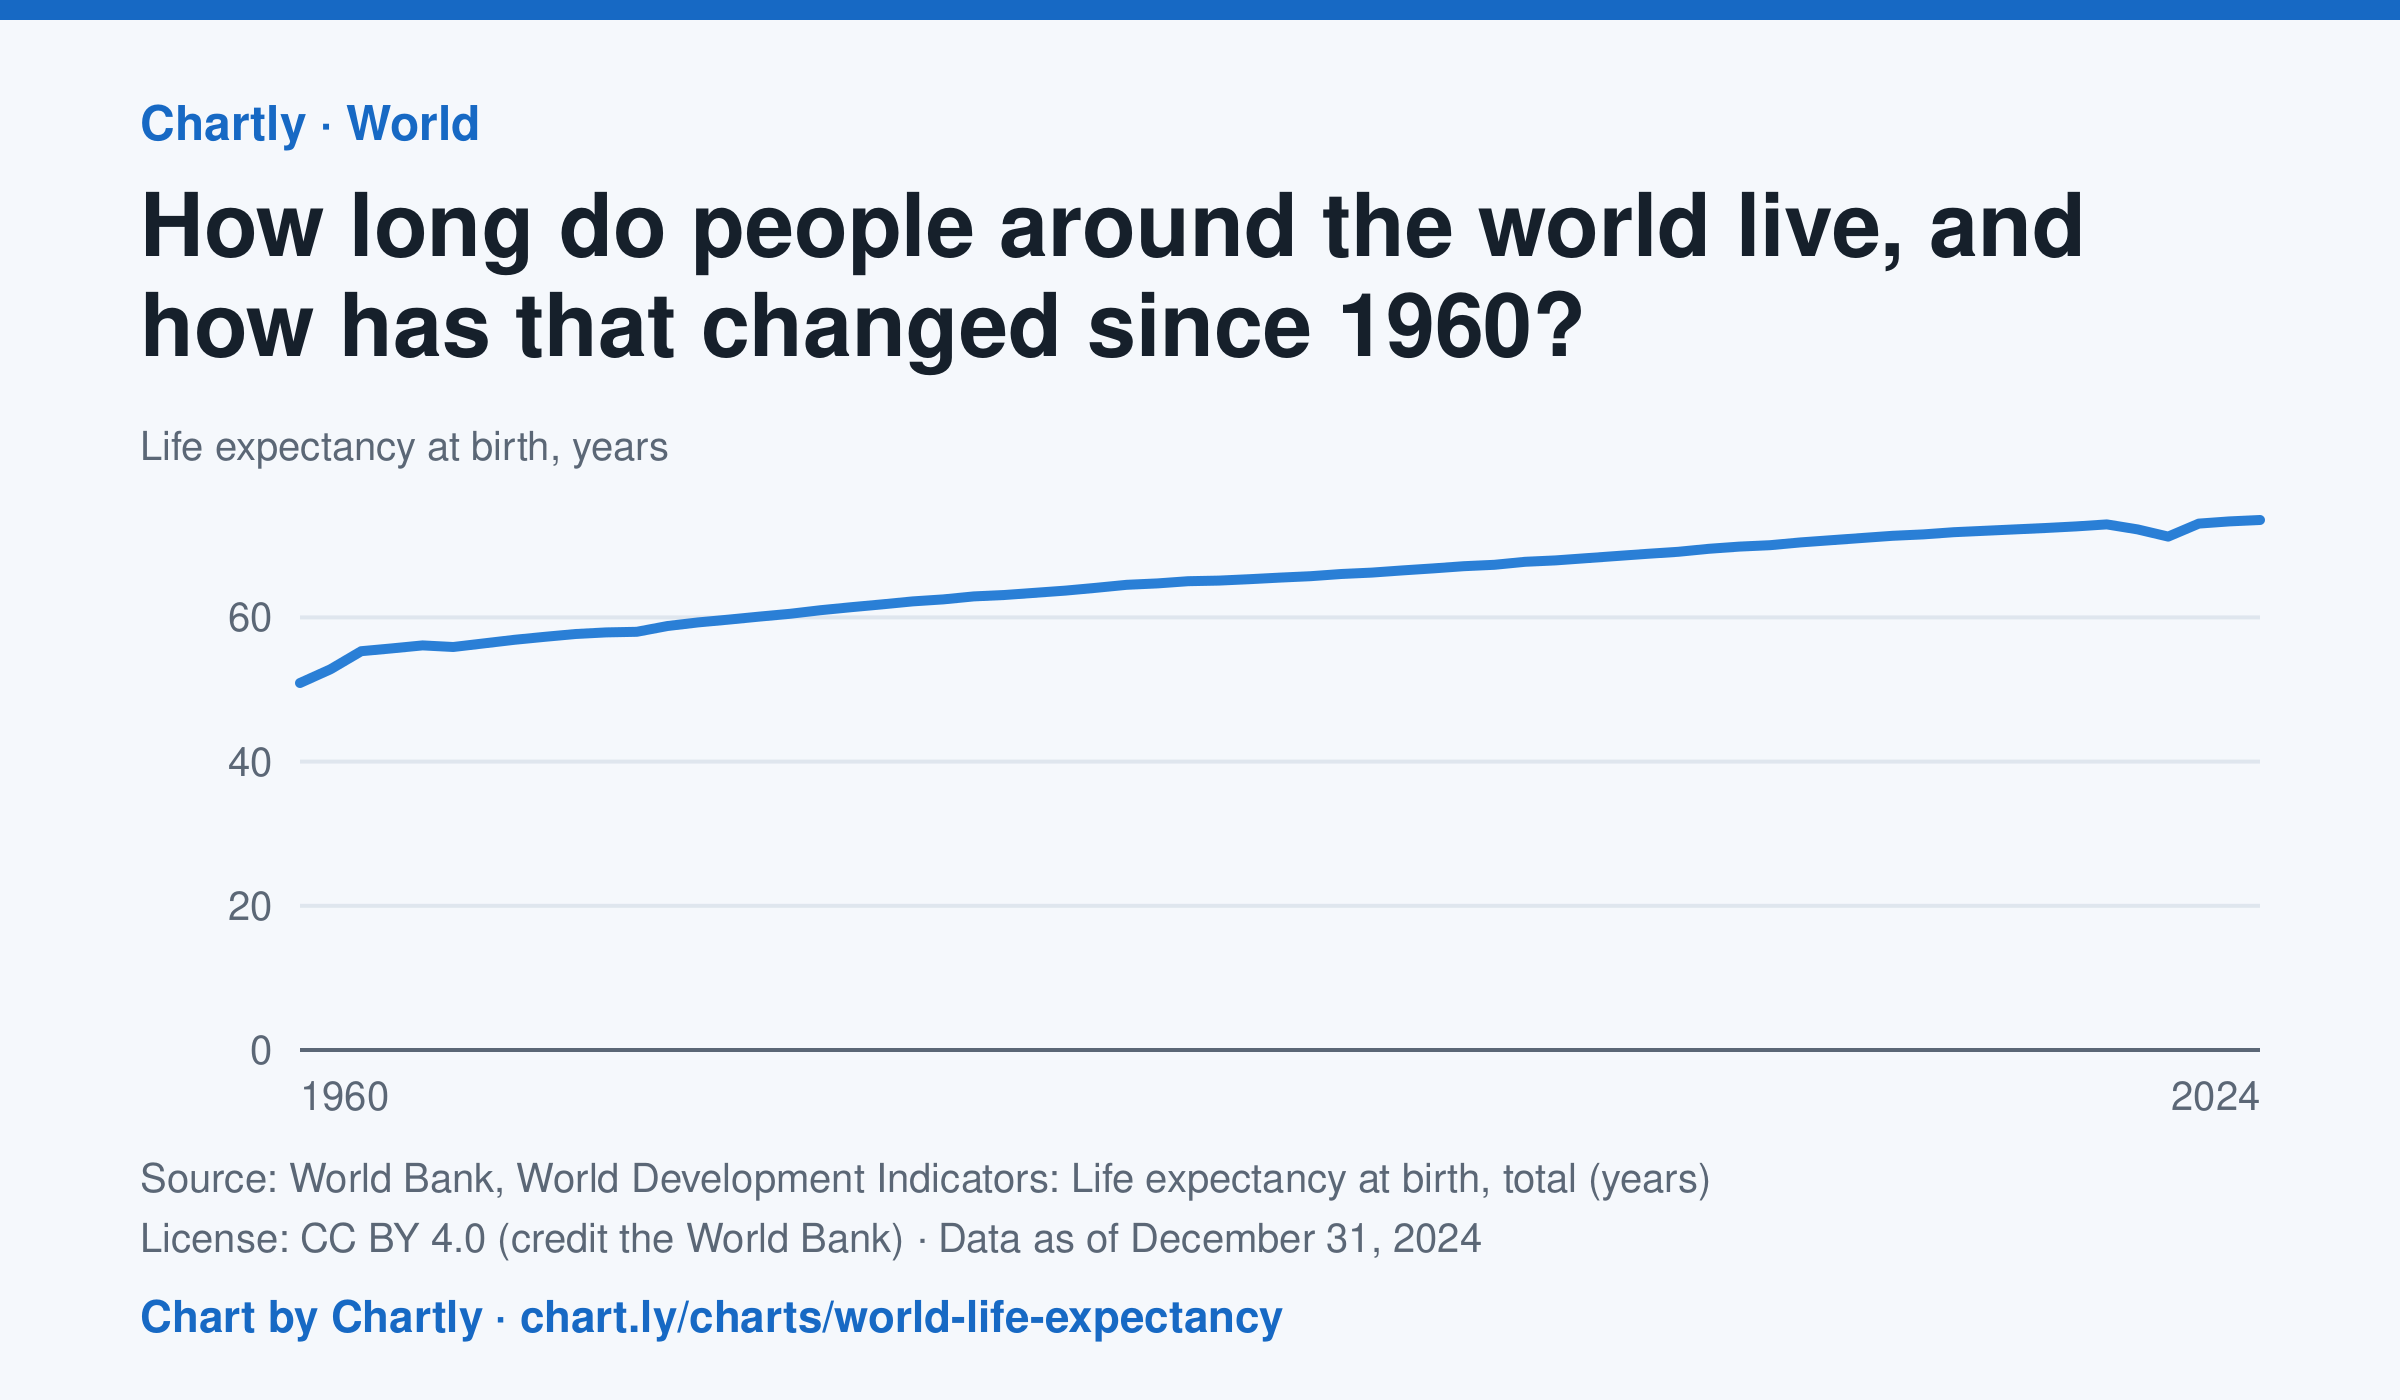
A baby born in 2024 could expect to live 73.5 years on average across the world, up from 50.9 in 1960. The very low early-1960s figures include the famine in China. Life expectancy fell to 71.2 years in 2021, during the COVID-19 pandemic, then recovered. These are United Nations estimates.
Source: World Bank, World Development Indicators: Life expectancy at birth, total (years) (CC BY 4.0 (credit the World Bank)) · Data as of Dec 31, 2024
How to read this chart
Each point is how long a baby born that year could expect to live, on average, across the whole world, if death rates stayed as they were. Because it averages every country, it rises when poorer countries cut deaths of babies and young children. The World Bank publishes the numbers.
Questions
- How many years did world life expectancy rise between the first year on the chart and the newest?
- Find a year when the line dipped. What happened in the world then?
- Compare this chart with the U.S. life expectancy lesson. Why might the world's average have risen faster?
Chart and numbers: chart.ly/charts/world-life-expectancy · More free charts at chart.ly