Print this worksheet, or choose "Save as PDF" in the print window to share a file.
Chart worksheet
Charts to read and discuss
Name:
Class:
Date:
Chart 1 of 2 · Wealth
What is the median household net worth by age?
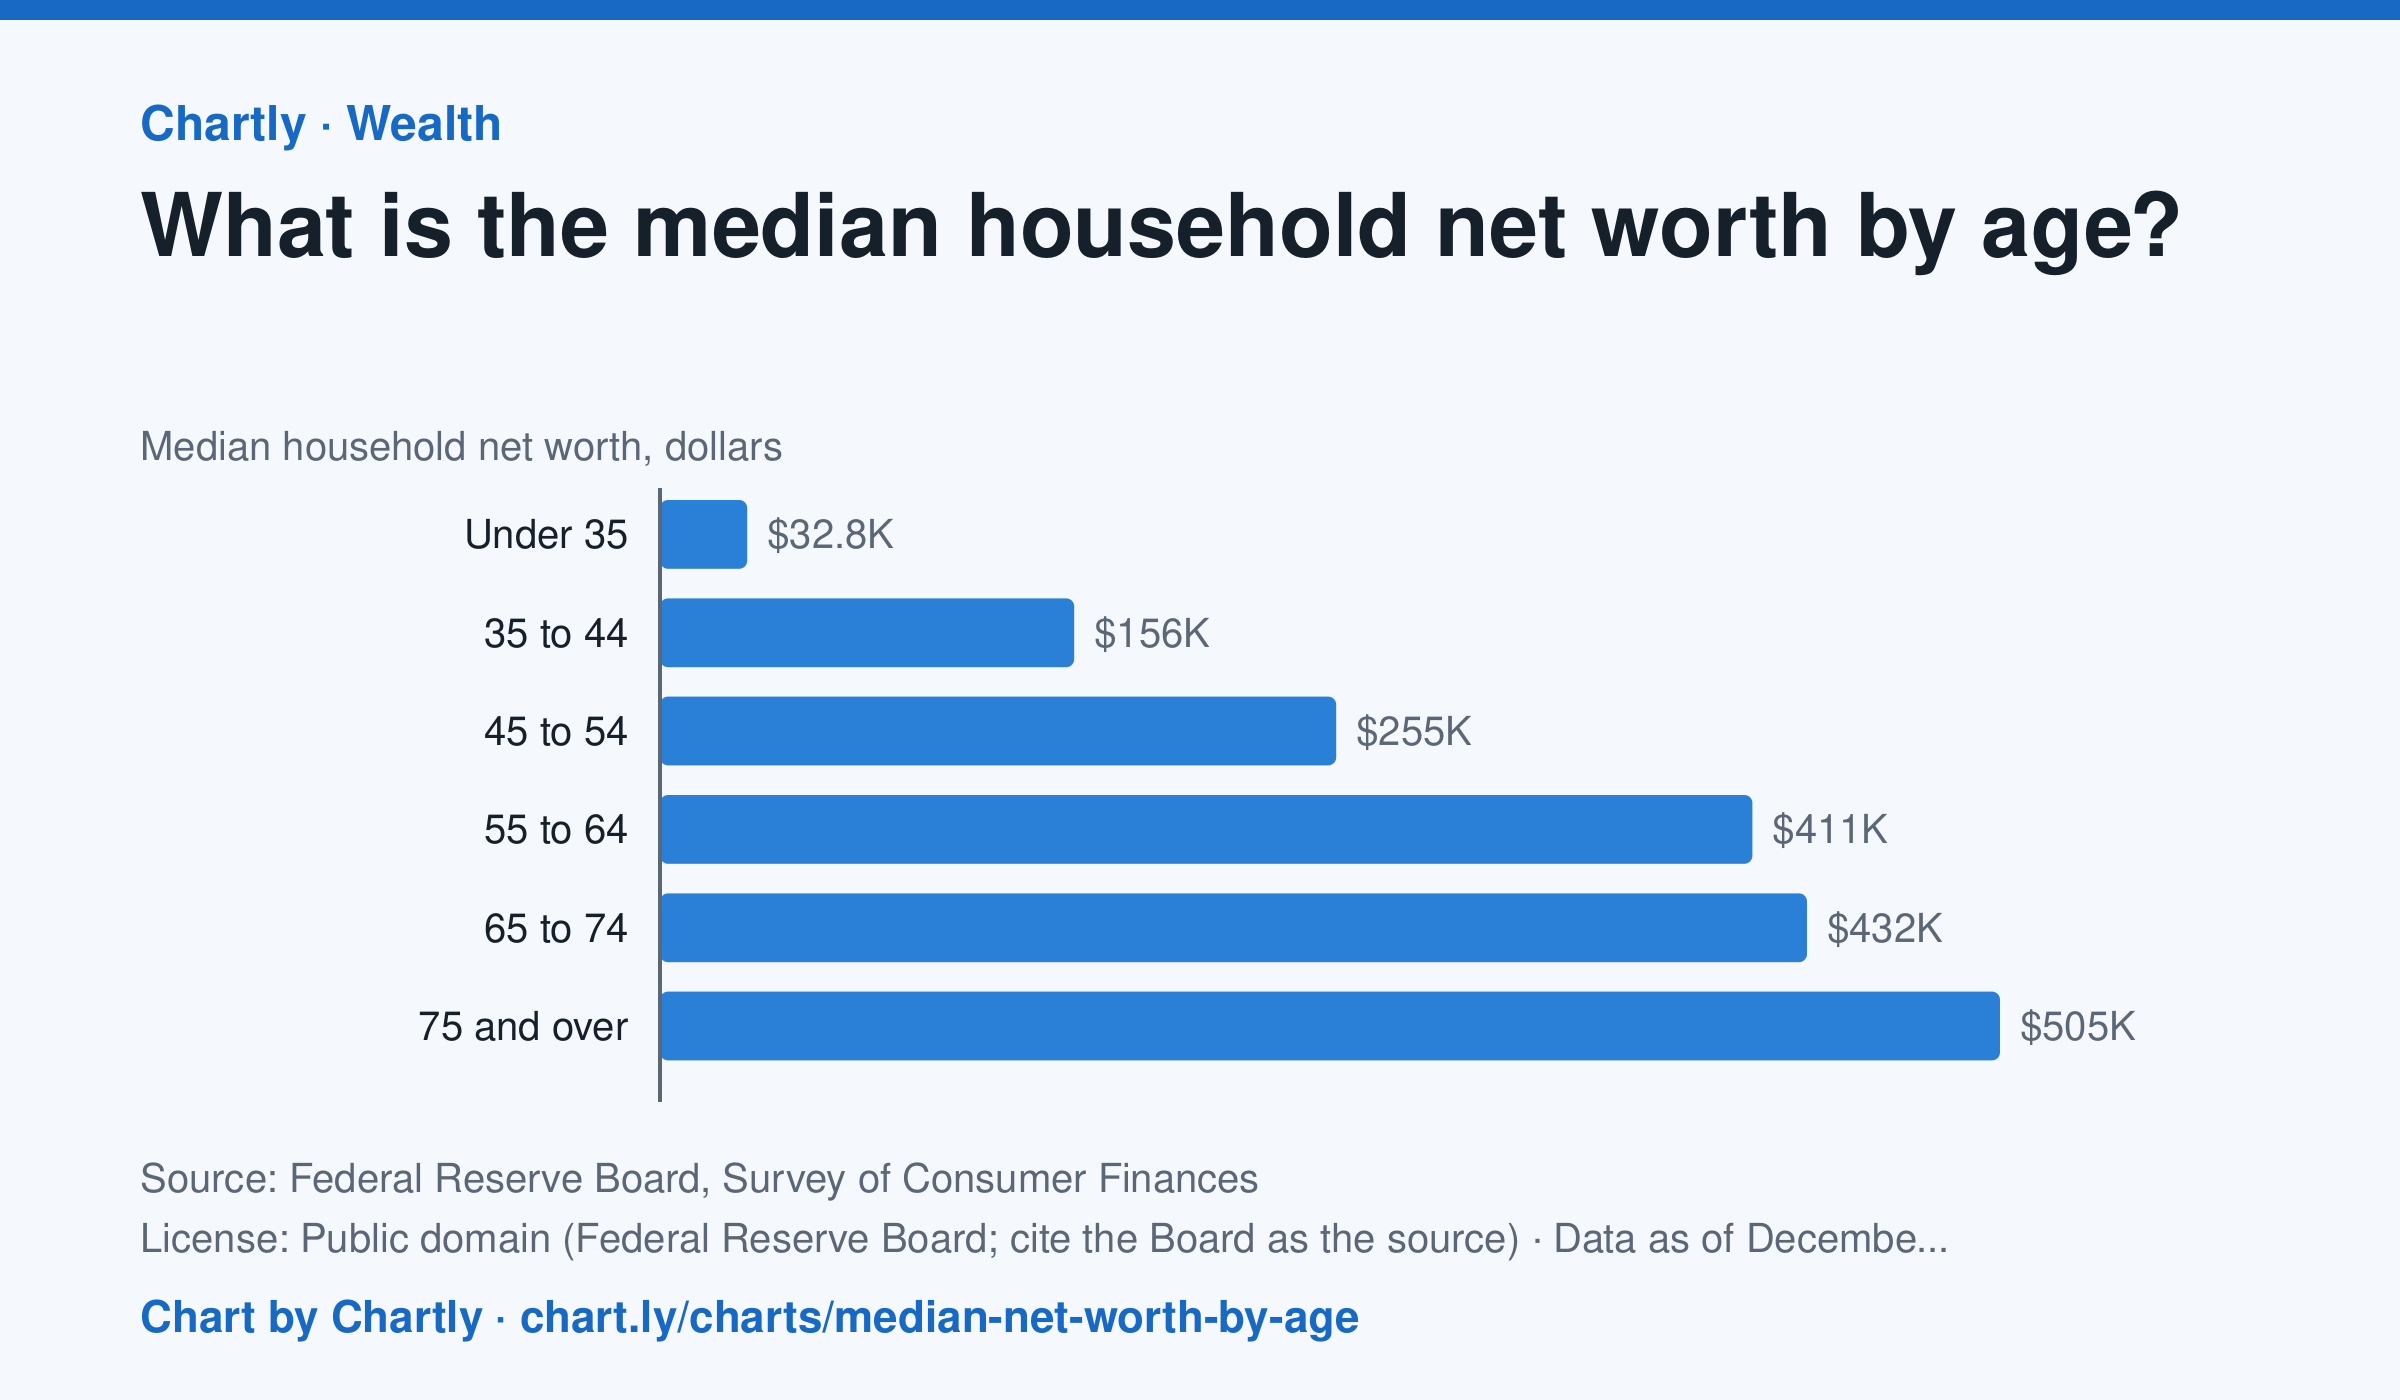
In the Federal Reserve's 2025 survey, the typical (median) household headed by someone under 35 had a net worth of $32,820, and one headed by someone 35 to 44 had $156,000. The median was $254,670 for ages 45 to 54, $411,340 for 55 to 64, $431,900 for 65 to 74 and $504,600 for 75 and over, about 15 times the under-35s'. The median is the household in the middle: half have more and half less. Averages are much higher, because a few households are very rich. Net worth is what a household owns (homes, retirement accounts, stocks, businesses, cars, bank accounts) minus what it owes (mortgages, student and car loans, credit cards). The survey is taken every three years, and figures are in dollars of the survey year. People of different ages also lived through different times, so this compares age groups, not one household's path through life.
Source: Federal Reserve Board, Survey of Consumer Finances (Public domain (Federal Reserve Board; cite the Board as the source)) · Data as of Dec 31, 2025
How to read this chart
Each bar is the median net worth of households, grouped by the age of the person who heads them. Net worth is what a household owns, such as a home, savings and retirement accounts, minus what it owes, such as a mortgage or student loans. The median is the household in the middle: half have more and half have less.
Questions
- Which age group has the highest median net worth, and about how many times the under-35 group's is it?
- Why might net worth keep rising through most of a working life, and why might it fall for the oldest group?
- A few very rich households pull the average far above the median. Why is the median a better picture of a typical household?
Chart and numbers: chart.ly/charts/median-net-worth-by-age · More free charts at chart.ly
Chart 2 of 2 · Federal budget
Where does federal spending go?
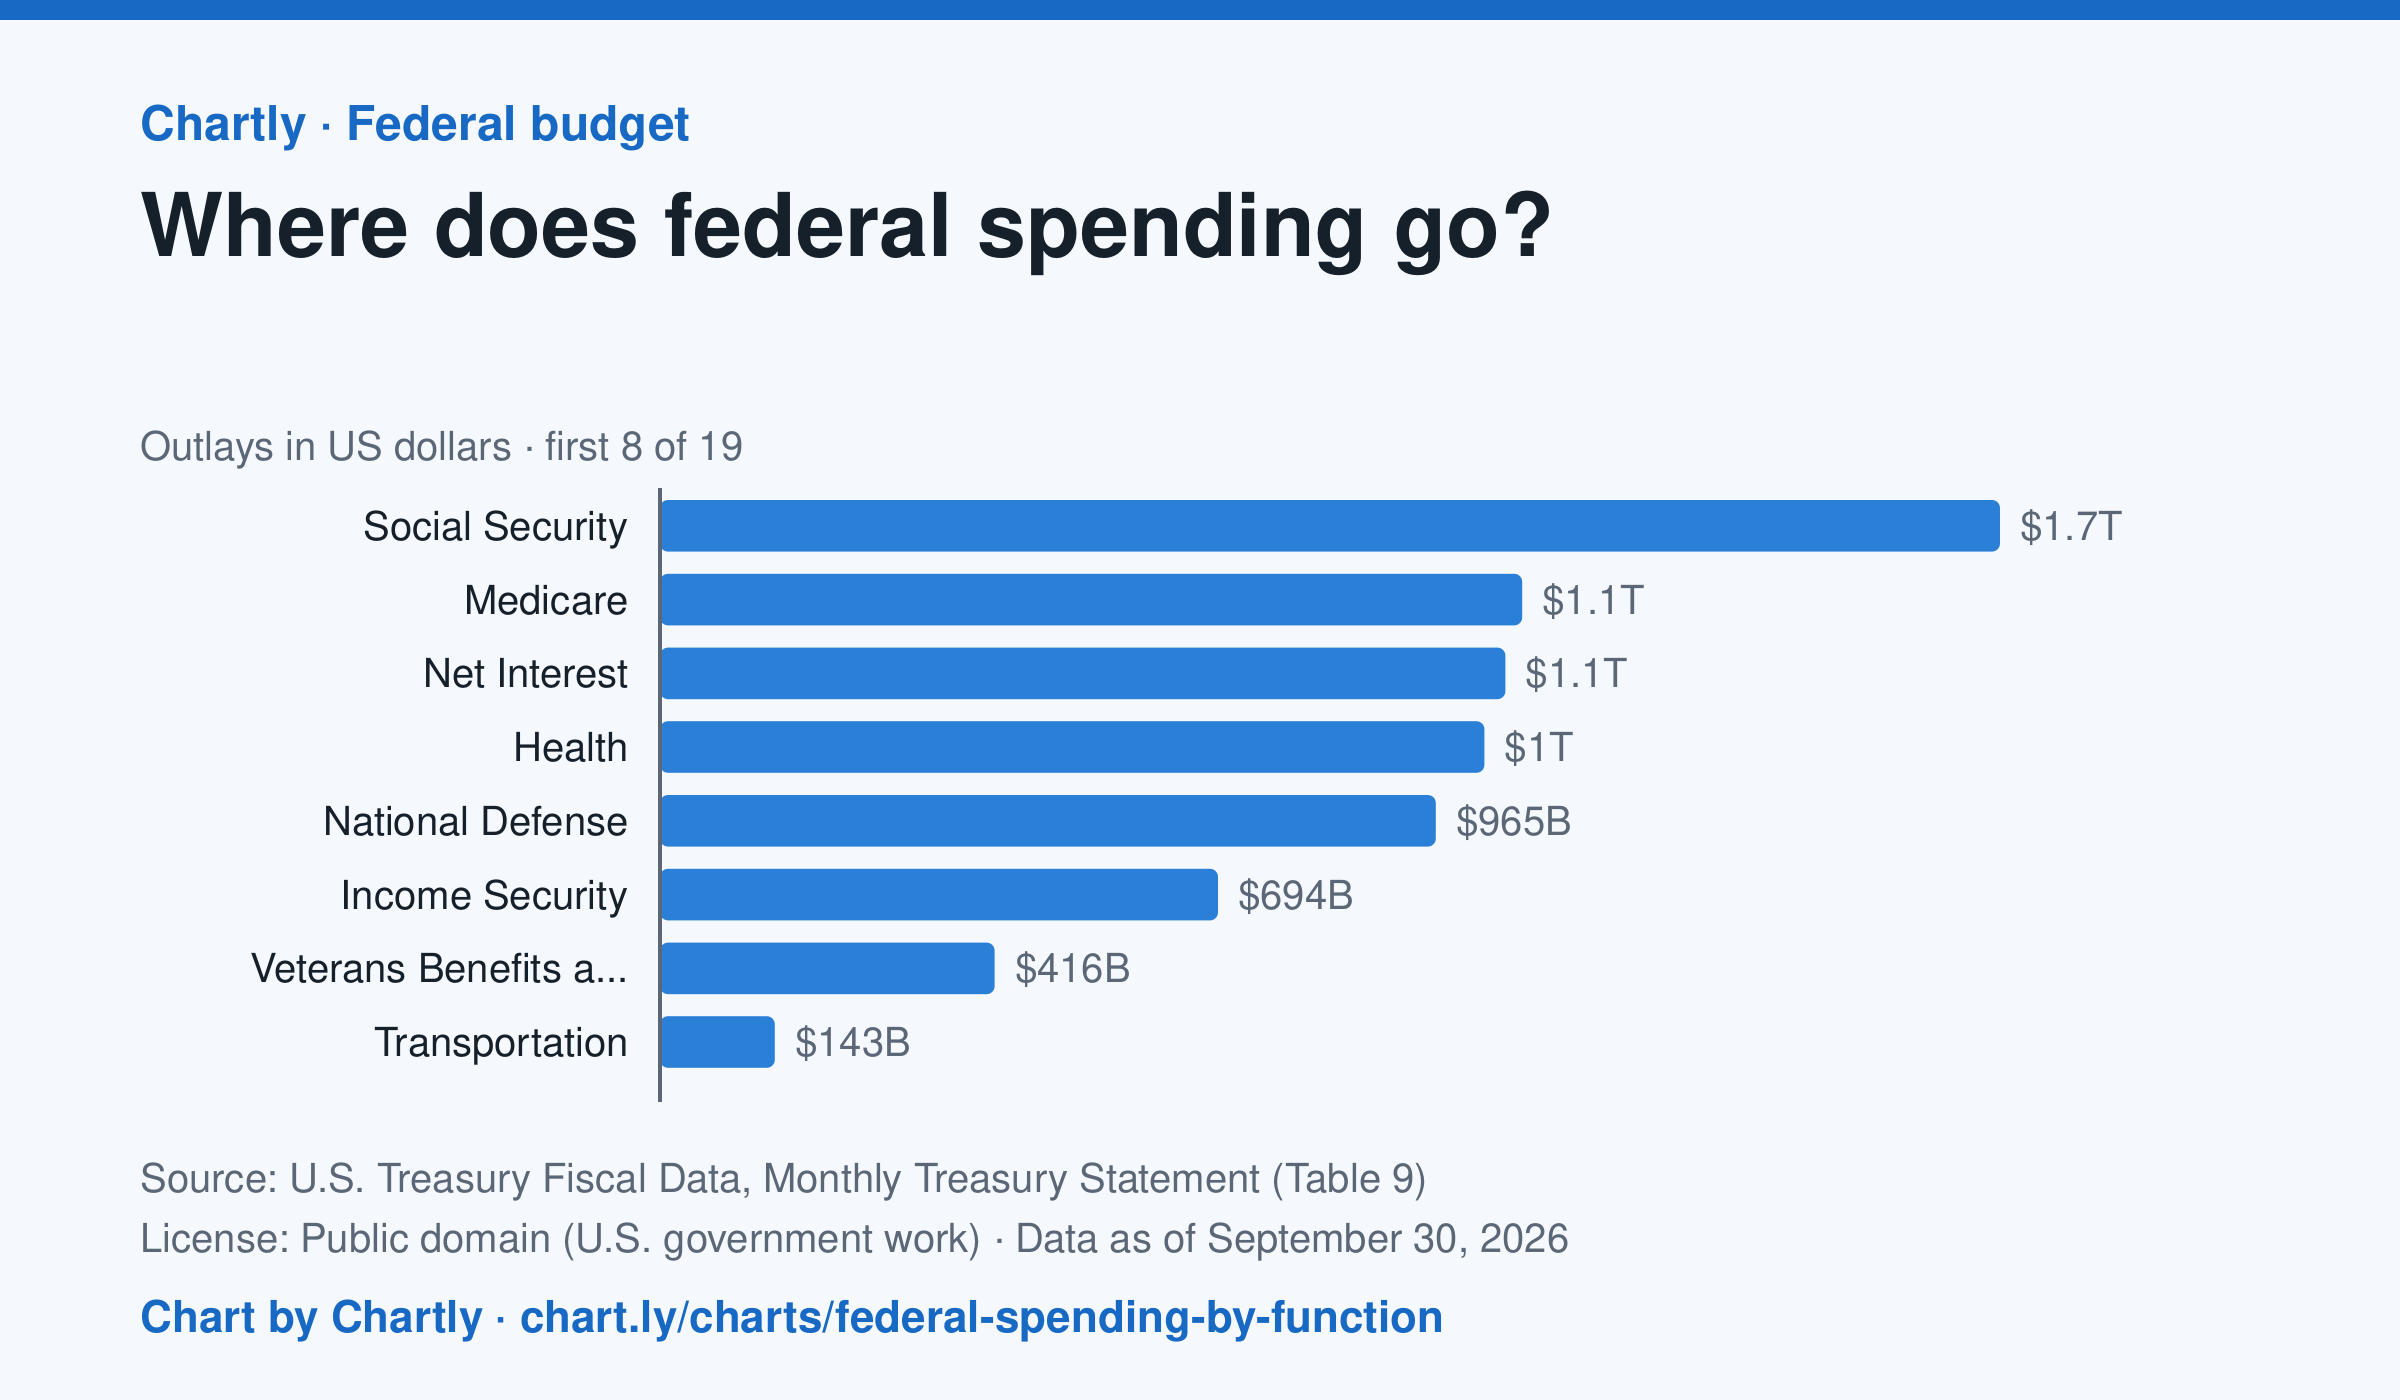
Social Security was the biggest item in fiscal 2026 at $1.67 trillion, out of $7.4 trillion in total. Next came Medicare ($1.07 trillion), Net Interest ($1.05 trillion), Health ($1.03 trillion) and National Defense ($965 billion). Two accounting lines are below zero, so the bars add up to the total.
Source: U.S. Treasury Fiscal Data, Monthly Treasury Statement (Table 9) (Public domain (U.S. government work)) · Data as of Sep 30, 2026
How to read this chart
Each bar is how much the federal government spent on one area in a fiscal year, which runs from October to September. The axis shows dollars: 1T is a trillion dollars, a thousand billion. One bar is below zero because it counts money the government takes back in, such as payments agencies make to each other, which lowers the total.
Questions
- Which area gets the most money? About how many times more than the smallest positive bar?
- Which of the biggest areas are paid to people directly, like retirees and patients, and which pay for services?
- If Congress wanted to cut spending by a lot, which bars would it have to change, and why is that hard?
Chart and numbers: chart.ly/charts/federal-spending-by-function · More free charts at chart.ly