Print this worksheet, or choose "Save as PDF" in the print window to share a file.
Chart worksheet
U.S. history chart assignment
Name:
Class:
Date:
Chart 1 of 1 · Income and poverty
What is the typical household income in each state?
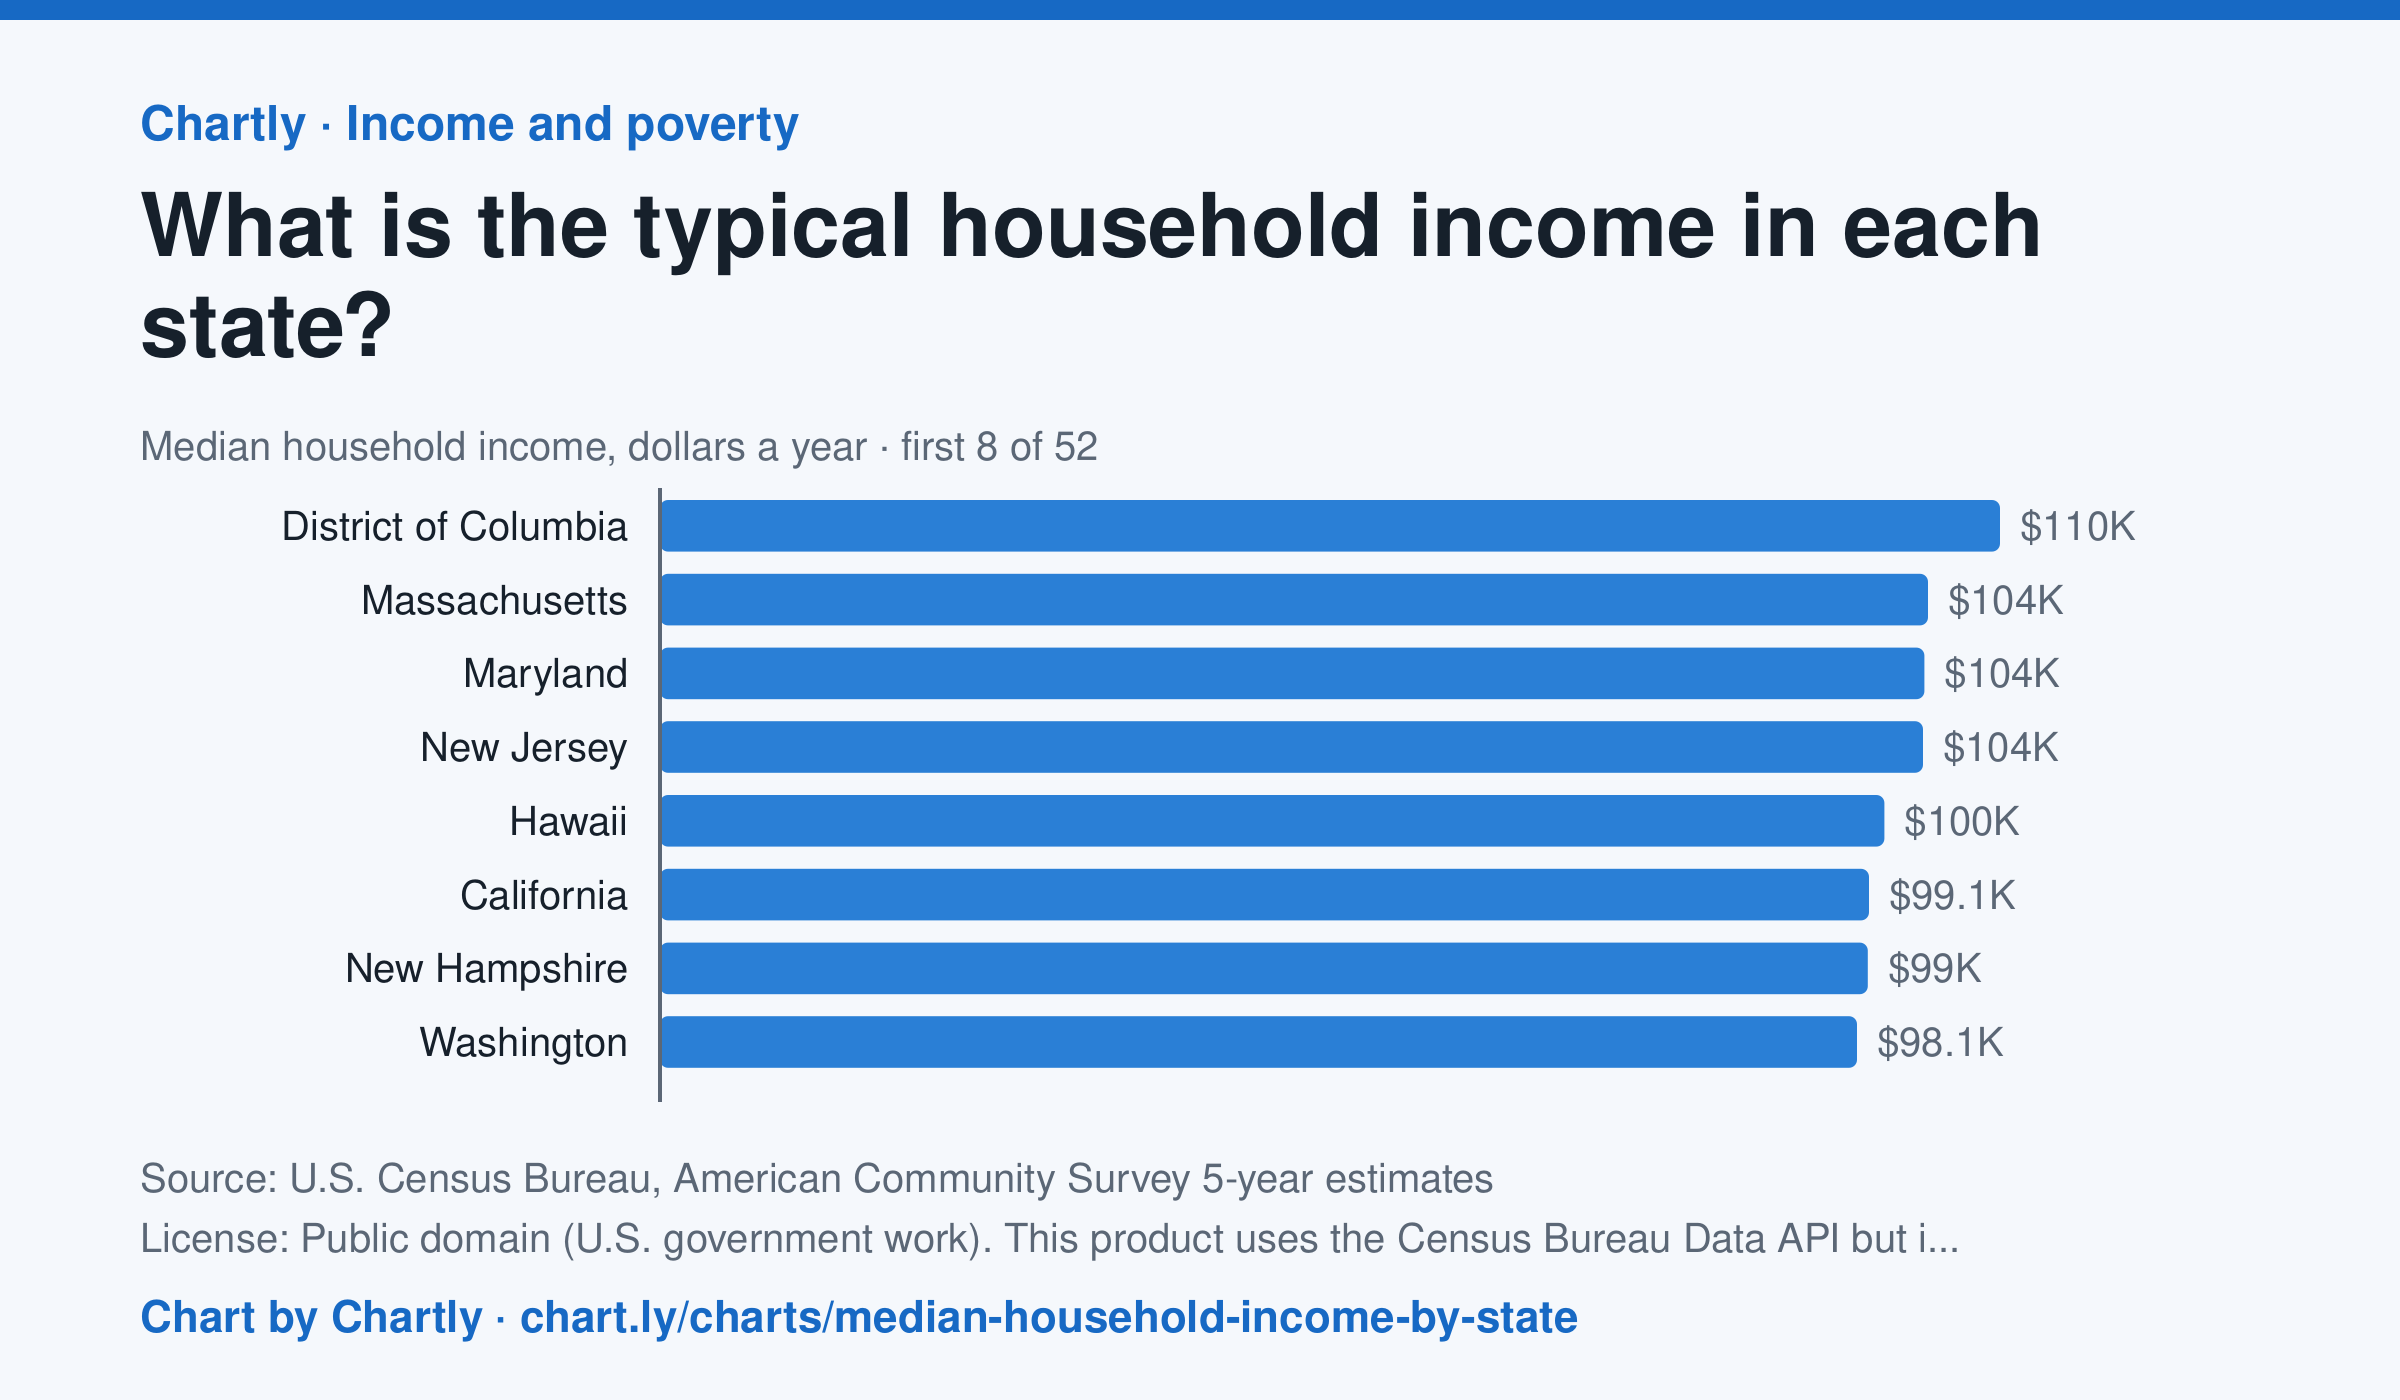
In the Census Bureau's 5-year survey ending in 2024, the typical household in District of Columbia earned $109,870 a year, the most, followed by Massachusetts ($103,960) and Maryland ($103,678). Mississippi was lowest at $56,447, and the U.S. median was $80,734. These are 5-year estimates in 2024 dollars, each with a margin of error.
Source: U.S. Census Bureau, American Community Survey 5-year estimates (Public domain (U.S. government work). This product uses the Census Bureau Data API but is not endorsed or certified by the Census Bureau.) · Data as of Dec 31, 2024
How to read this chart
Each bar is the median household income in a state: half of households earn more and half earn less. The dashed line is the whole U.S., for comparison. These are survey estimates, and each has a margin of error: the true value is likely within that range, so states with overlapping ranges may not really differ.
Questions
- Find your state. Is it above or below the U.S. median, and by about how much?
- Why do statisticians often use the median instead of the average (mean) for income?
- Housing and groceries cost more in some states. What would you need to know to compare what these incomes can buy?
Chart and numbers: chart.ly/charts/median-household-income-by-state · More free charts at chart.ly