Print this worksheet, or choose "Save as PDF" in the print window to share a file.
Chart worksheet
Charts to read and discuss
Name:
Class:
Date:
Chart 1 of 3 · Food and drug safety
Which companies have had the most FDA food recalls?
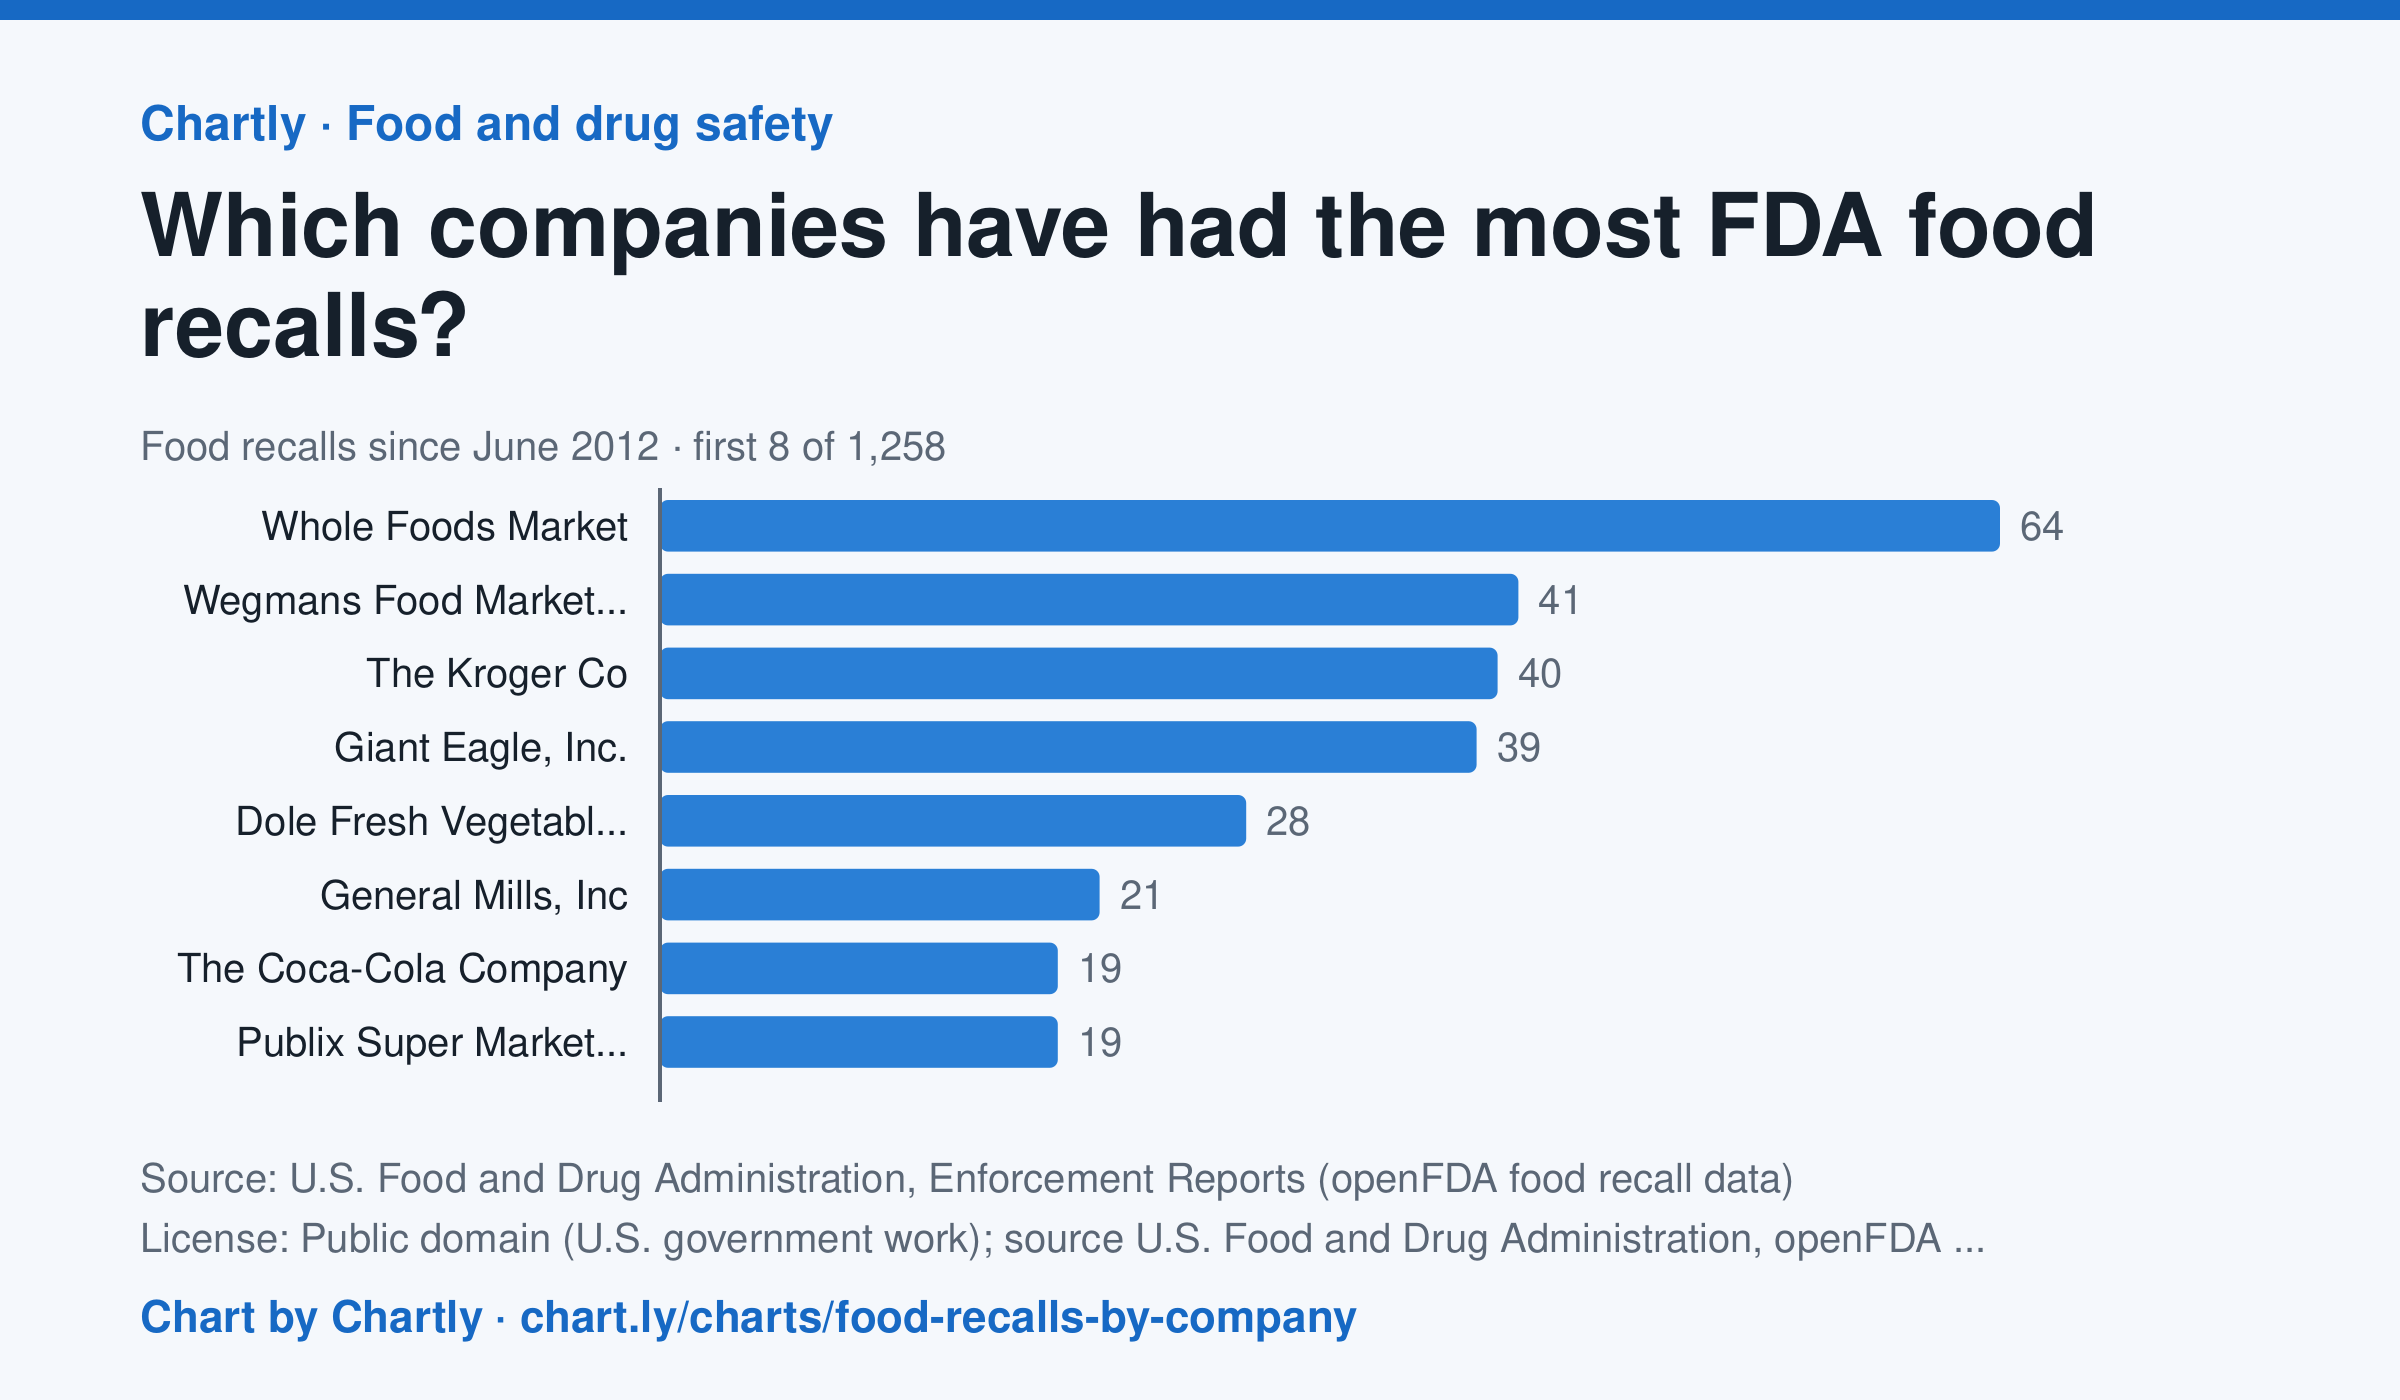
Whole Foods Market has had the most FDA food recalls since June 2012, 64 through November 4, 2026, followed by Wegmans Food Markets, Inc. (41) and The Kroger Co (40). The chart ranks the 1,258 companies with at least two recalls; search it for any of them, or pick one to see every recall. Each recall counts once, under the company FDA lists as the recalling firm, so a parent company's brands and names spelled another way are counted apart. A big grocer or maker sells more products, so more recalls don't by themselves mean less safe food. Meat, poultry and most egg products are USDA's to recall and aren't included.
Source: U.S. Food and Drug Administration, Enforcement Reports (openFDA food recall data) (Public domain (U.S. government work); source U.S. Food and Drug Administration, openFDA) · Data as of Nov 4, 2026
Questions
- In one sentence of your own, what does this chart show?
- Find the biggest change or difference in the chart. What might explain it?
- Who collected these numbers, and how recent are they? What else would you want to know before drawing a conclusion?
Chart and numbers: chart.ly/charts/food-recalls-by-company · More free charts at chart.ly
Chart 2 of 3 · Health
How long do Americans live, and how has that changed since 1900?
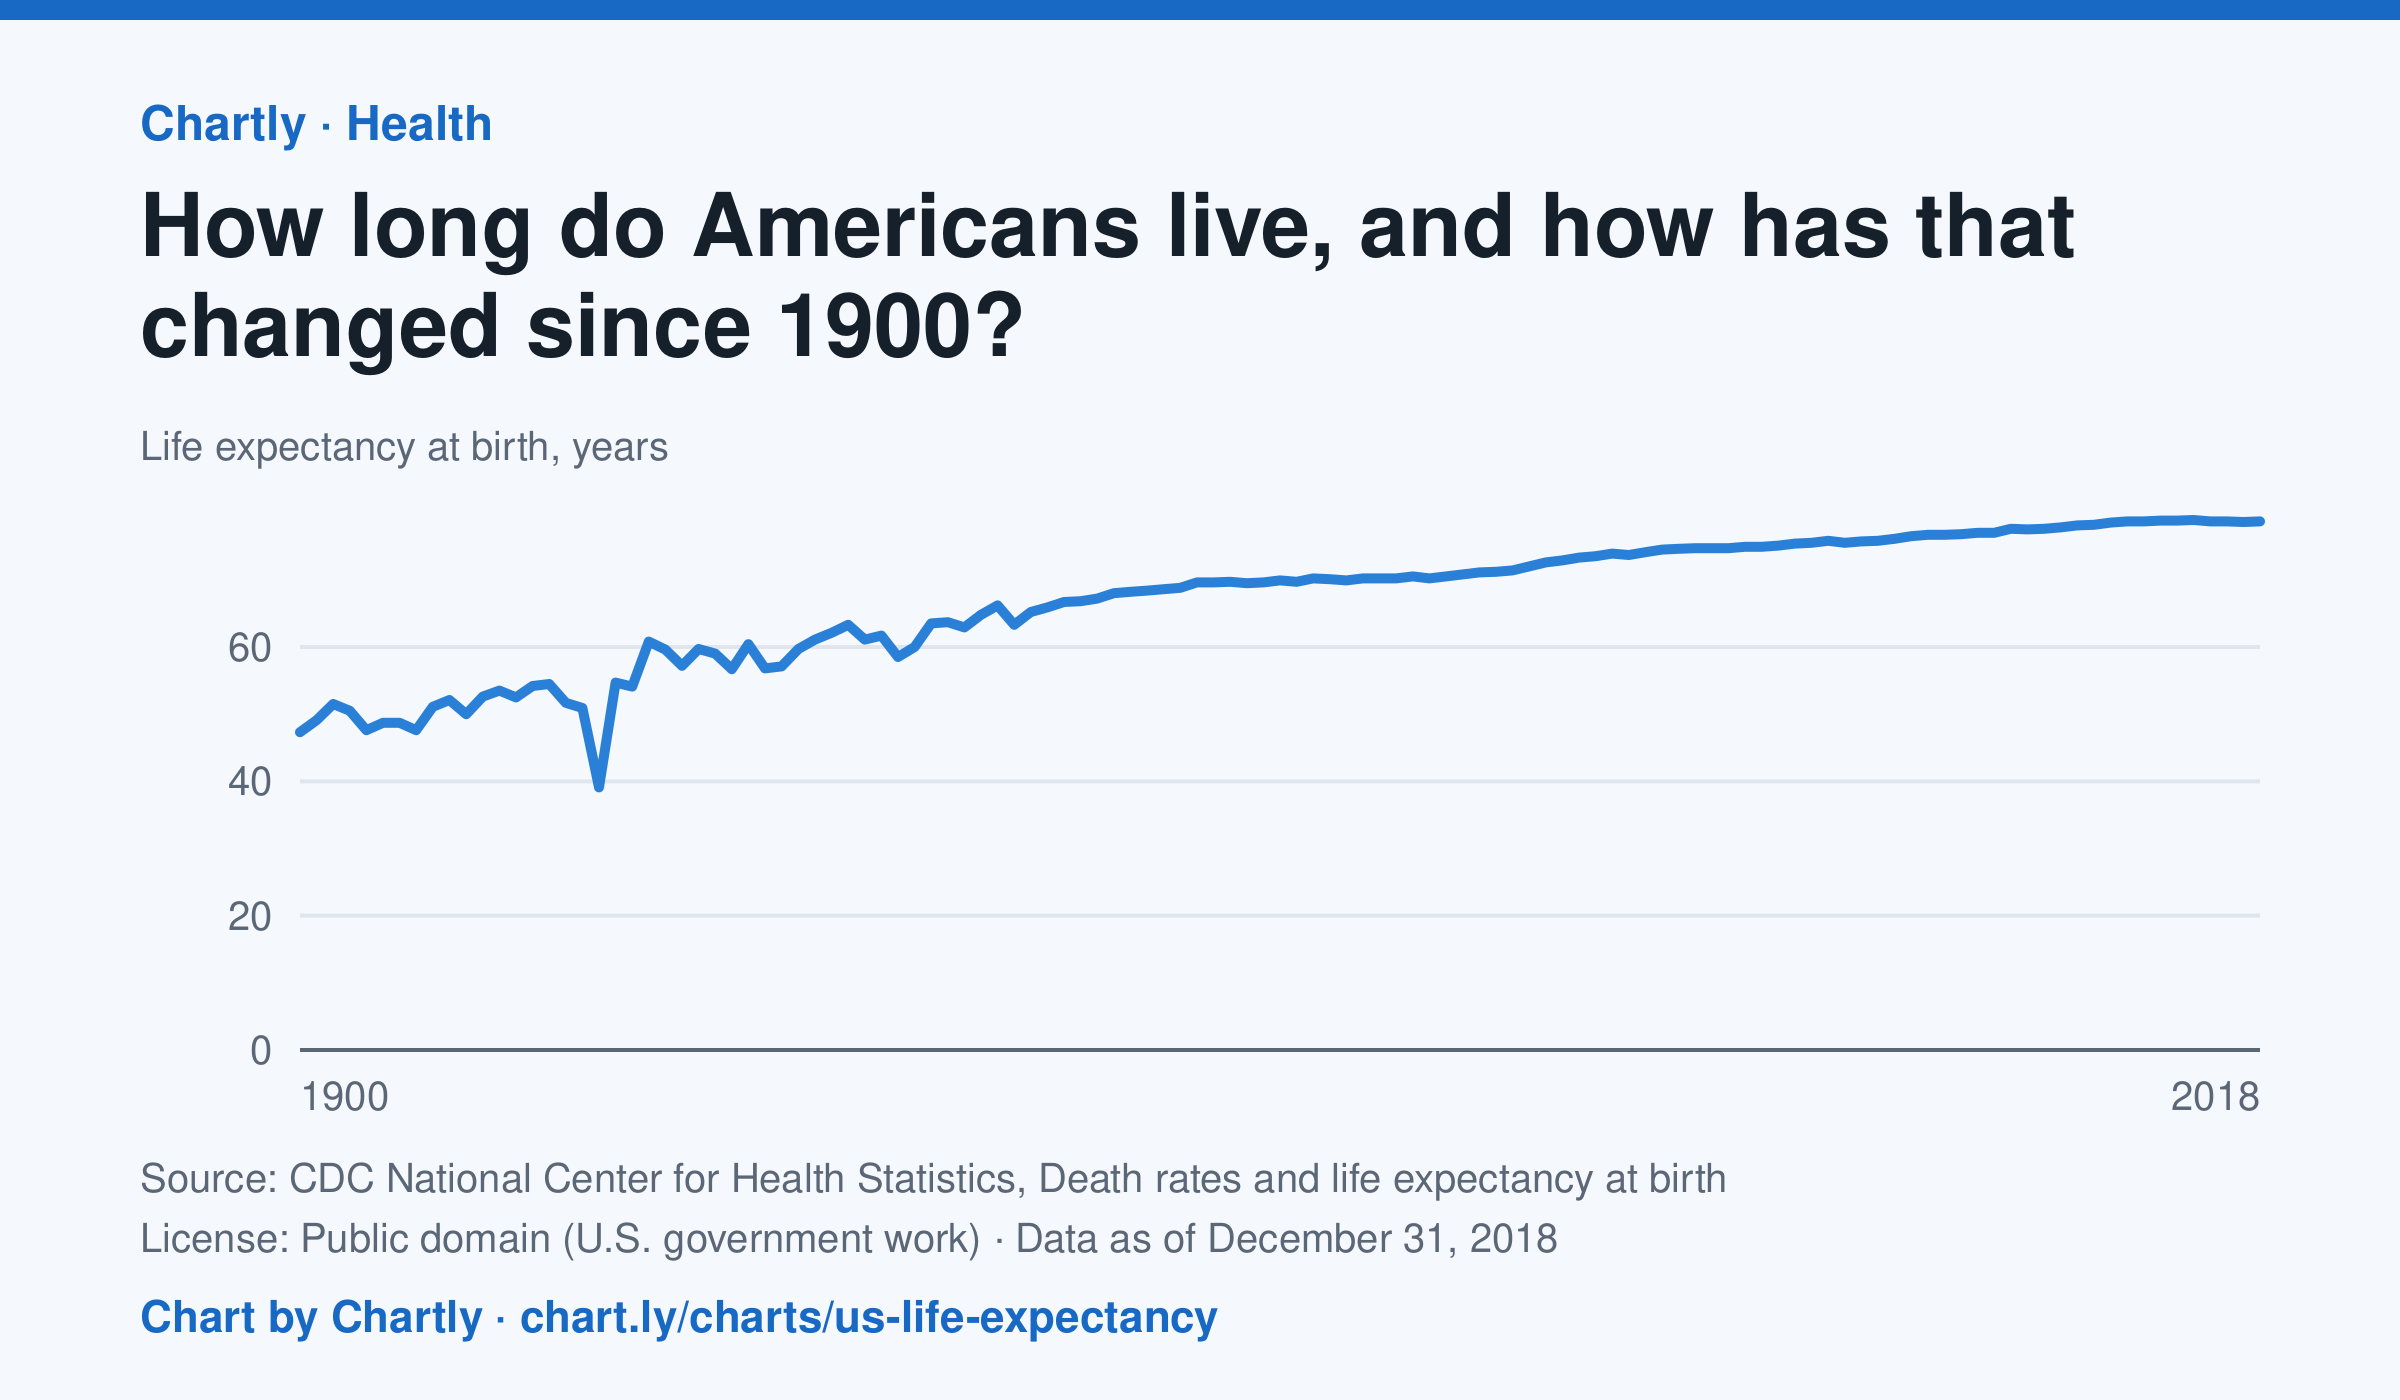
A baby born in the US in 2018 could expect to live 78.7 years, up from 47.3 in 1900. The sharpest drop was in 1918, to 39.1 years, during the influenza pandemic. This CDC dataset stops at 2018; later NCHS reports put life expectancy at 78.4 years in 2023 and 79.0 in 2024, after a fall during the COVID-19 pandemic.
Source: CDC National Center for Health Statistics, Death rates and life expectancy at birth (Public domain (U.S. government work)) · Data as of Dec 31, 2018
How to read this chart
Each point is how long a baby born in that year could expect to live, if death rates stayed as they were that year. It is an average, so it is pulled down a lot when many babies and young people die. Hover or tap a point to read its year and value.
Questions
- Find the sharpest drop on the chart. What happened in the world that year?
- Life expectancy in 1900 was under 50. Does that mean most adults died in their 40s? What else could lower the average?
- What changes in medicine, food or public health could explain the long rise?
Chart and numbers: chart.ly/charts/us-life-expectancy · More free charts at chart.ly
Chart 3 of 3 · World
How has the world's population grown since 1960?
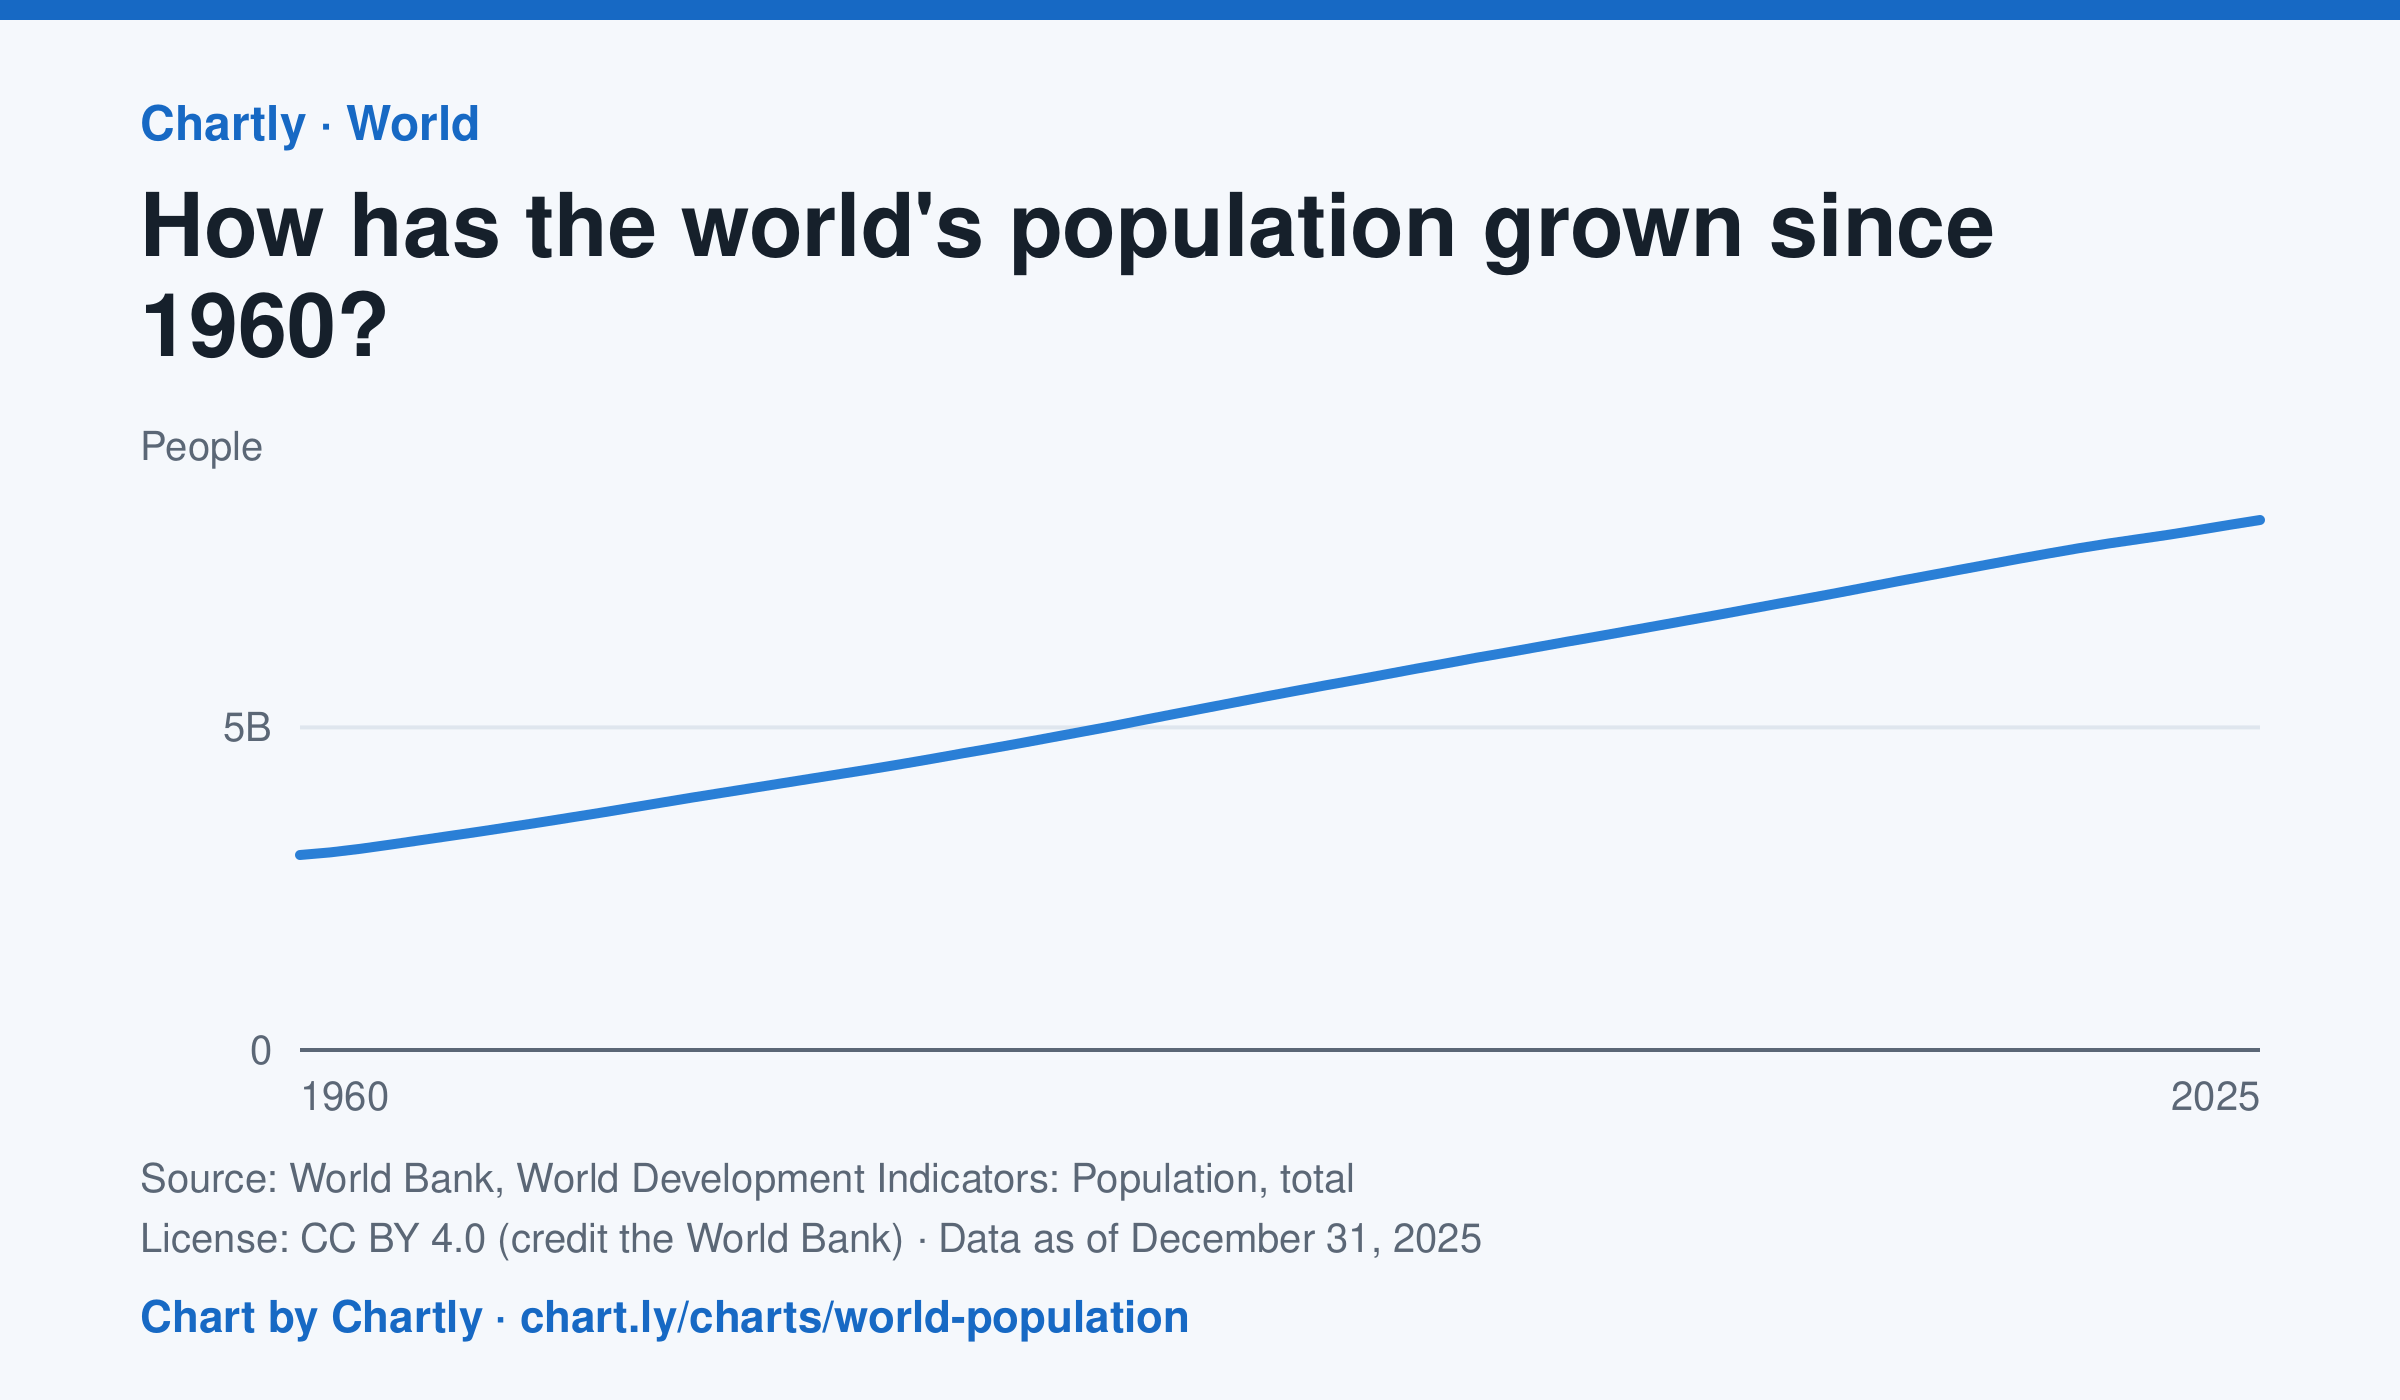
The world had 8.22 billion people in 2025, about 2.7 times the 3.02 billion of 1960. It passed 8 billion in 2023. Figures are mid-year estimates from the United Nations, which revises them as new censuses come in.
Source: World Bank, World Development Indicators: Population, total (CC BY 4.0 (credit the World Bank)) · Data as of Dec 31, 2025
How to read this chart
Each point is the number of people alive in the world in the middle of that year, estimated by the United Nations. The axis starts at zero, so the height of the line shows the true size. Look at how steep the line is to see how fast the population grew.
Questions
- Judging from the chart, about how many years did it take the world to add its most recent billion people?
- Is the line getting steeper or flatter in recent years? What does that tell you about the growth rate?
- These numbers are estimates that the UN revises. Why is it hard to count every person on Earth?
Chart and numbers: chart.ly/charts/world-population · More free charts at chart.ly