Print this worksheet, or choose "Save as PDF" in the print window to share a file.
Chart worksheet
Charts to read and discuss
Name:
Class:
Date:
Chart 1 of 2 · Food and drug safety
How many food recalls are for undeclared allergens each year?
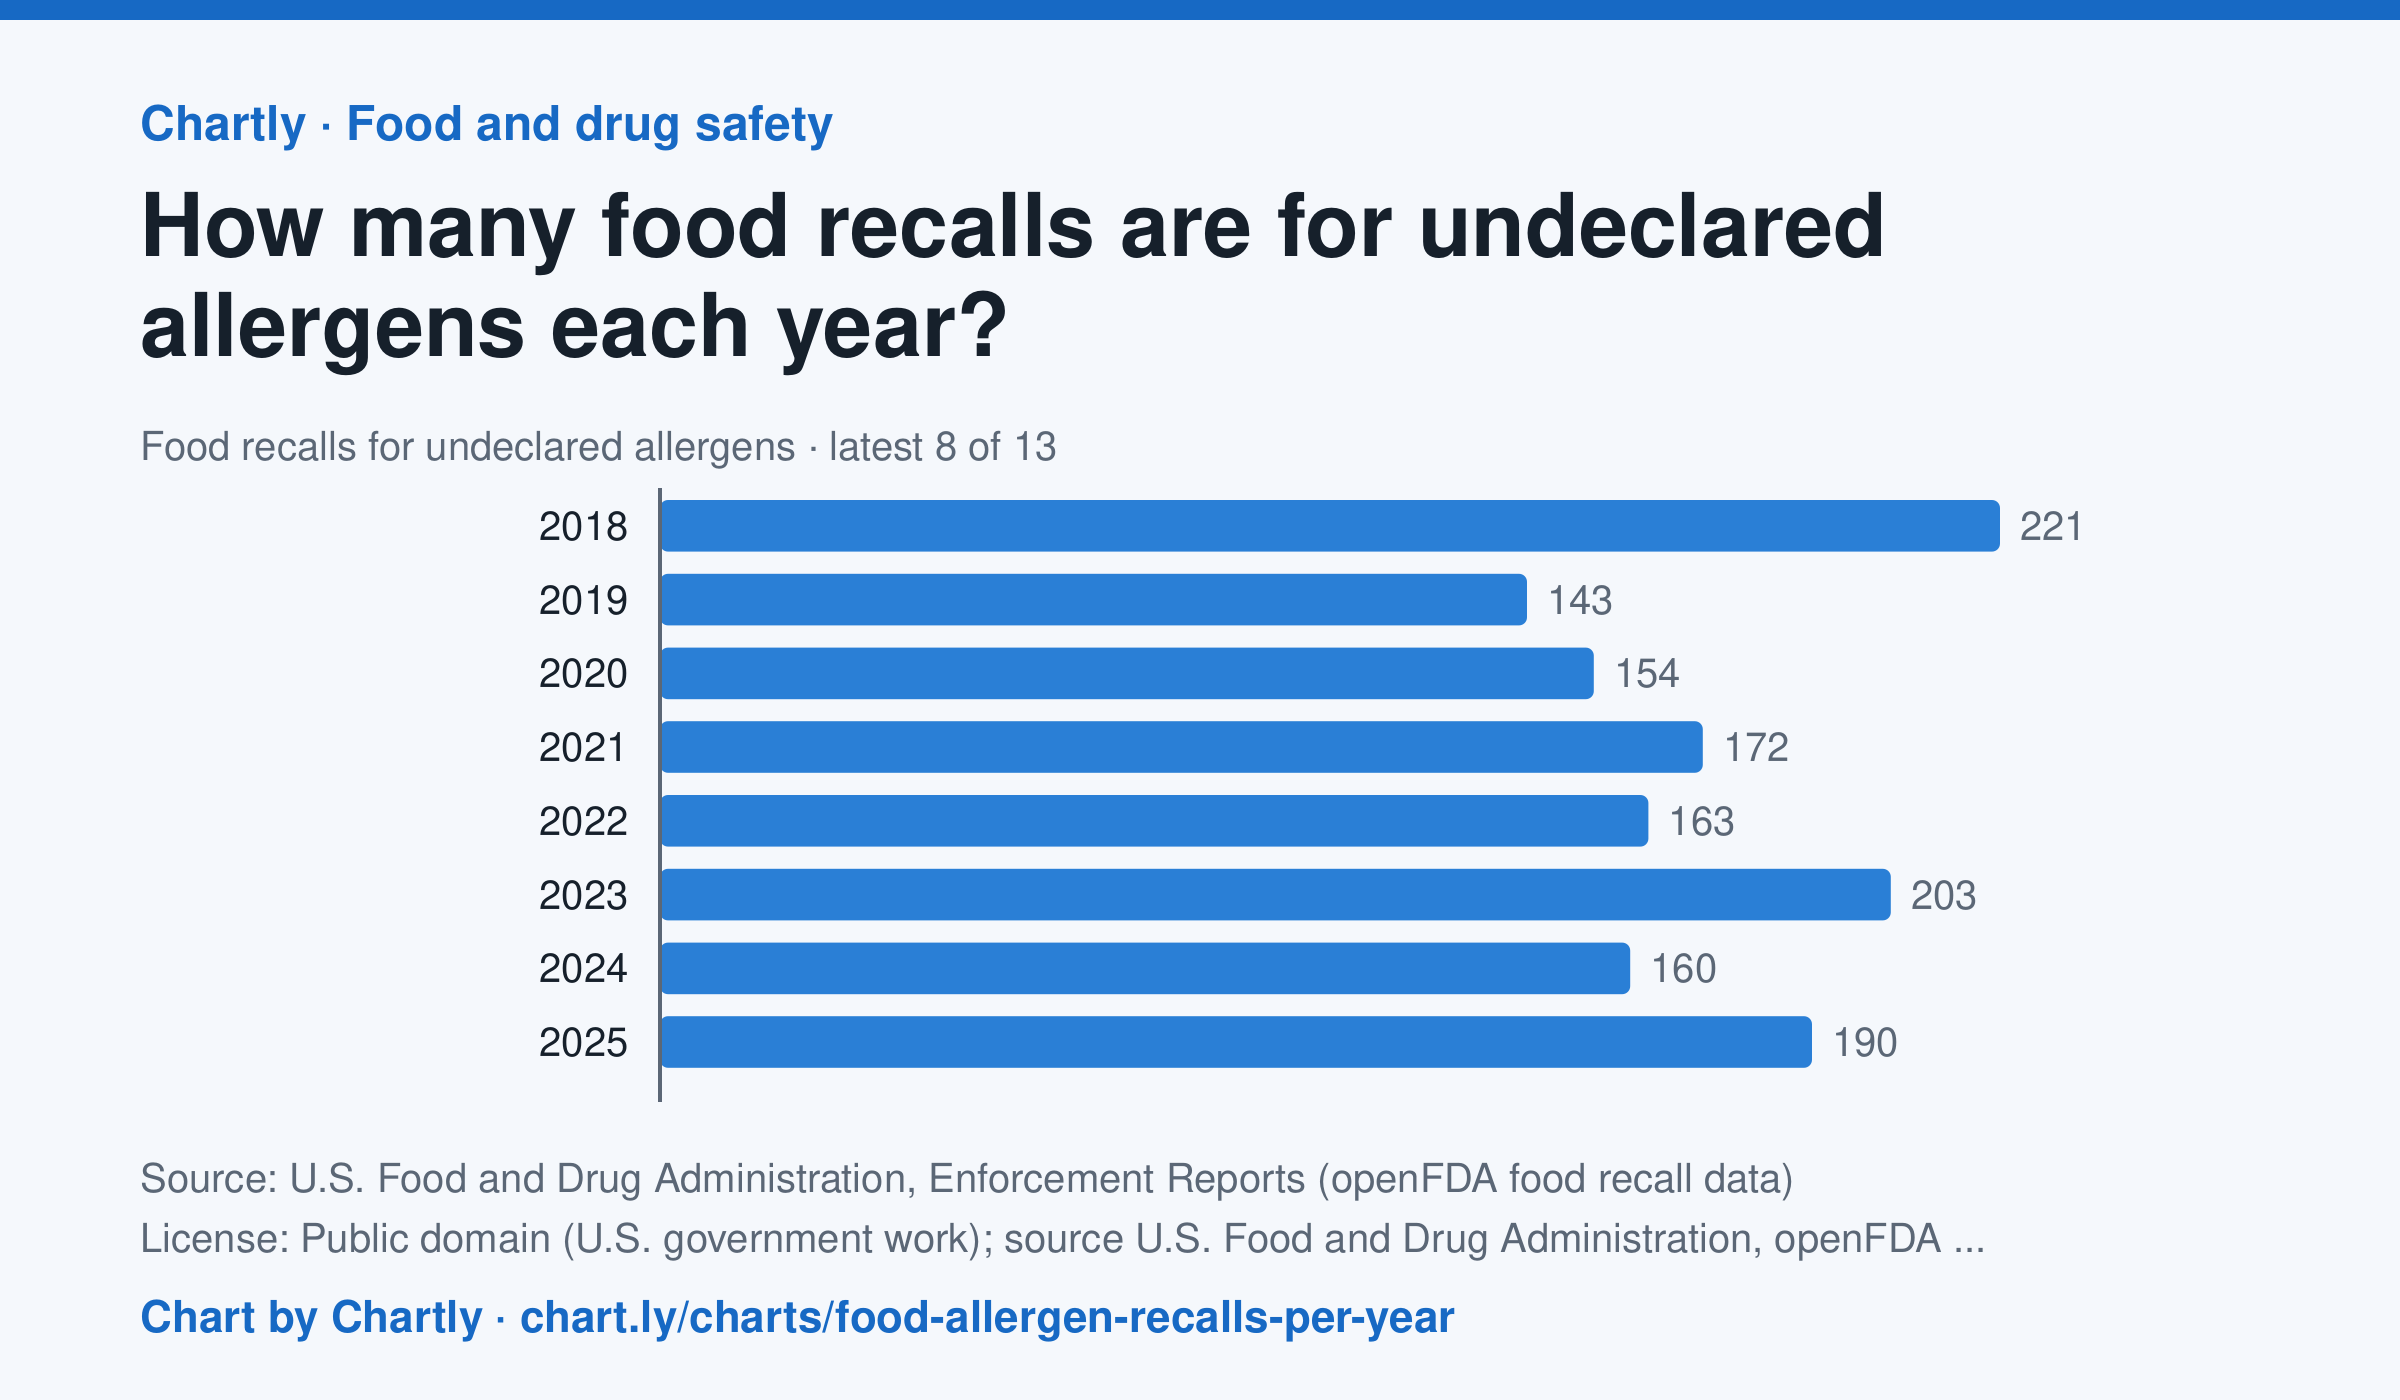
The FDA classified 190 food recalls in 2025 for an allergen left off the label, such as milk, peanuts, tree nuts, wheat, soy, eggs, fish, shellfish or sesame; the most since 2013 was 282 in 2017. From 2013 through 2025, undeclared allergens were the most common reason food was recalled. A recall counts once however many products it covers, in the year FDA first listed it in its weekly Enforcement Report. Chartly sorted FDA's written reasons by their key words; a recall for a germ as well counts under the germ. Meat, poultry and most egg products are USDA's to recall and aren't included. The newest allergen recalls, this year's included, are listed below.
Source: U.S. Food and Drug Administration, Enforcement Reports (openFDA food recall data) (Public domain (U.S. government work); source U.S. Food and Drug Administration, openFDA) · Data as of Nov 4, 2026
Questions
- In one sentence of your own, what does this chart show?
- Find the biggest change or difference in the chart. What might explain it?
- Who collected these numbers, and how recent are they? What else would you want to know before drawing a conclusion?
Chart and numbers: chart.ly/charts/food-allergen-recalls-per-year · More free charts at chart.ly
Chart 2 of 2 · Climate
How much has the US warmed since 1895?
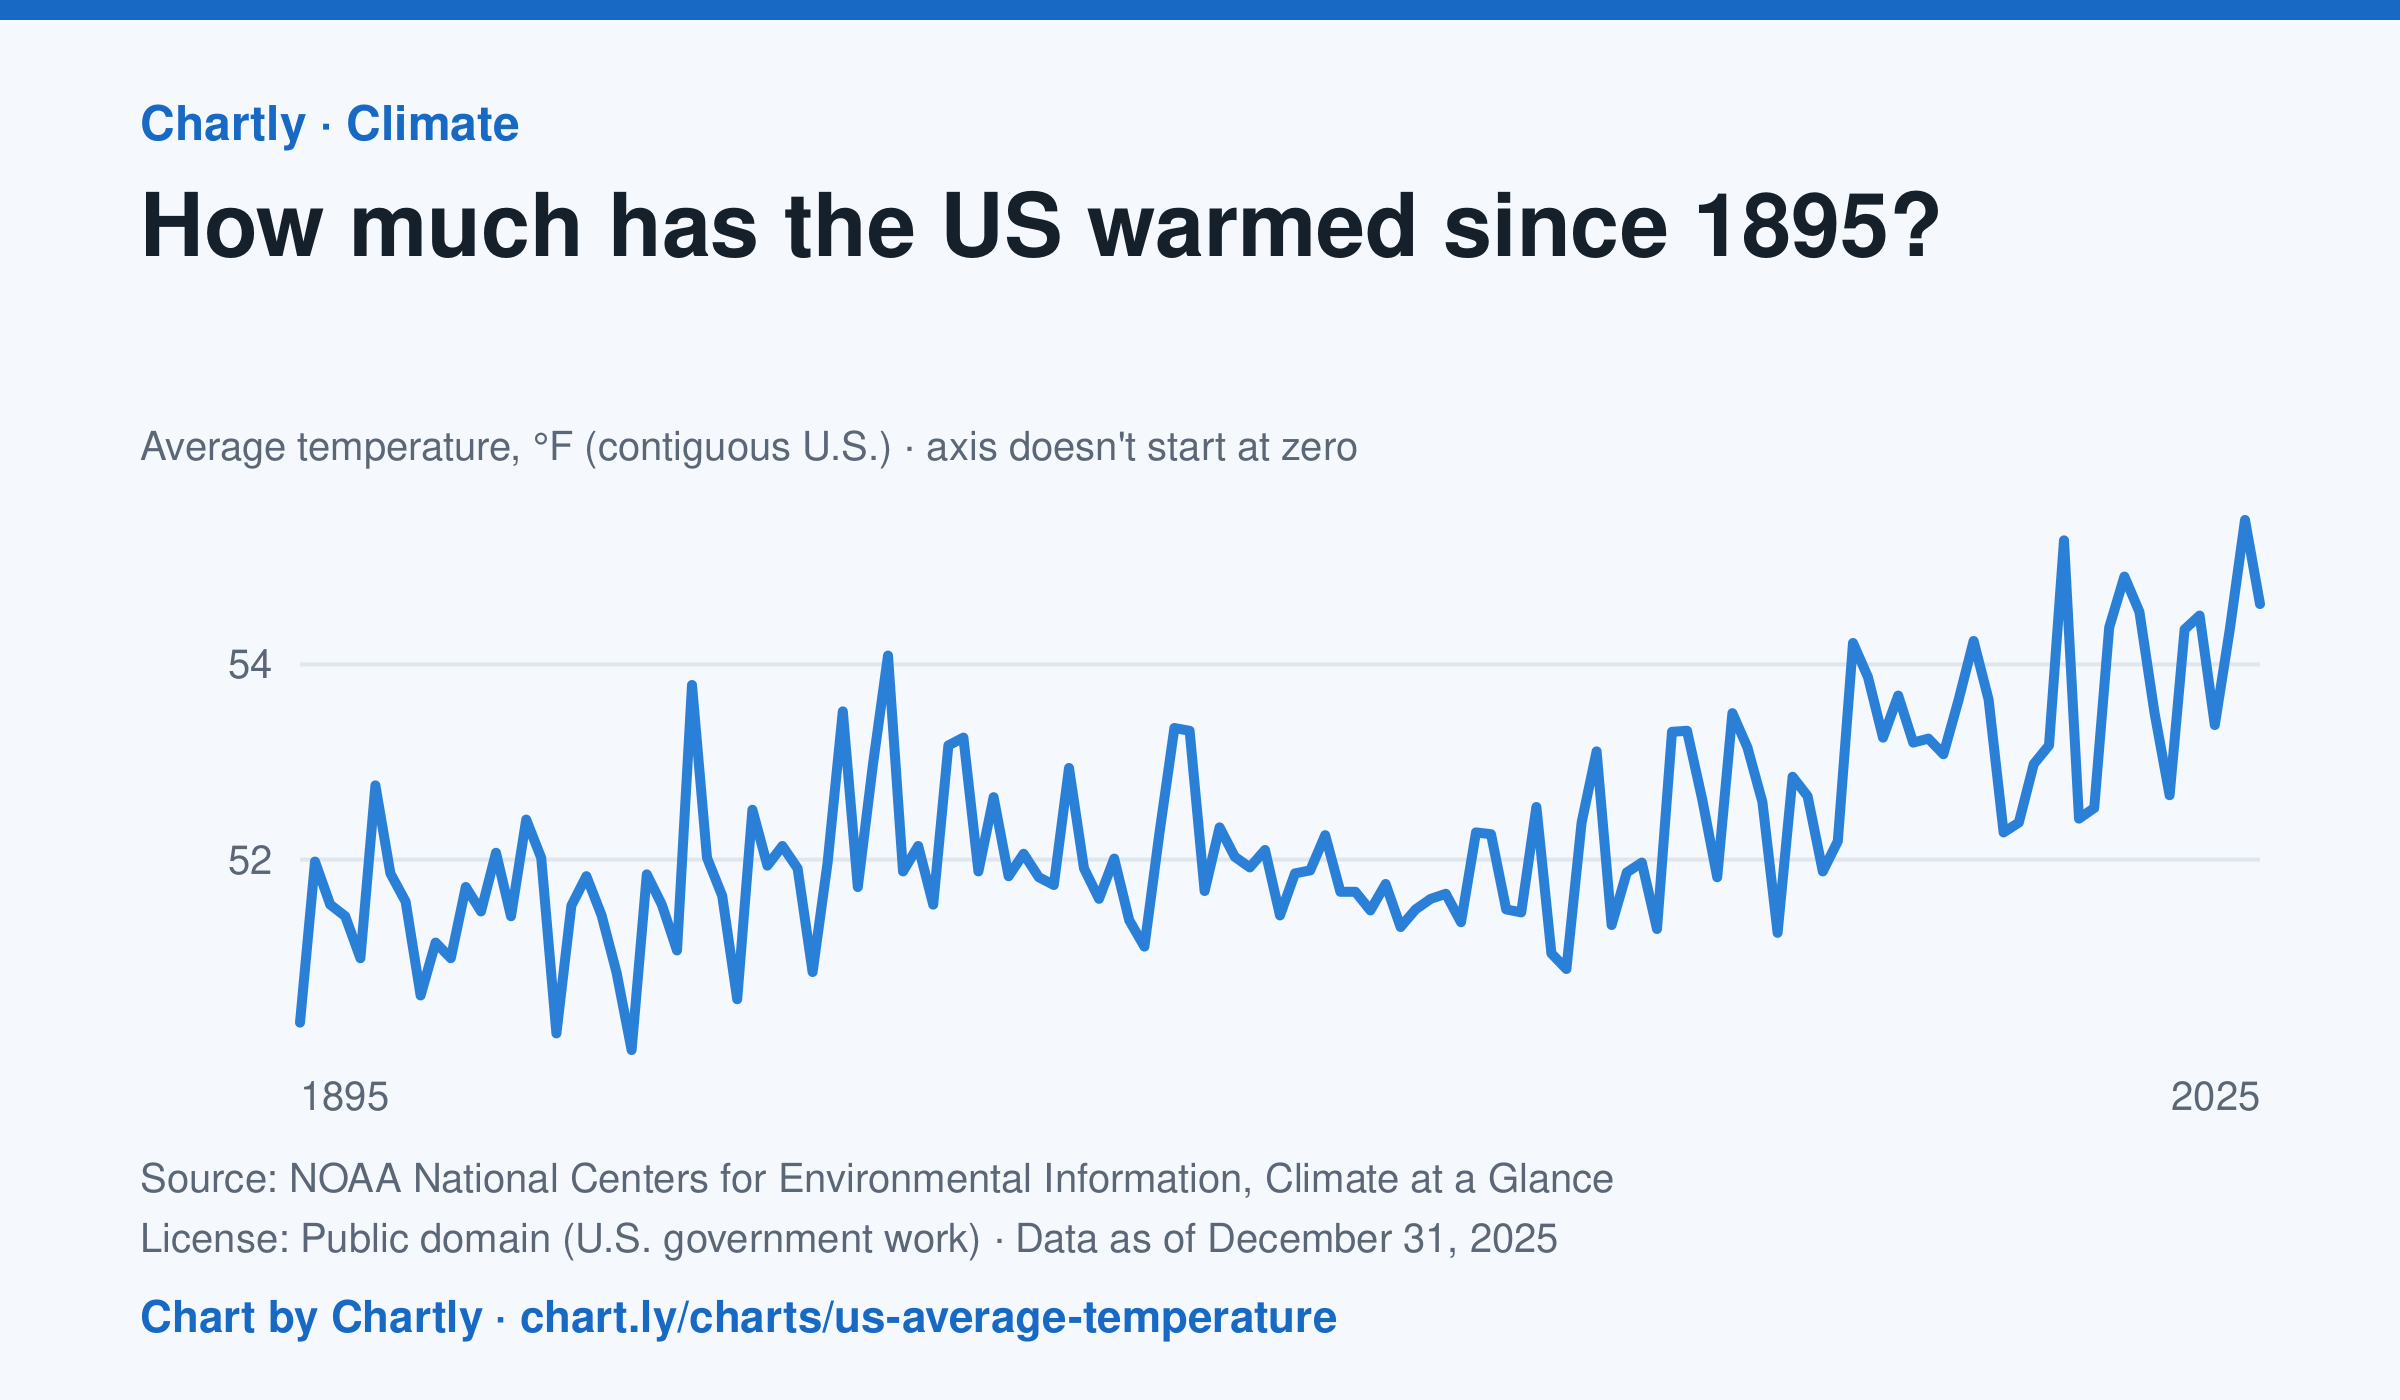
The contiguous US averaged 54.6°F in 2025. The warmest year since records began in 1895 was 2024, at 55.5°F. Through 2025, the dashed trend line, the straight line that best fits every year, rose about 0.18°F a decade, or 2.3°F since 1895, and warming had sped up to about 0.5°F a decade since 1970. Alaska and Hawaii aren't included.
Source: NOAA National Centers for Environmental Information, Climate at a Glance (Public domain (U.S. government work)) · Data as of Dec 31, 2025
How to read this chart
Each point is one year's average temperature across the lower 48 states, in degrees Fahrenheit. The axis doesn't start at zero, so a small rise looks steep: read the numbers on the axis, not the height of the line. The dashed line is the trend, the straight line that best fits every year; single years bounce above and below it.
Questions
- Find the warmest and coolest years on the chart. How many degrees apart are they?
- Why might one year be much cooler than the year before, even while the trend line keeps rising?
- The axis doesn't start at zero here, but bar charts always do. Why is that fair for temperatures but not for bars?
Chart and numbers: chart.ly/charts/us-average-temperature · More free charts at chart.ly