Print this worksheet, or choose "Save as PDF" in the print window to share a file.
Chart worksheet
Charts to read and discuss
Name:
Class:
Date:
Chart 1 of 3 · Food and drug safety
How many food recalls are for undeclared allergens each year?
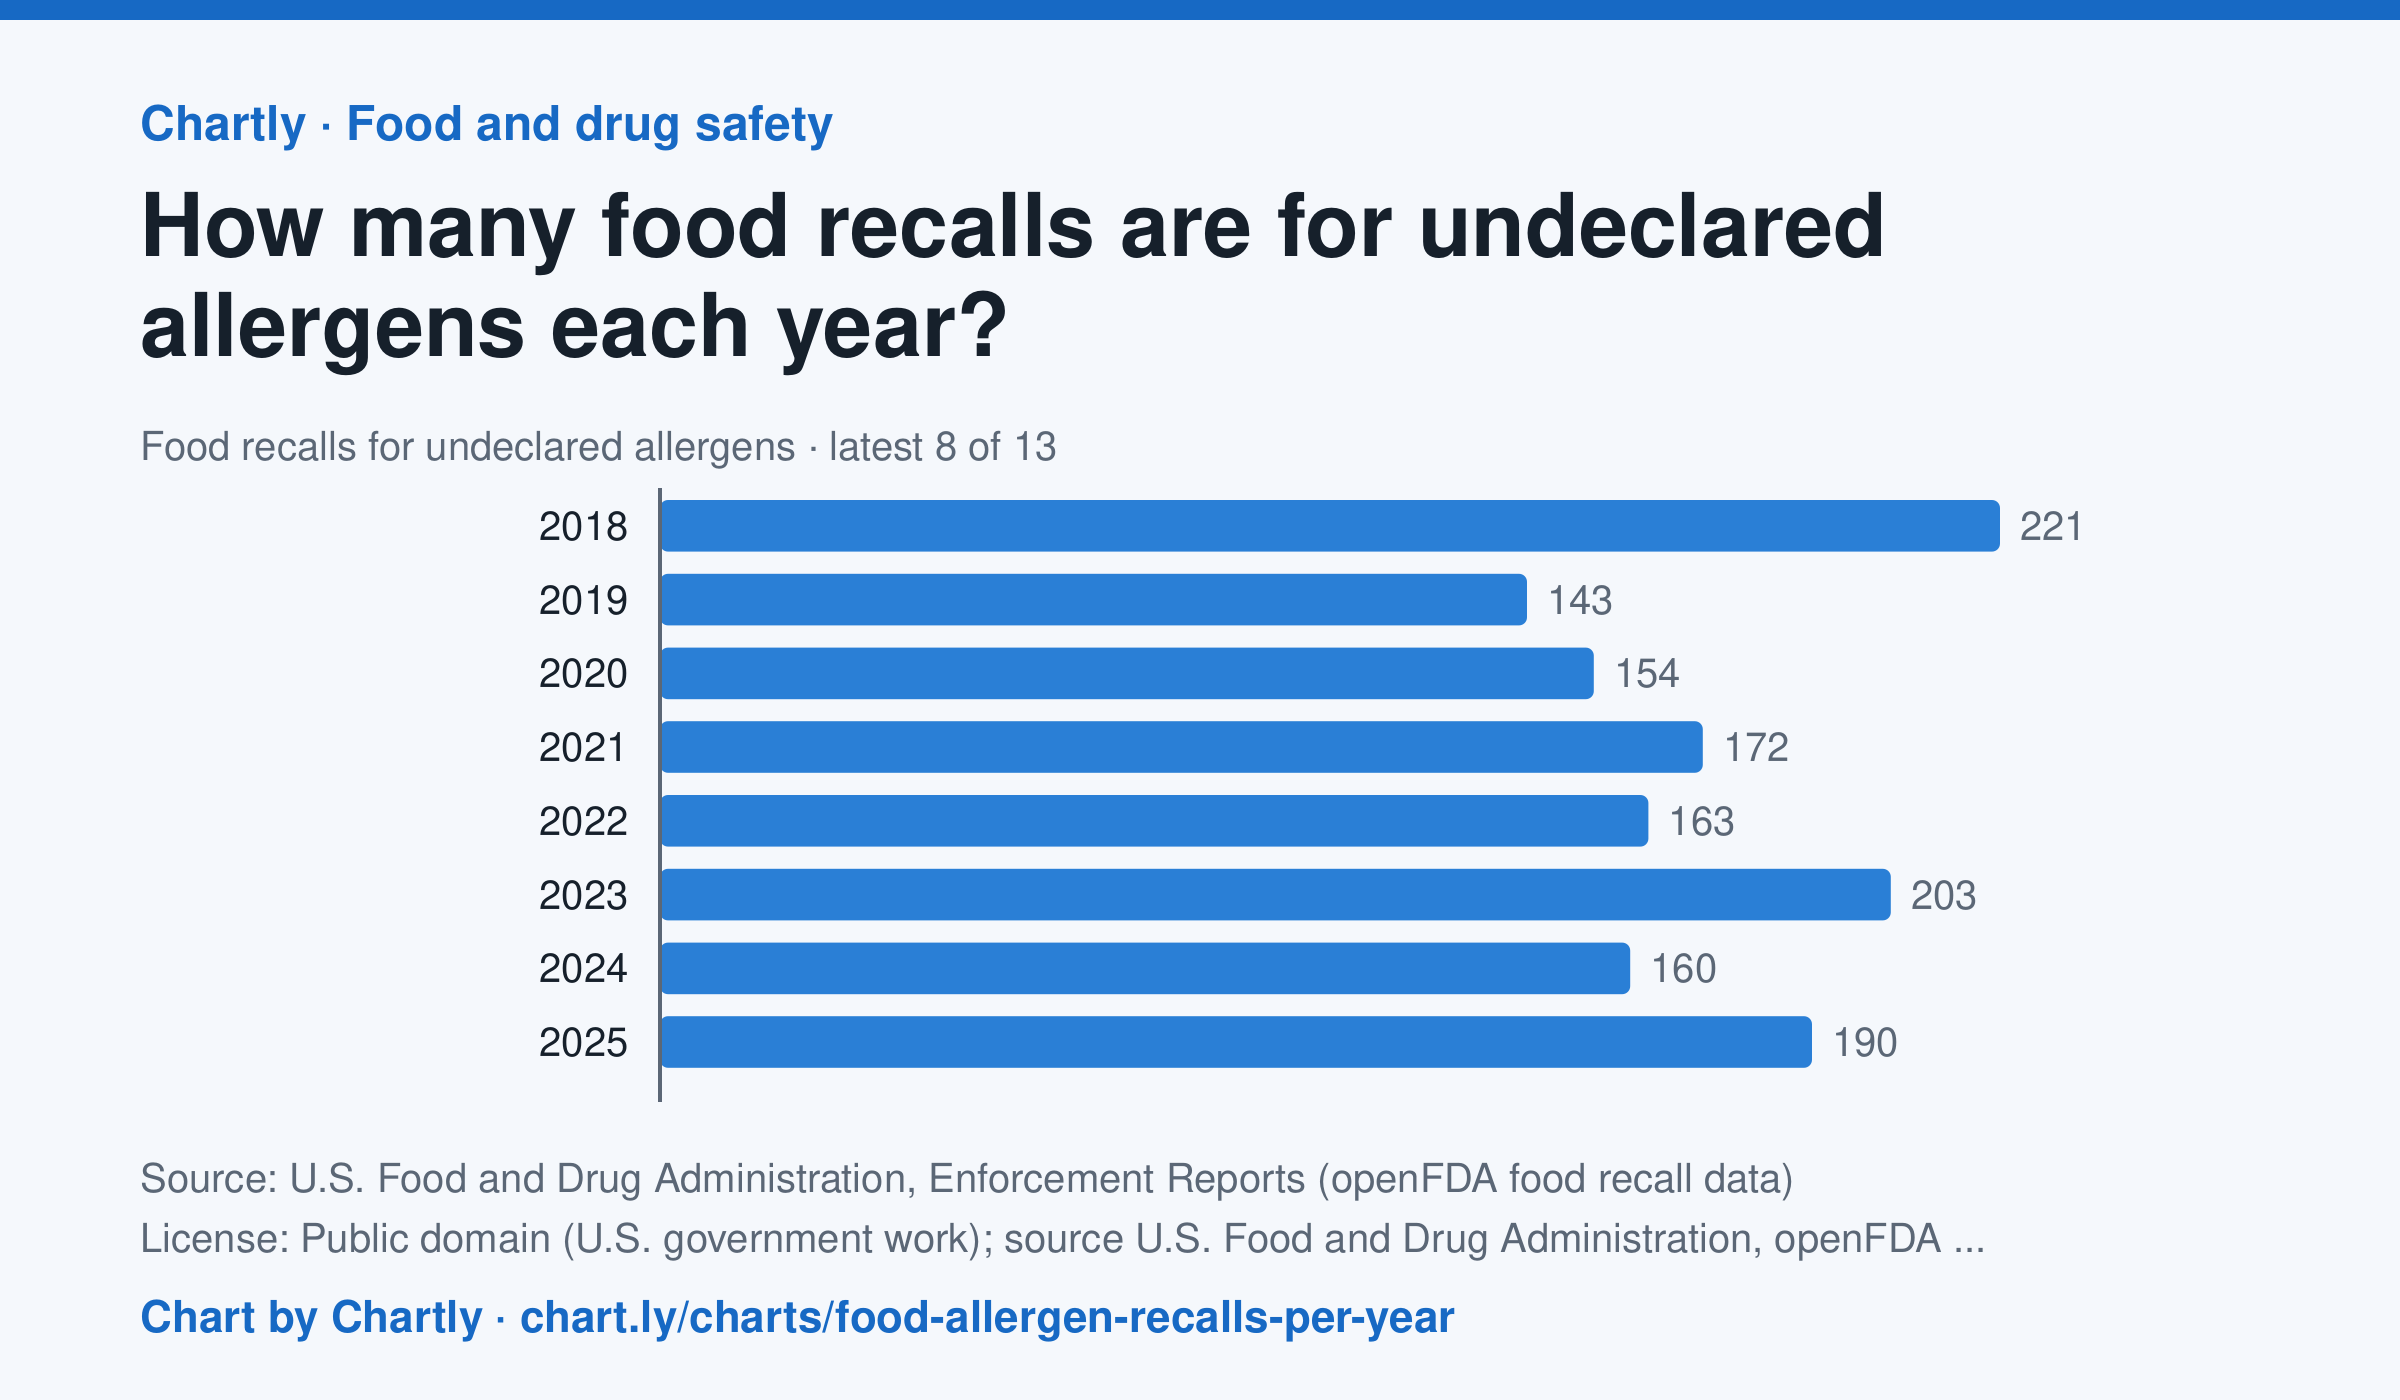
The FDA classified 190 food recalls in 2025 for an allergen left off the label, such as milk, peanuts, tree nuts, wheat, soy, eggs, fish, shellfish or sesame; the most since 2013 was 282 in 2017. From 2013 through 2025, undeclared allergens were the most common reason food was recalled. A recall counts once however many products it covers, in the year FDA first listed it in its weekly Enforcement Report. Chartly sorted FDA's written reasons by their key words; a recall for a germ as well counts under the germ. Meat, poultry and most egg products are USDA's to recall and aren't included. The newest allergen recalls, this year's included, are listed below.
Source: U.S. Food and Drug Administration, Enforcement Reports (openFDA food recall data) (Public domain (U.S. government work); source U.S. Food and Drug Administration, openFDA) · Data as of Nov 4, 2026
Questions
- In one sentence of your own, what does this chart show?
- Find the biggest change or difference in the chart. What might explain it?
- Who collected these numbers, and how recent are they? What else would you want to know before drawing a conclusion?
Chart and numbers: chart.ly/charts/food-allergen-recalls-per-year · More free charts at chart.ly
Chart 2 of 3 · Earthquakes
How much rarer is each step up in earthquake magnitude?
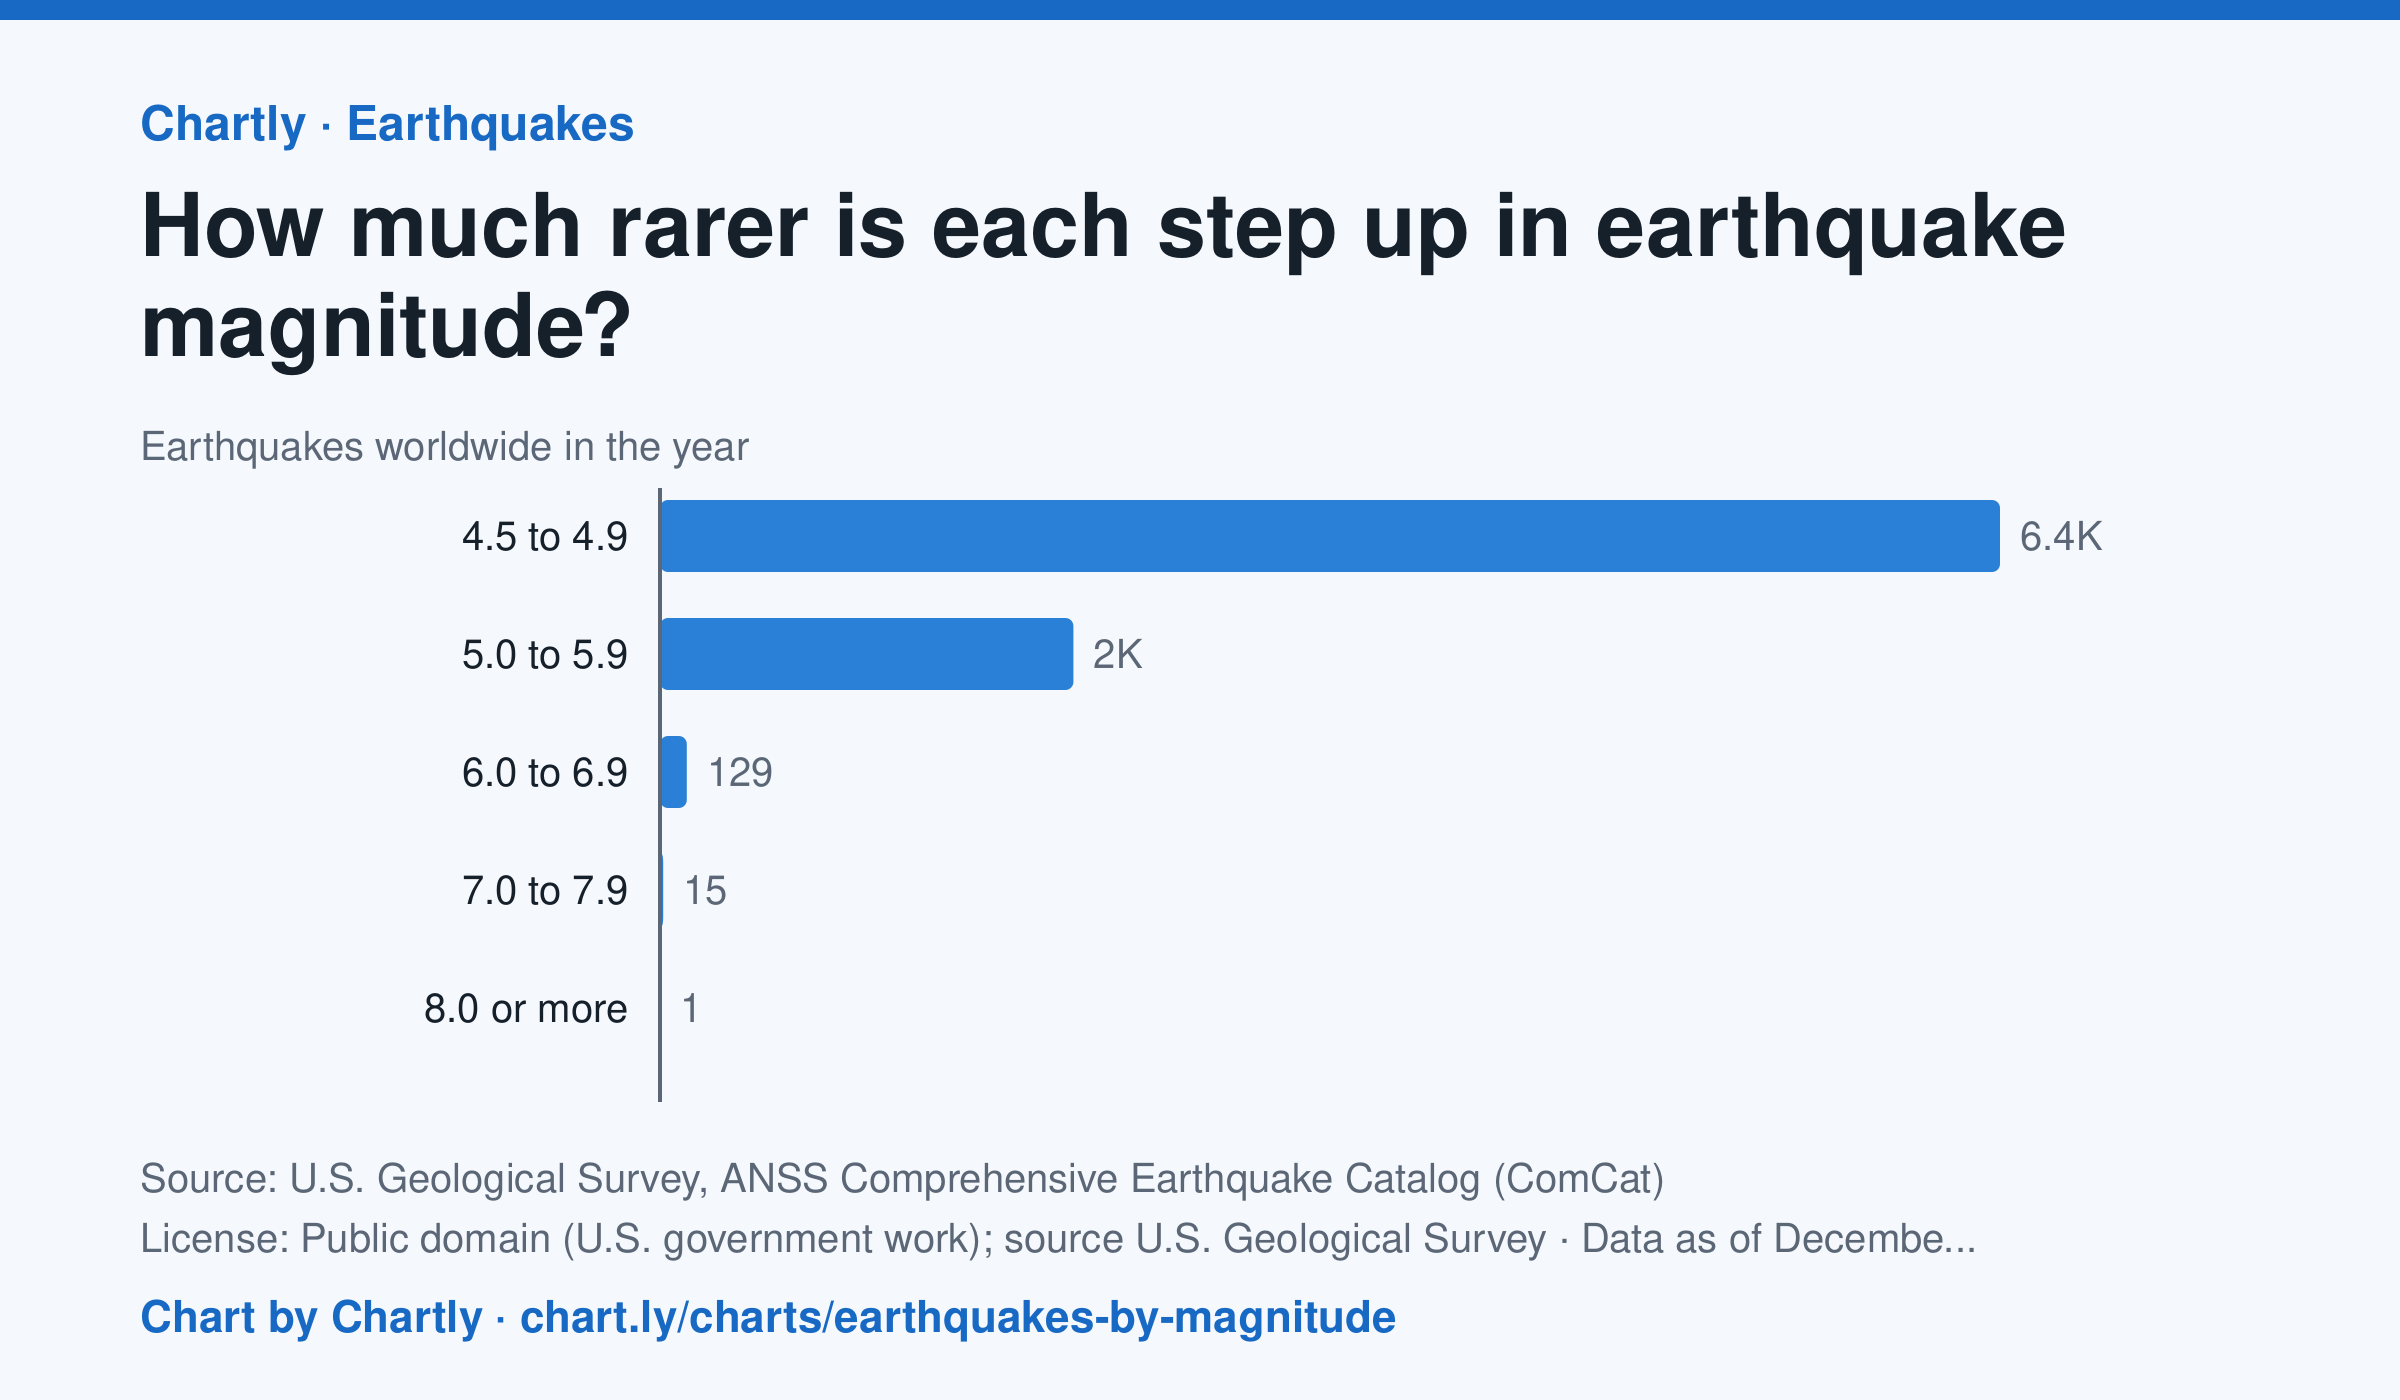
In 2025 the world recorded 6,428 earthquakes of magnitude 4.5 to 4.9, 1,983 of magnitude 5, 129 of magnitude 6, 15 of magnitude 7 and 1 of magnitude 8 or more. Each step up in magnitude is roughly ten times rarer, and releases about 32 times more energy. Countless smaller quakes go unrecorded worldwide, so the chart starts at 4.5.
Source: U.S. Geological Survey, ANSS Comprehensive Earthquake Catalog (ComCat) (Public domain (U.S. government work); source U.S. Geological Survey) · Data as of Dec 31, 2025
How to read this chart
Each bar counts the earthquakes recorded worldwide in one year within a range of magnitudes. The bars start at zero. Each whole step up in magnitude releases about 32 times more energy, so a magnitude 7 quake is far more than one step stronger than a 6.
Questions
- Roughly how many times more common is each band than the one above it?
- The biggest bars are hard to compare with the smallest ones on this scale. What other way could you show these numbers?
- The chart starts at magnitude 4.5. Why might smaller earthquakes around the world go uncounted?
Chart and numbers: chart.ly/charts/earthquakes-by-magnitude · More free charts at chart.ly
Chart 3 of 3 · World
How has the world's population grown since 1960?
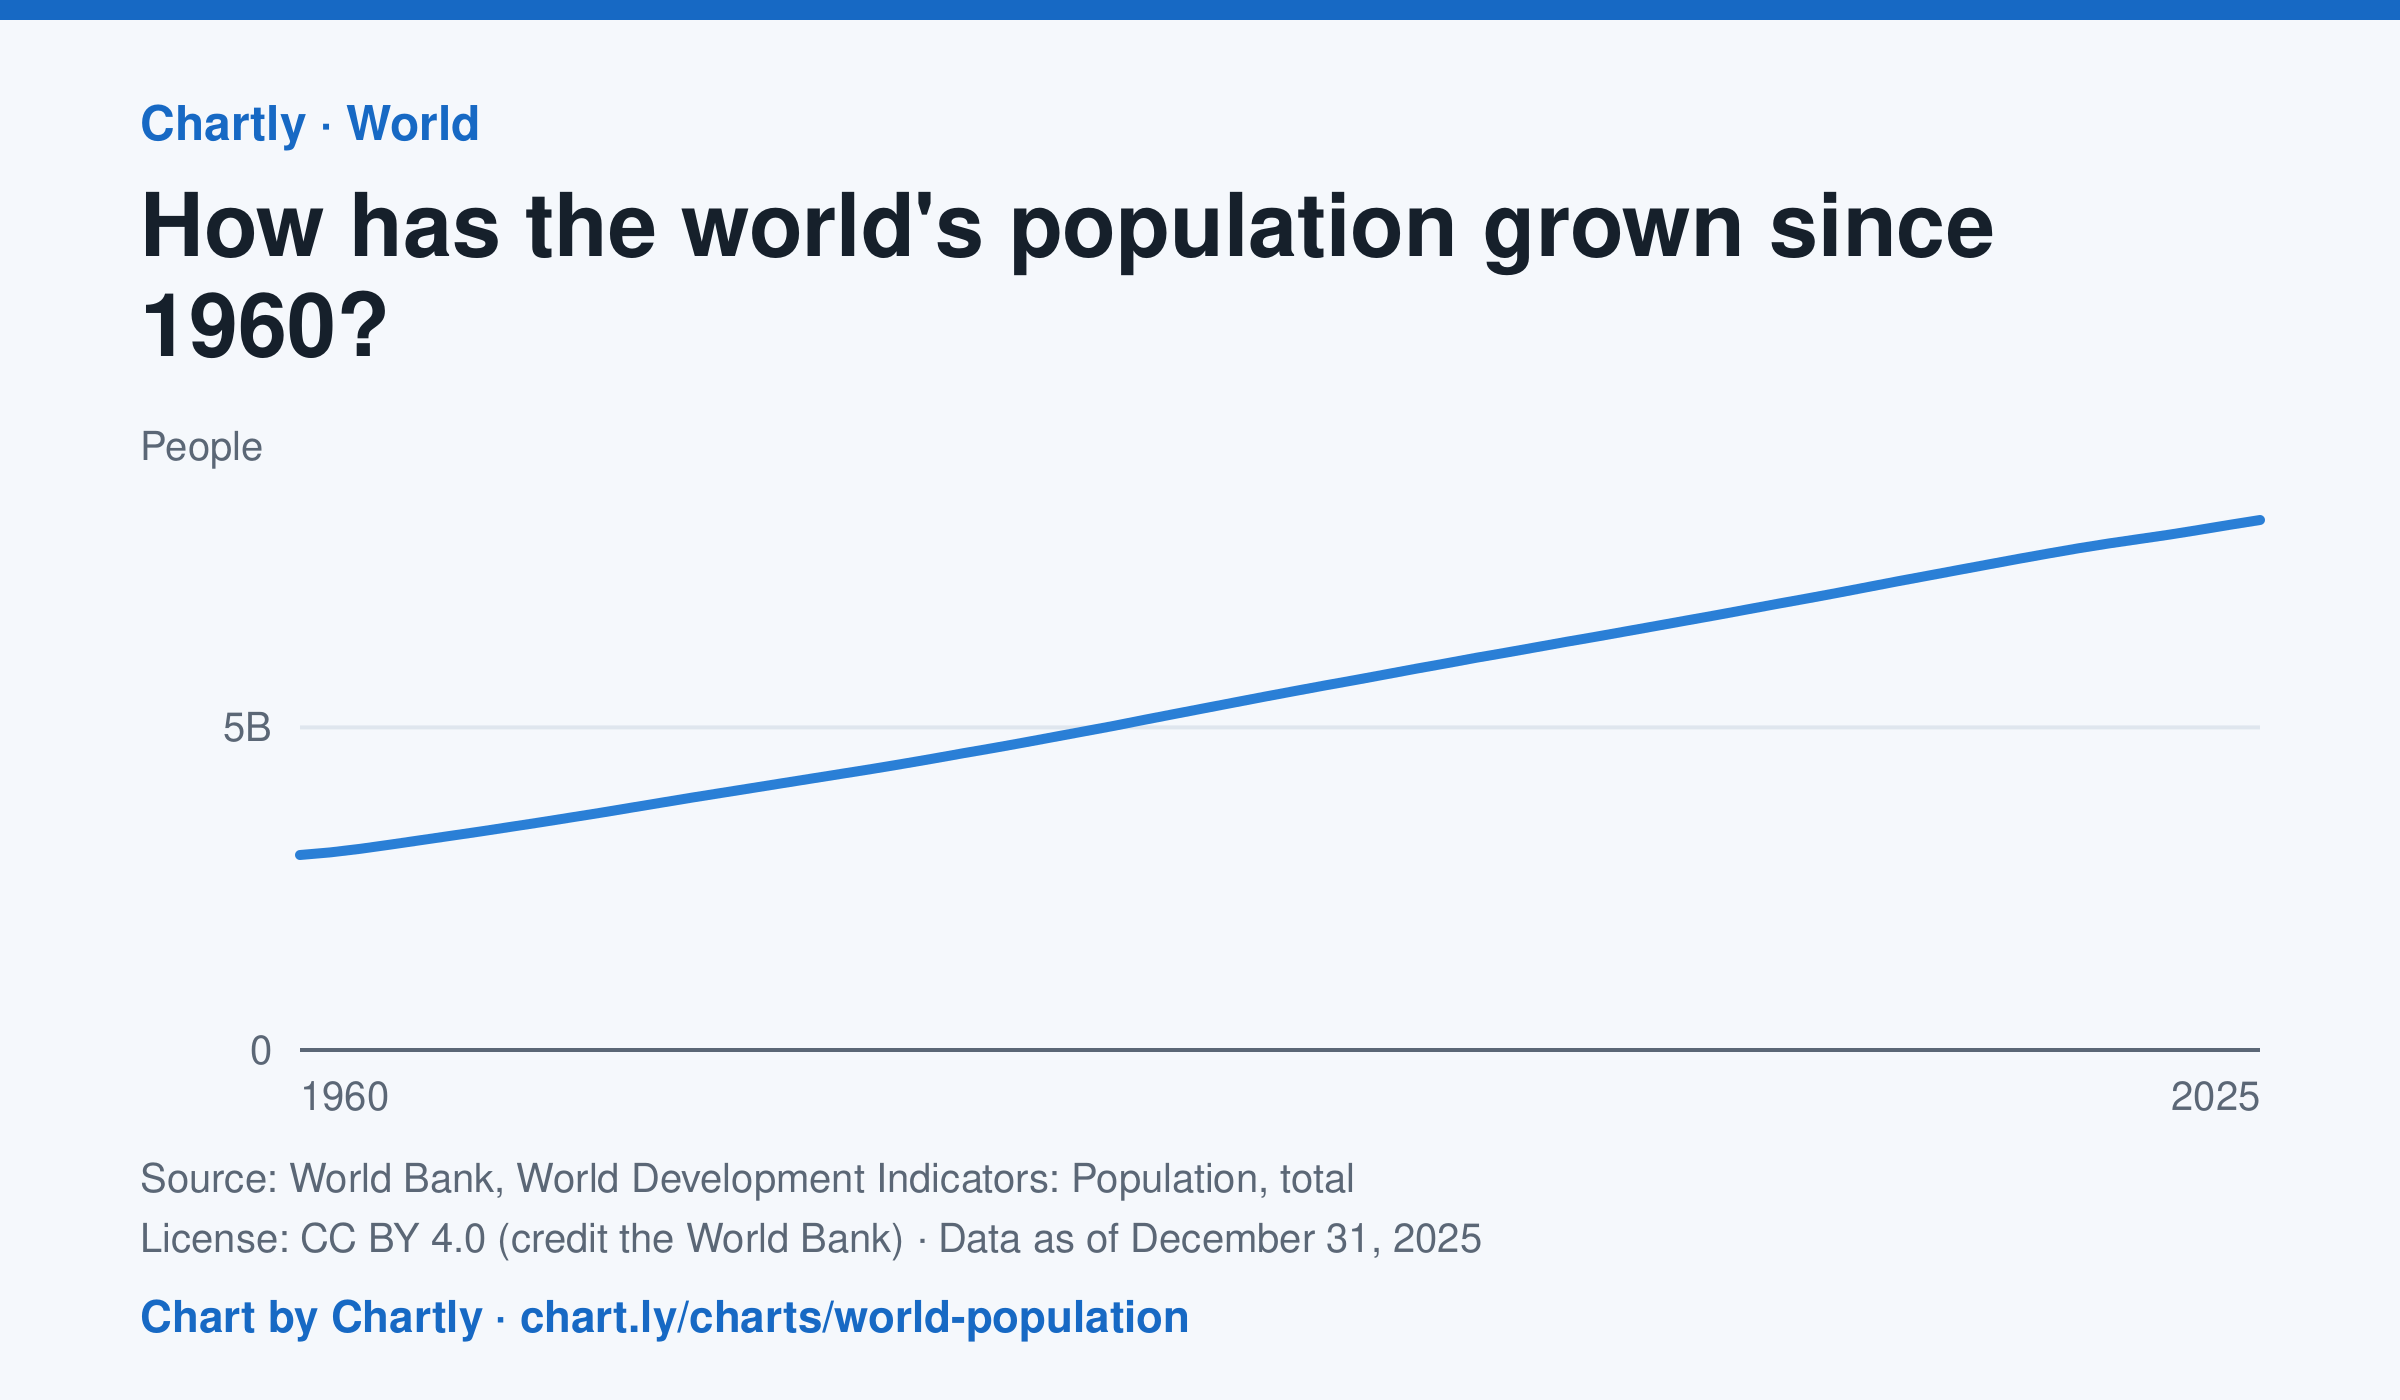
The world had 8.22 billion people in 2025, about 2.7 times the 3.02 billion of 1960. It passed 8 billion in 2023. Figures are mid-year estimates from the United Nations, which revises them as new censuses come in.
Source: World Bank, World Development Indicators: Population, total (CC BY 4.0 (credit the World Bank)) · Data as of Dec 31, 2025
How to read this chart
Each point is the number of people alive in the world in the middle of that year, estimated by the United Nations. The axis starts at zero, so the height of the line shows the true size. Look at how steep the line is to see how fast the population grew.
Questions
- Judging from the chart, about how many years did it take the world to add its most recent billion people?
- Is the line getting steeper or flatter in recent years? What does that tell you about the growth rate?
- These numbers are estimates that the UN revises. Why is it hard to count every person on Earth?
Chart and numbers: chart.ly/charts/world-population · More free charts at chart.ly