Print this worksheet, or choose "Save as PDF" in the print window to share a file.
Chart worksheet
Charts to read and discuss
Name:
Class:
Date:
Chart 1 of 3 · Federal budget
Where does federal spending go?
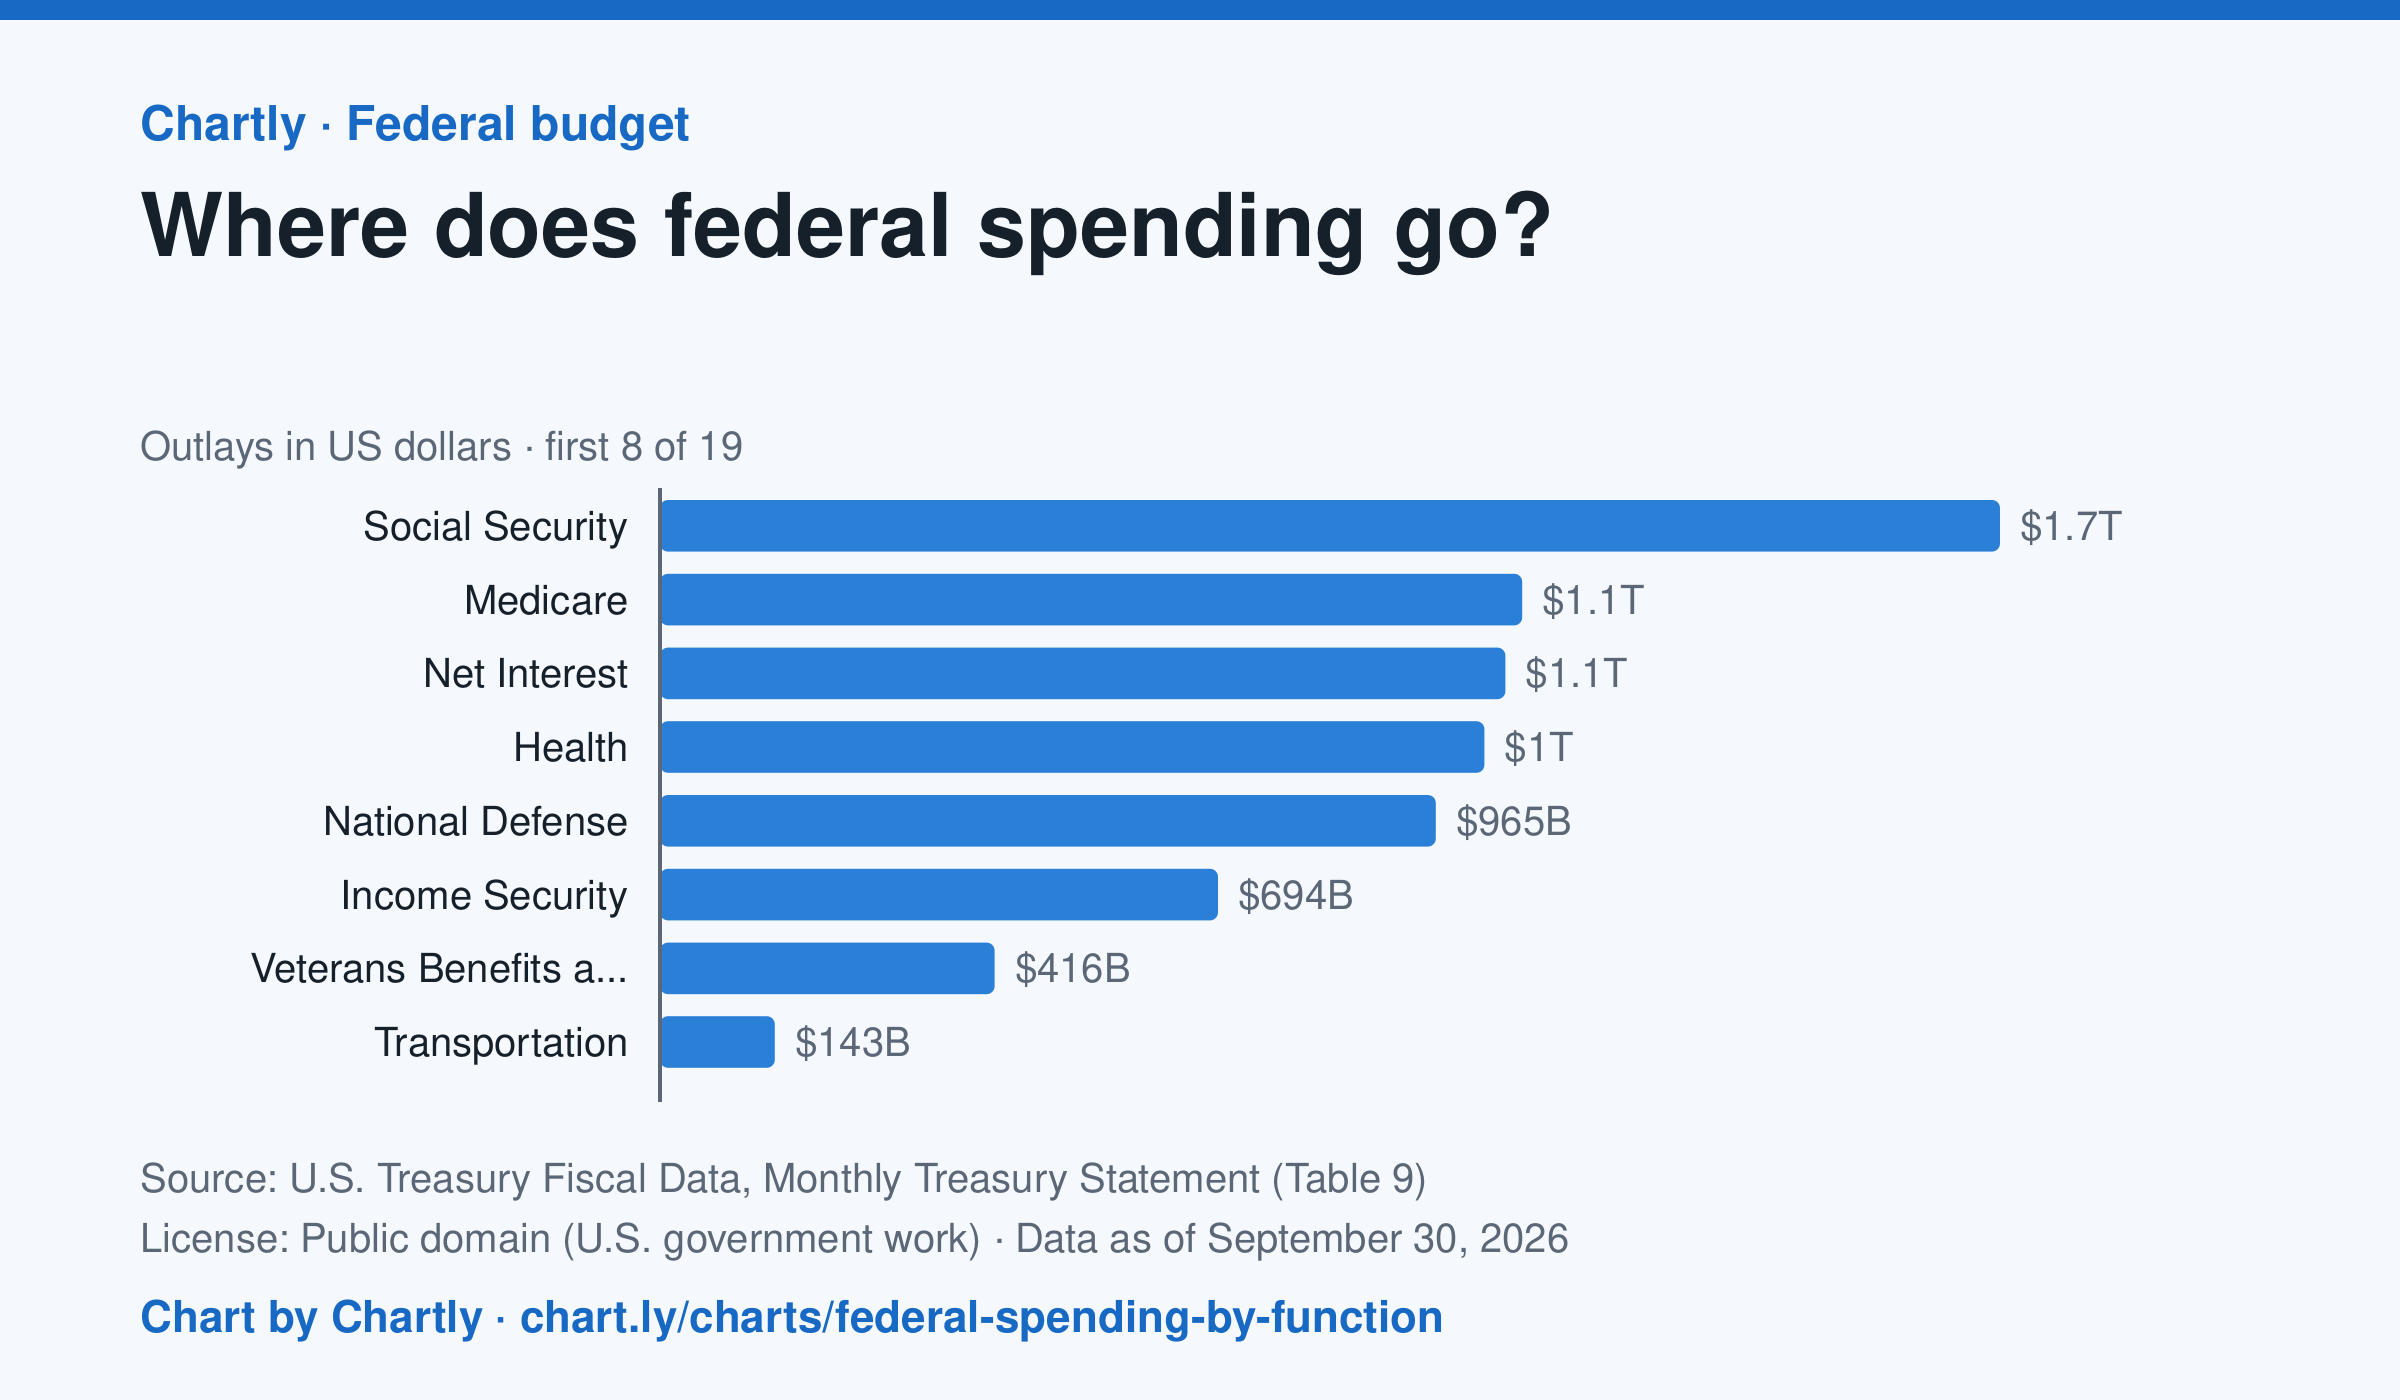
Social Security was the biggest item in fiscal 2026 at $1.67 trillion, out of $7.4 trillion in total. Next came Medicare ($1.07 trillion), Net Interest ($1.05 trillion), Health ($1.03 trillion) and National Defense ($965 billion). Two accounting lines are below zero, so the bars add up to the total.
Source: U.S. Treasury Fiscal Data, Monthly Treasury Statement (Table 9) (Public domain (U.S. government work)) · Data as of Sep 30, 2026
How to read this chart
Each bar is how much the federal government spent on one area in a fiscal year, which runs from October to September. The axis shows dollars: 1T is a trillion dollars, a thousand billion. One bar is below zero because it counts money the government takes back in, such as payments agencies make to each other, which lowers the total.
Questions
- Which area gets the most money? About how many times more than the smallest positive bar?
- Which of the biggest areas are paid to people directly, like retirees and patients, and which pay for services?
- If Congress wanted to cut spending by a lot, which bars would it have to change, and why is that hard?
Chart and numbers: chart.ly/charts/federal-spending-by-function · More free charts at chart.ly
Chart 2 of 3 · Inflation
How much does a dozen eggs cost in the US?
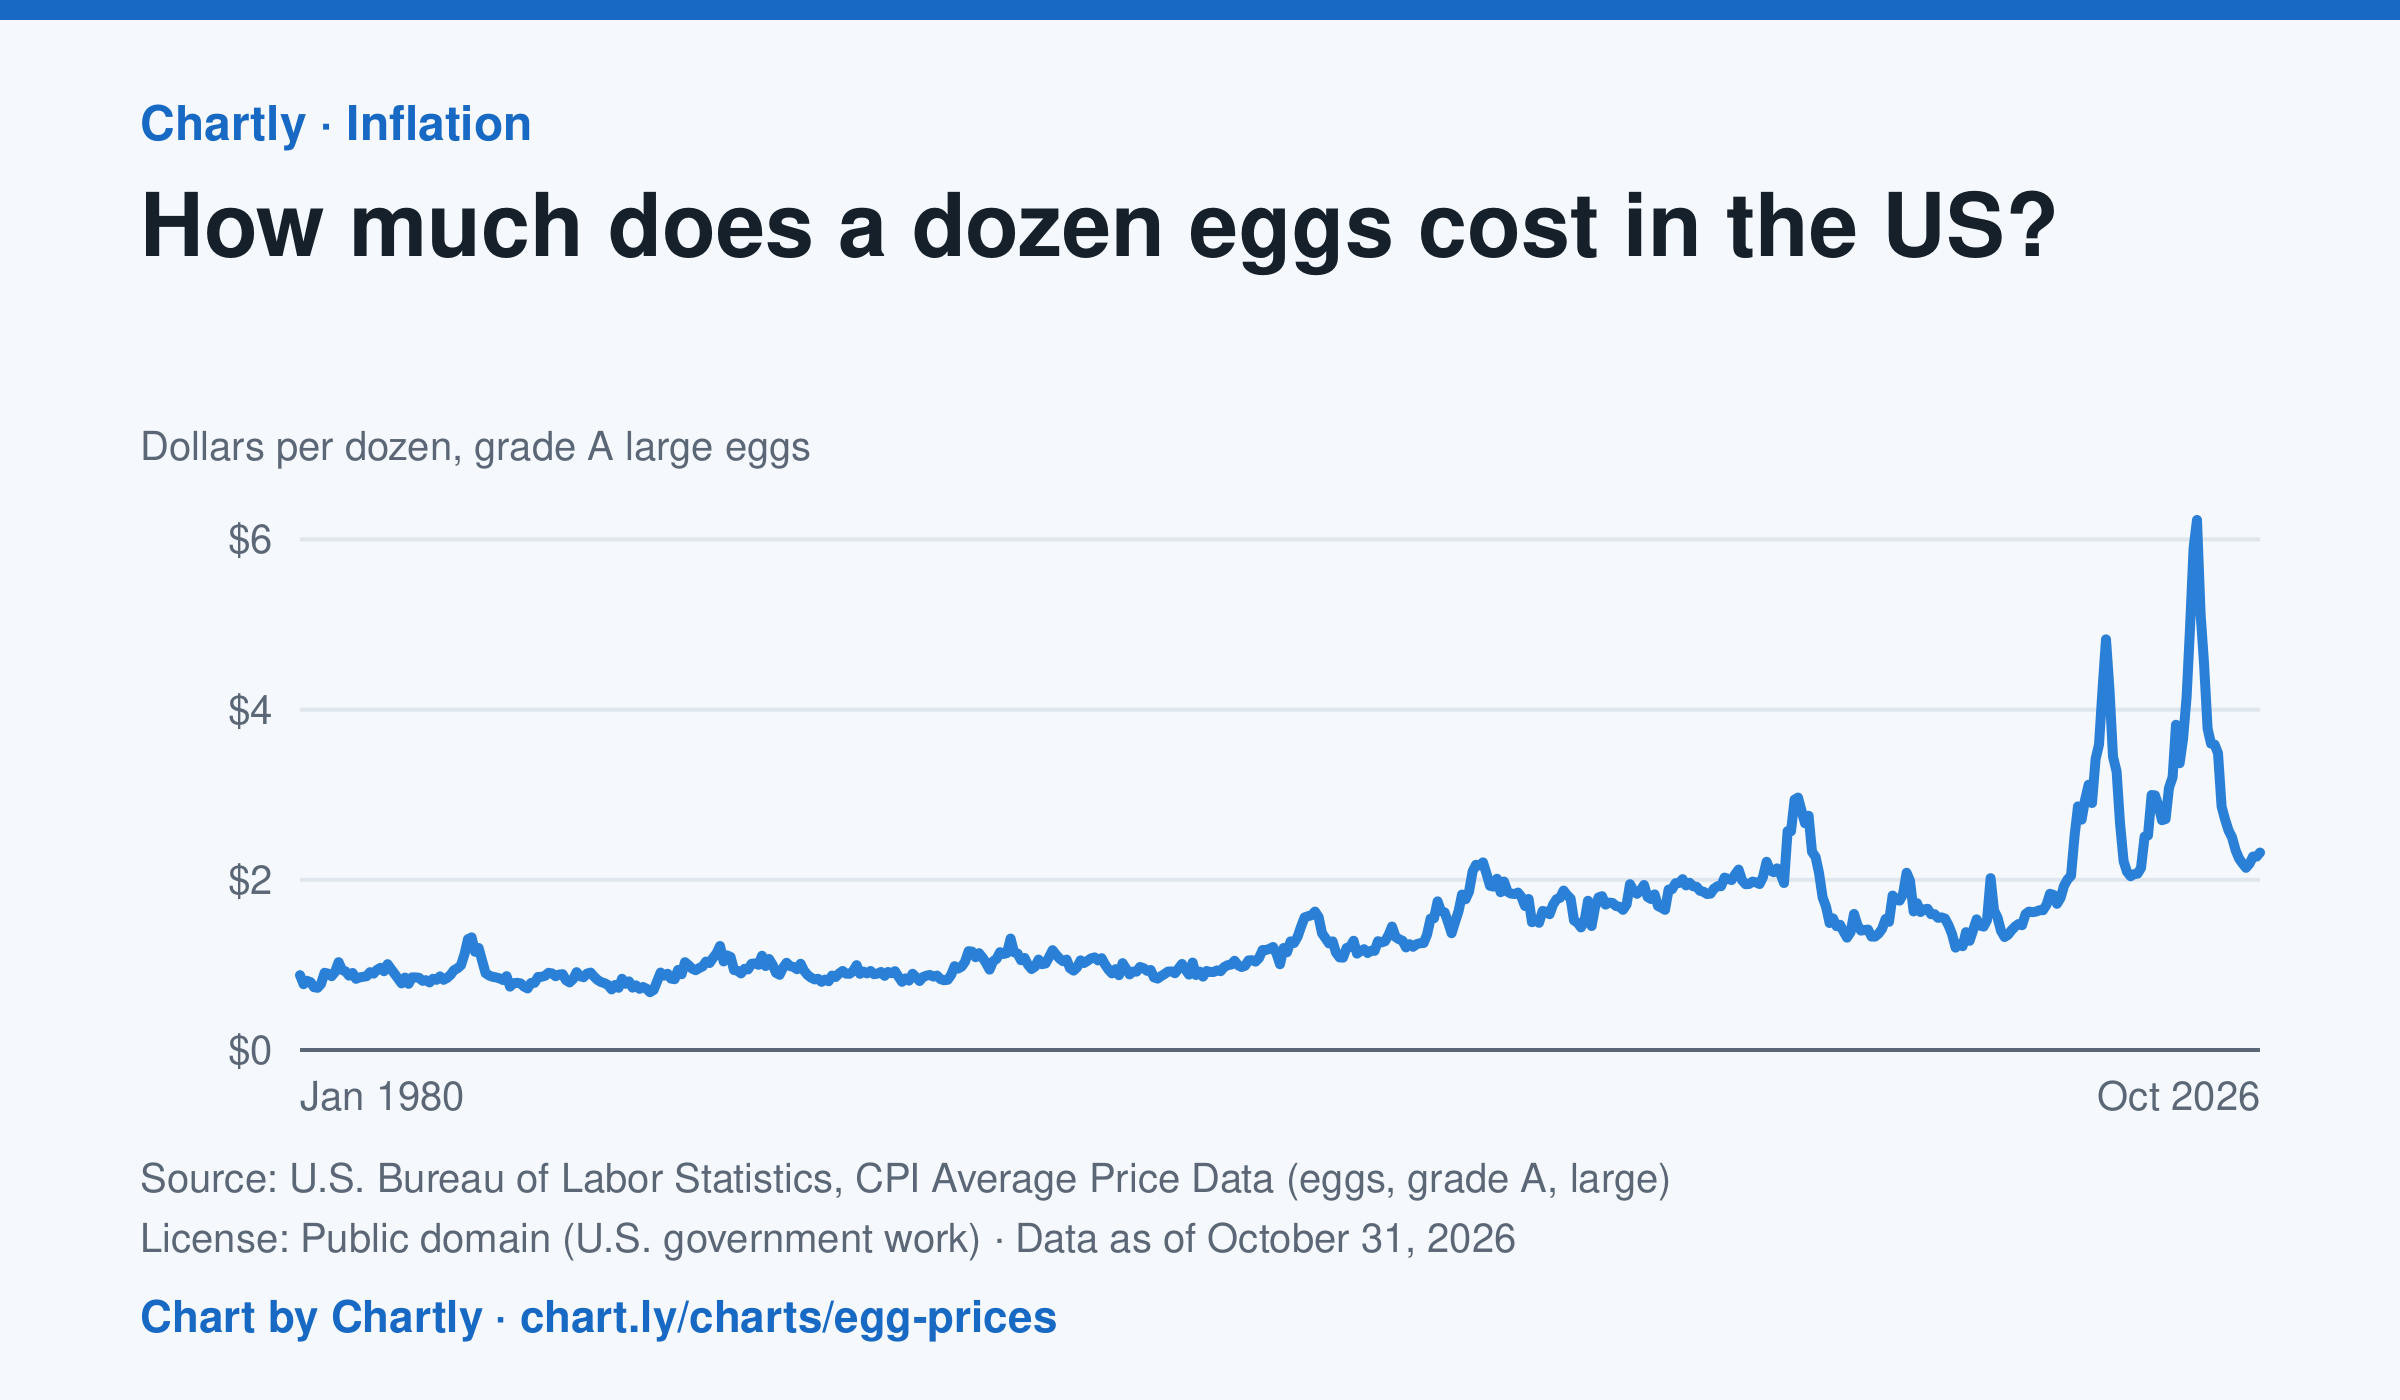
A dozen grade A large eggs averaged $2.32 in October 2026. The record so far is $6.23 in March 2025; prices spiked in 2023 and 2025 when bird flu cut the number of laying hens. Prices are BLS averages across US cities since 1980, when this series begins, in dollars of the day, not adjusted for inflation. October 2025 is missing because a lapse in federal funding stopped data collection.
Source: U.S. Bureau of Labor Statistics, CPI Average Price Data (eggs, grade A, large) (Public domain (U.S. government work)) · Data as of Oct 31, 2026
How to read this chart
Each point is the average price of a dozen grade A large eggs in U.S. cities in one month, in dollars. The axis starts at zero, so the height of the line shows the true price. Spikes often come when bird flu forces farms to lose laying hens, which cuts the supply of eggs.
Questions
- What was the highest price on the chart, and how many times more is it than the lowest?
- Showing your work, by what percent did the price change from the first month on the chart to the newest?
- When fewer hens are laying eggs but people want just as many, what happens to the price, and why?
Chart and numbers: chart.ly/charts/egg-prices · More free charts at chart.ly
Chart 3 of 3 · Health
What do Americans die of most often?
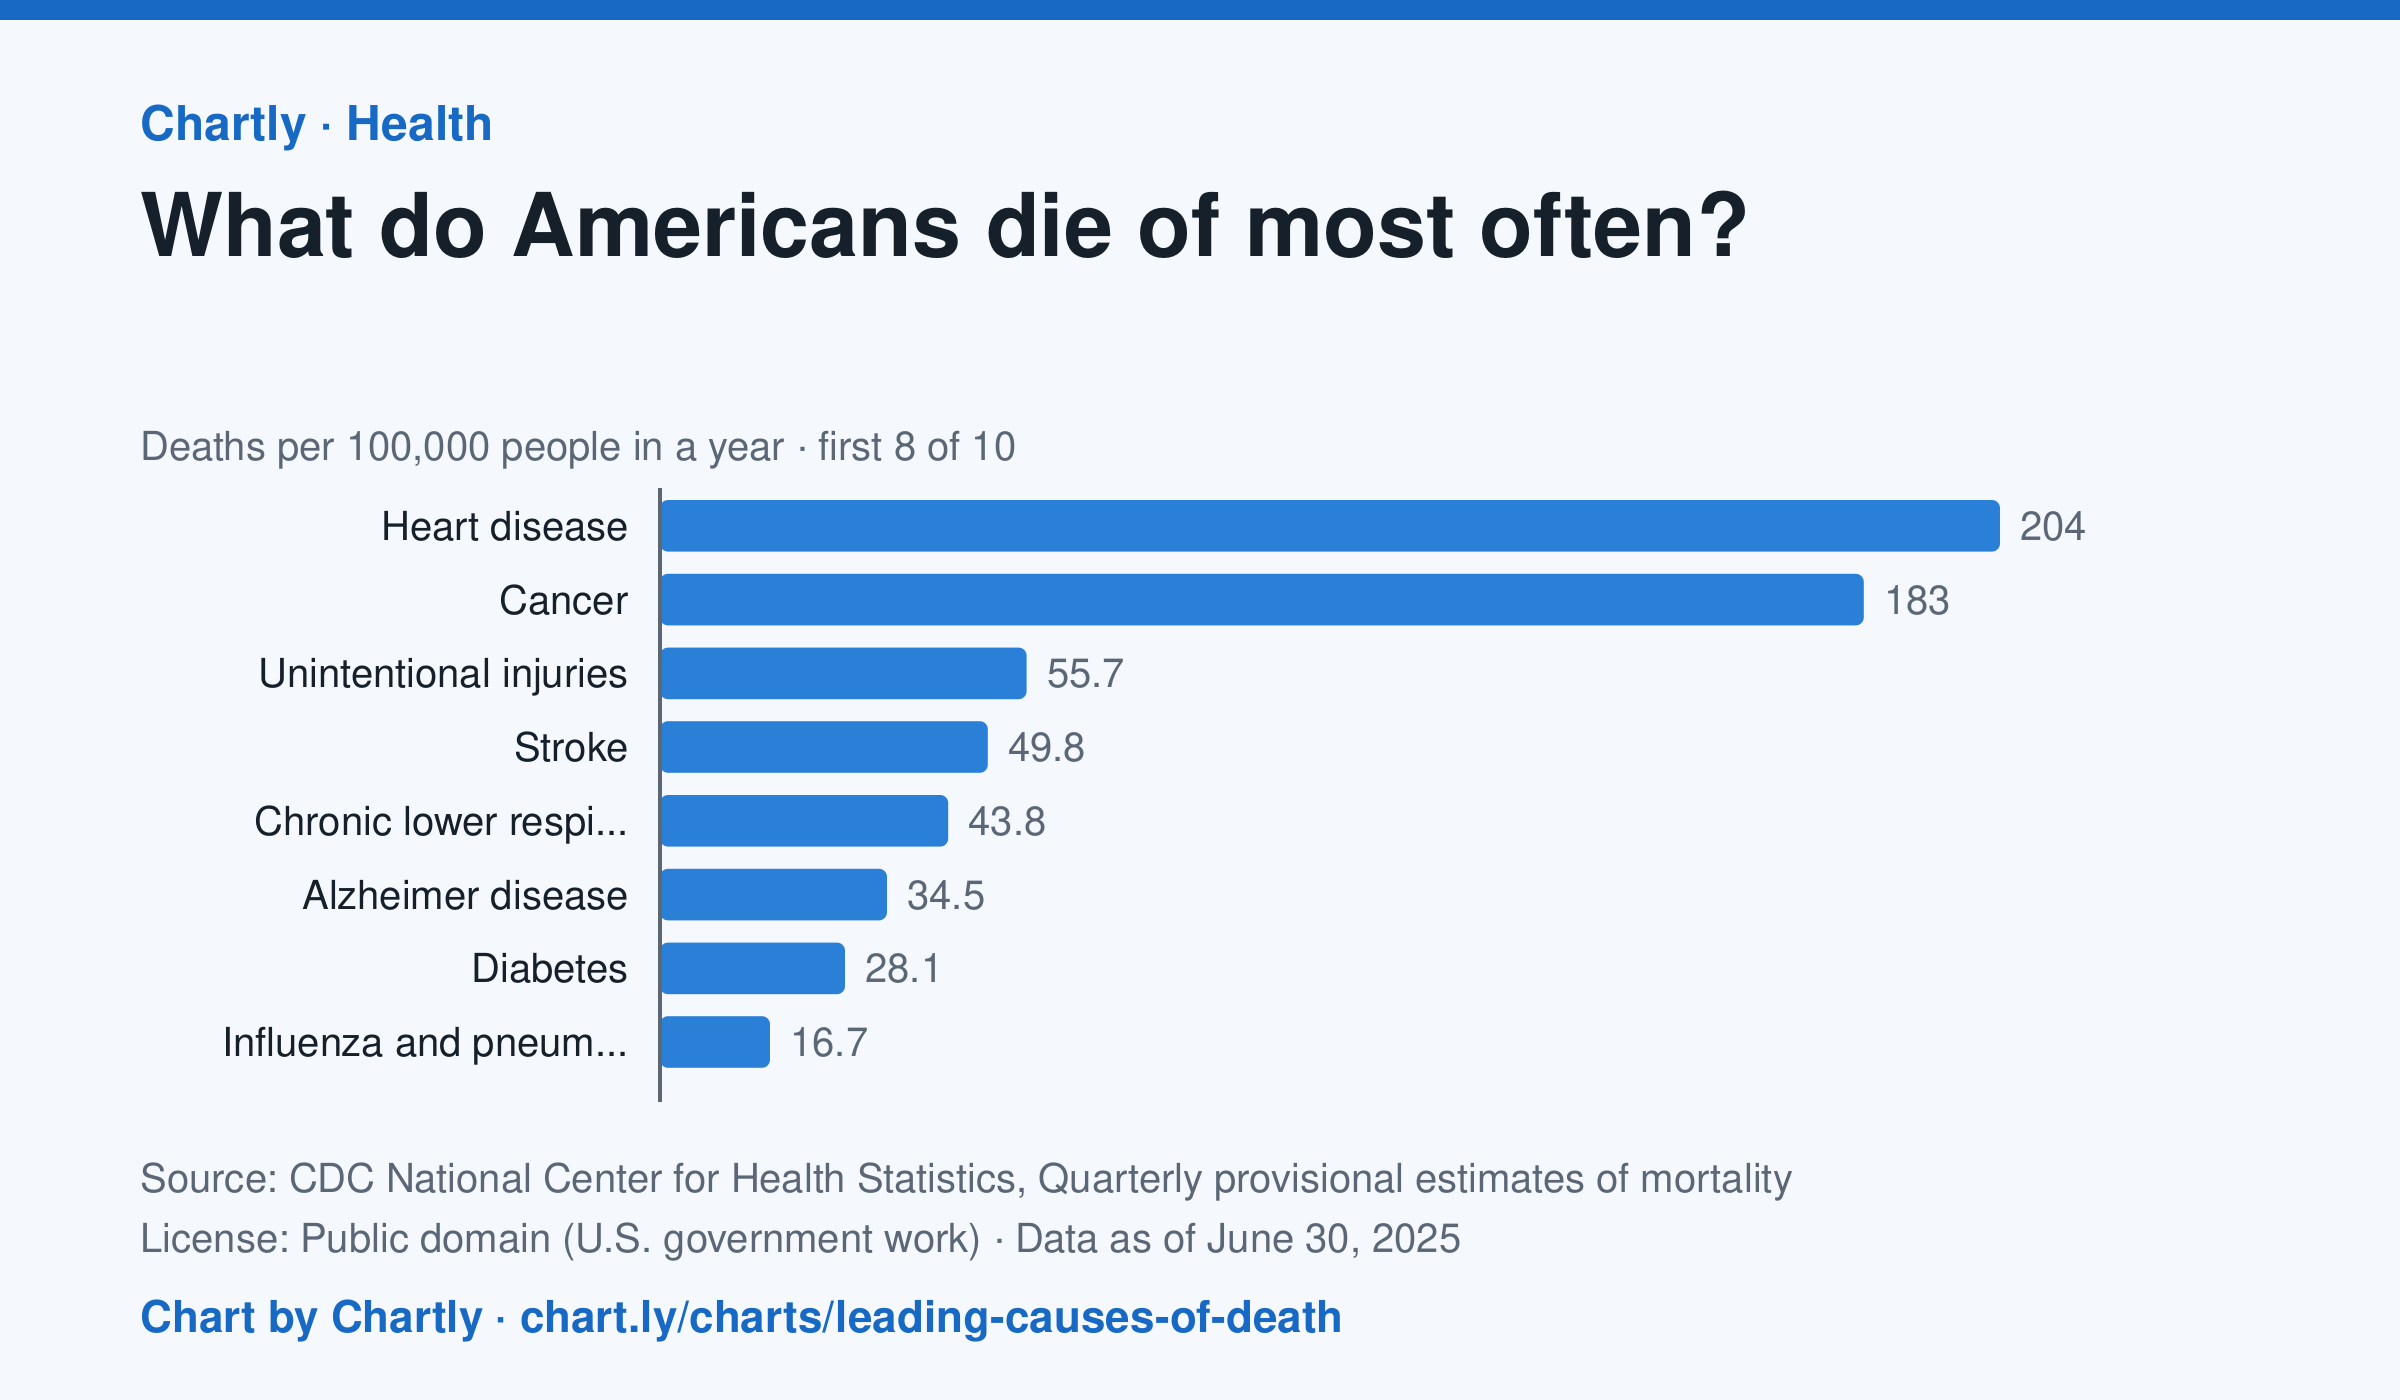
In the 12 months through June 2025, heart disease (204 deaths per 100,000 people) and cancer (183) were the leading causes of death in the US, and unintentional injuries came third at 56. Unintentional injuries include accidental overdoses, falls and traffic crashes. The numbers are provisional and may change a little as records are completed.
Source: CDC National Center for Health Statistics, Quarterly provisional estimates of mortality (Public domain (U.S. government work)) · Data as of Jun 30, 2025
How to read this chart
Each bar is how many people out of every 100,000 died of one cause in a year. A rate, instead of a count, lets you compare causes fairly even as the population grows. The bars start at zero, so a bar twice as long means twice as many deaths.
Questions
- Which two causes are far ahead of the rest? How many times bigger is the top cause than the smallest bar?
- Which of these causes could people lower with exercise, diet or not smoking?
- Why might the leading causes of death be very different for teenagers than for everyone together?
Chart and numbers: chart.ly/charts/leading-causes-of-death · More free charts at chart.ly