Print this worksheet, or choose "Save as PDF" in the print window to share a file.
Chart worksheet
Charts to read and discuss
Name:
Class:
Date:
Chart 1 of 3 · Federal budget
Where does federal spending go?
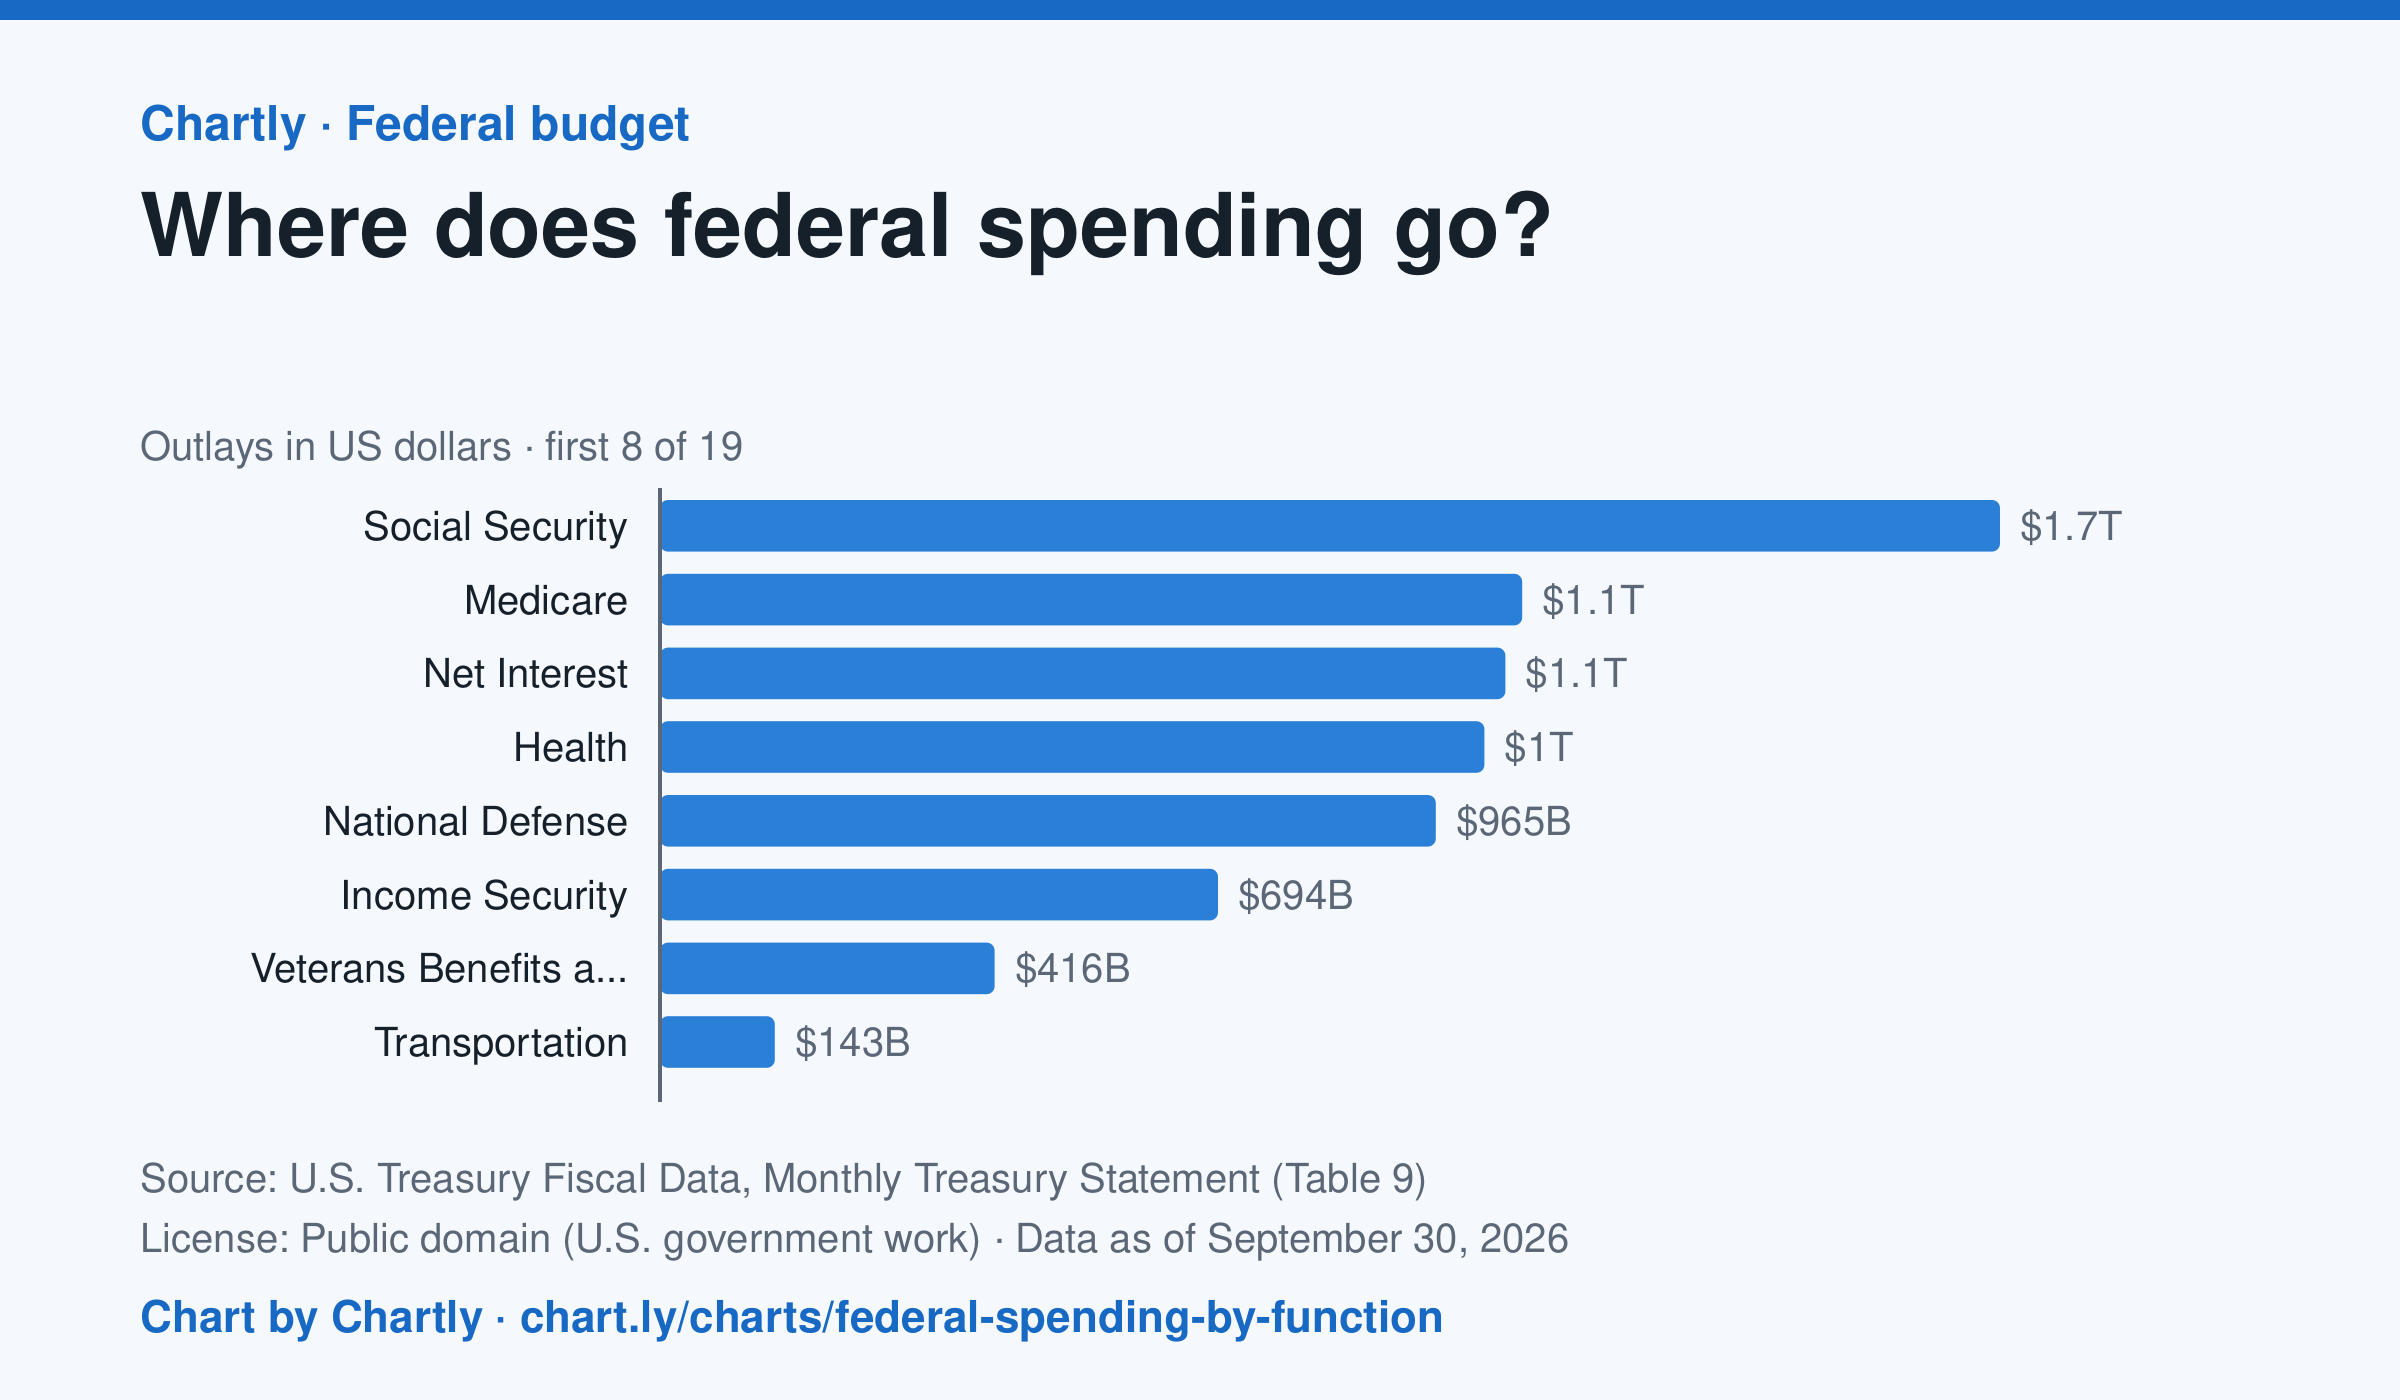
Social Security was the biggest item in fiscal 2026 at $1.67 trillion, out of $7.4 trillion in total. Next came Medicare ($1.07 trillion), Net Interest ($1.05 trillion), Health ($1.03 trillion) and National Defense ($965 billion). Two accounting lines are below zero, so the bars add up to the total.
Source: U.S. Treasury Fiscal Data, Monthly Treasury Statement (Table 9) (Public domain (U.S. government work)) · Data as of Sep 30, 2026
How to read this chart
Each bar is how much the federal government spent on one area in a fiscal year, which runs from October to September. The axis shows dollars: 1T is a trillion dollars, a thousand billion. One bar is below zero because it counts money the government takes back in, such as payments agencies make to each other, which lowers the total.
Questions
- Which area gets the most money? About how many times more than the smallest positive bar?
- Which of the biggest areas are paid to people directly, like retirees and patients, and which pay for services?
- If Congress wanted to cut spending by a lot, which bars would it have to change, and why is that hard?
Chart and numbers: chart.ly/charts/federal-spending-by-function · More free charts at chart.ly
Chart 2 of 3 · Jobs and wages
How much do US workers earn an hour?
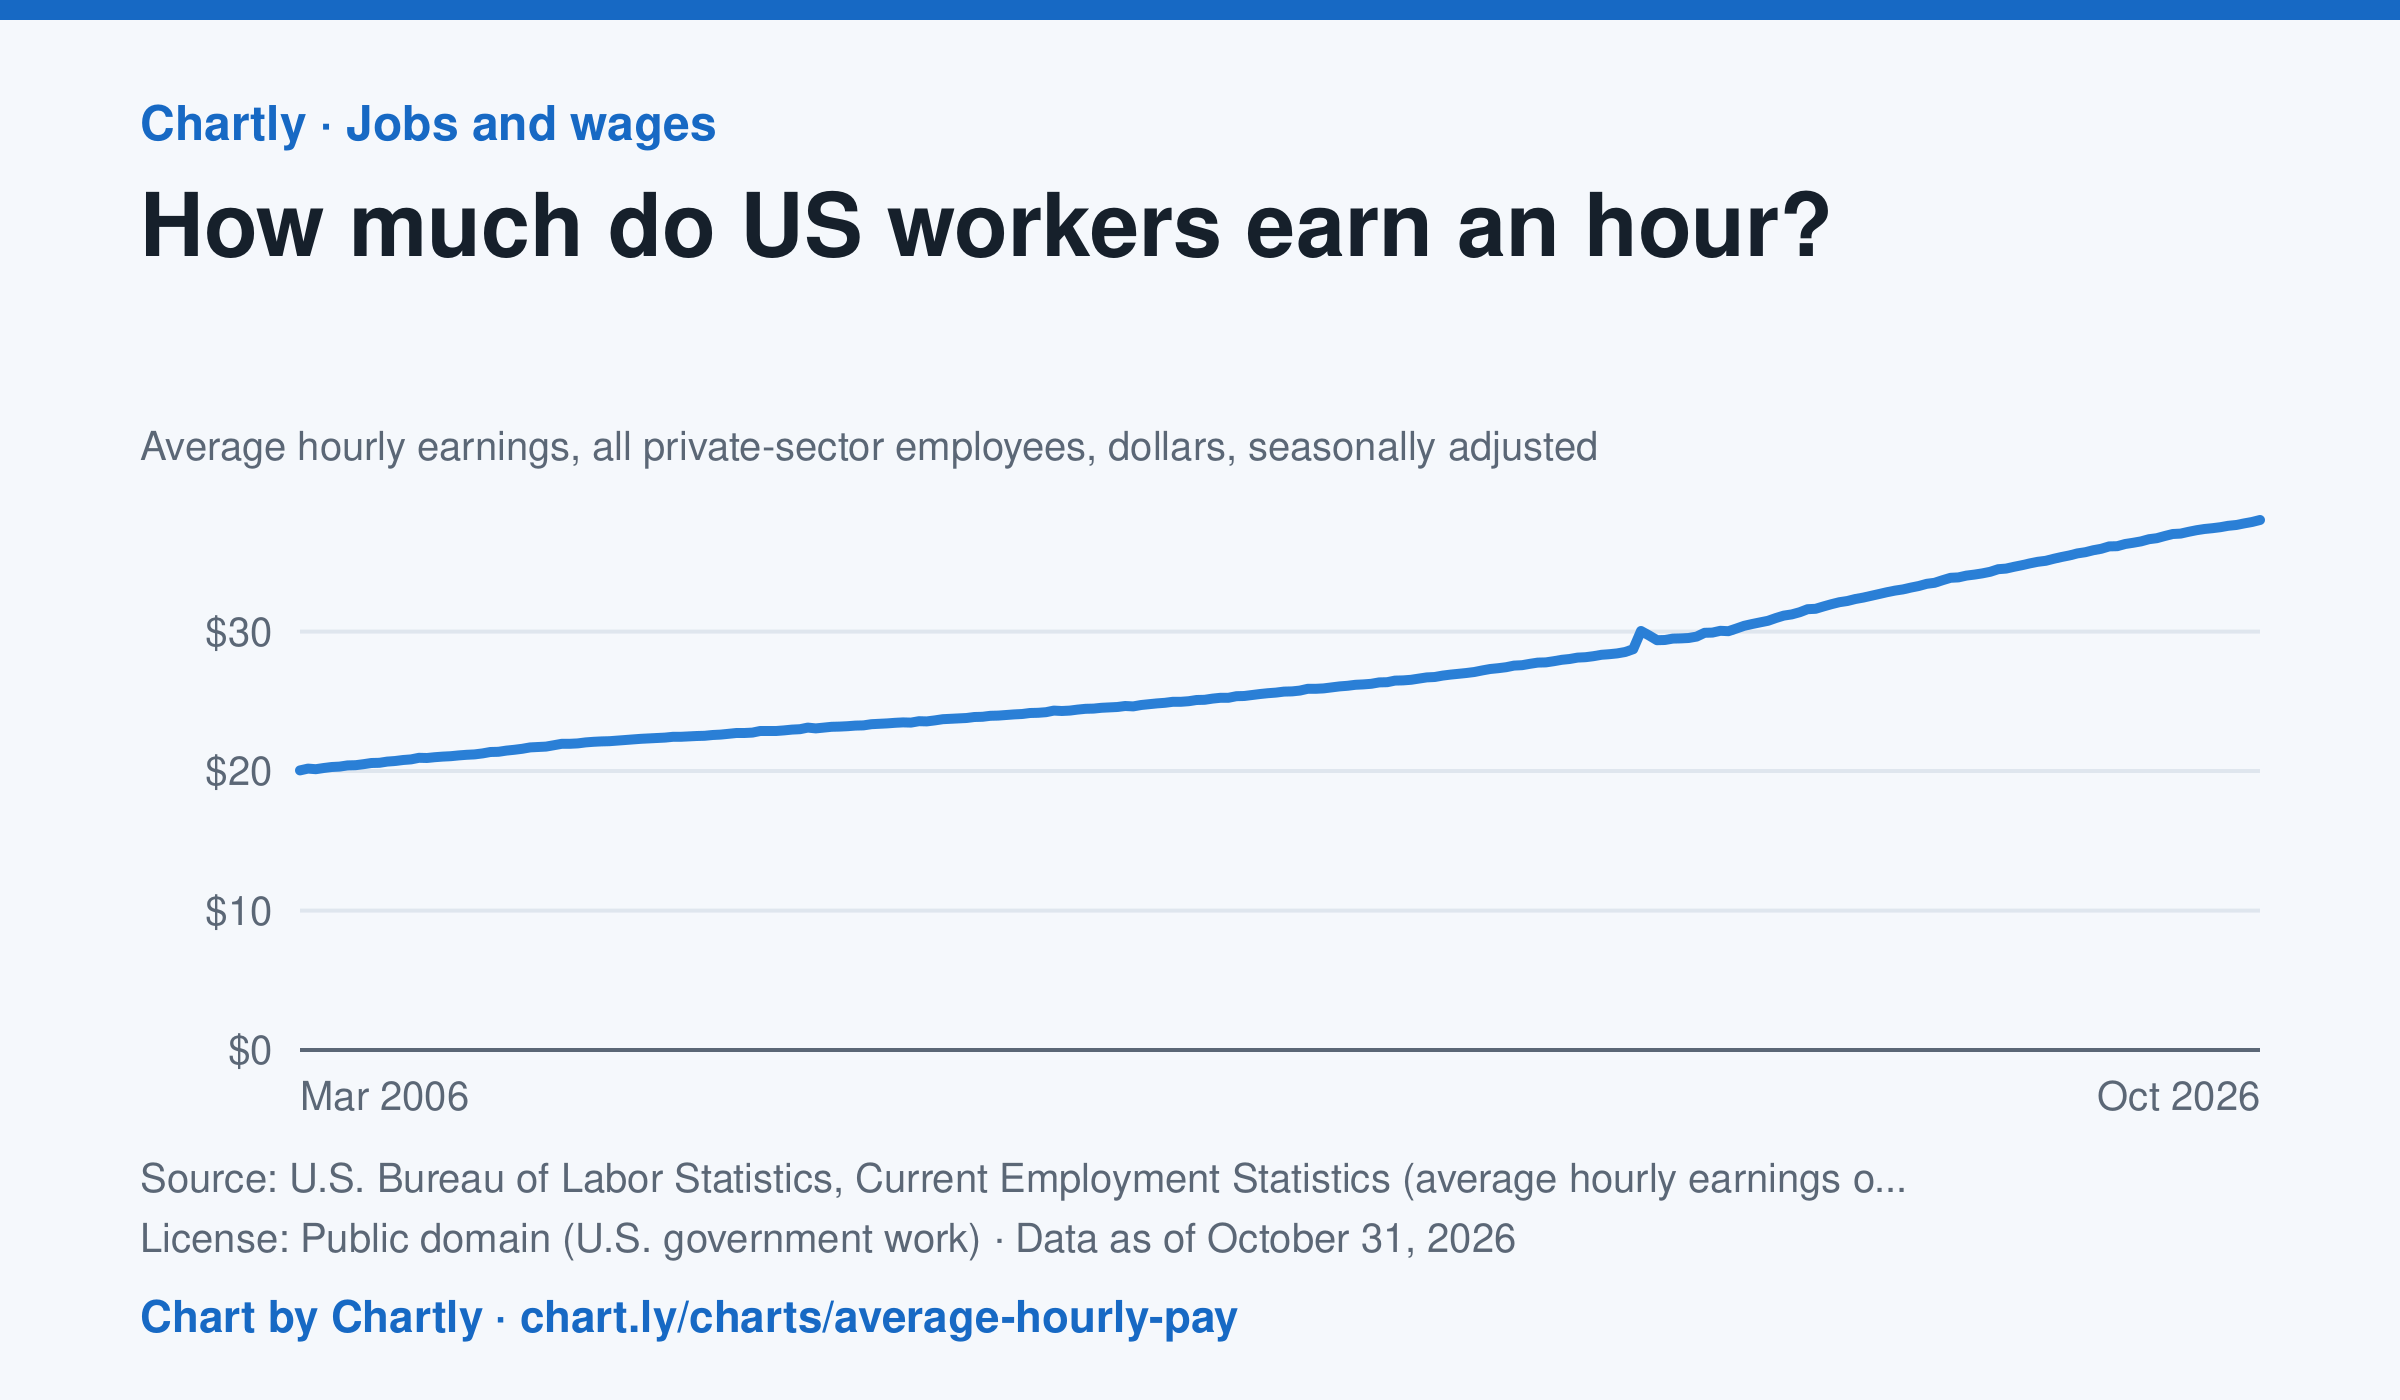
Private-sector employees earned an average of $38.00 an hour in October 2026, 3.1% more than in October 2025 and 1.9 times the $20.04 of March 2006, when the series begins. That is in dollars of the day, not adjusted for inflation; the monthly jobs report compares it with prices. The average rose sharply in spring 2020 because the pandemic put mostly lower-paid people out of work, not because pay jumped.
Source: U.S. Bureau of Labor Statistics, Current Employment Statistics (average hourly earnings of all employees, total private) (Public domain (U.S. government work)) · Data as of Oct 31, 2026
How to read this chart
Each point is the average hourly pay of private-sector employees in one month, in dollars, before taxes. It is not adjusted for inflation, so a rise in pay doesn't always mean workers can buy more. Hover or tap a point to read its month and value.
Questions
- How much did average hourly pay change from the first month on the chart to the newest?
- Find a month when pay jumped more than usual. Can you think of a reason that might happen, other than everyone getting a raise?
- If prices rose faster than pay over a year, were workers better or worse off? How could you check that with another chart?
Chart and numbers: chart.ly/charts/average-hourly-pay · More free charts at chart.ly
Chart 3 of 3 · Climate
Which US states have warmed the most?
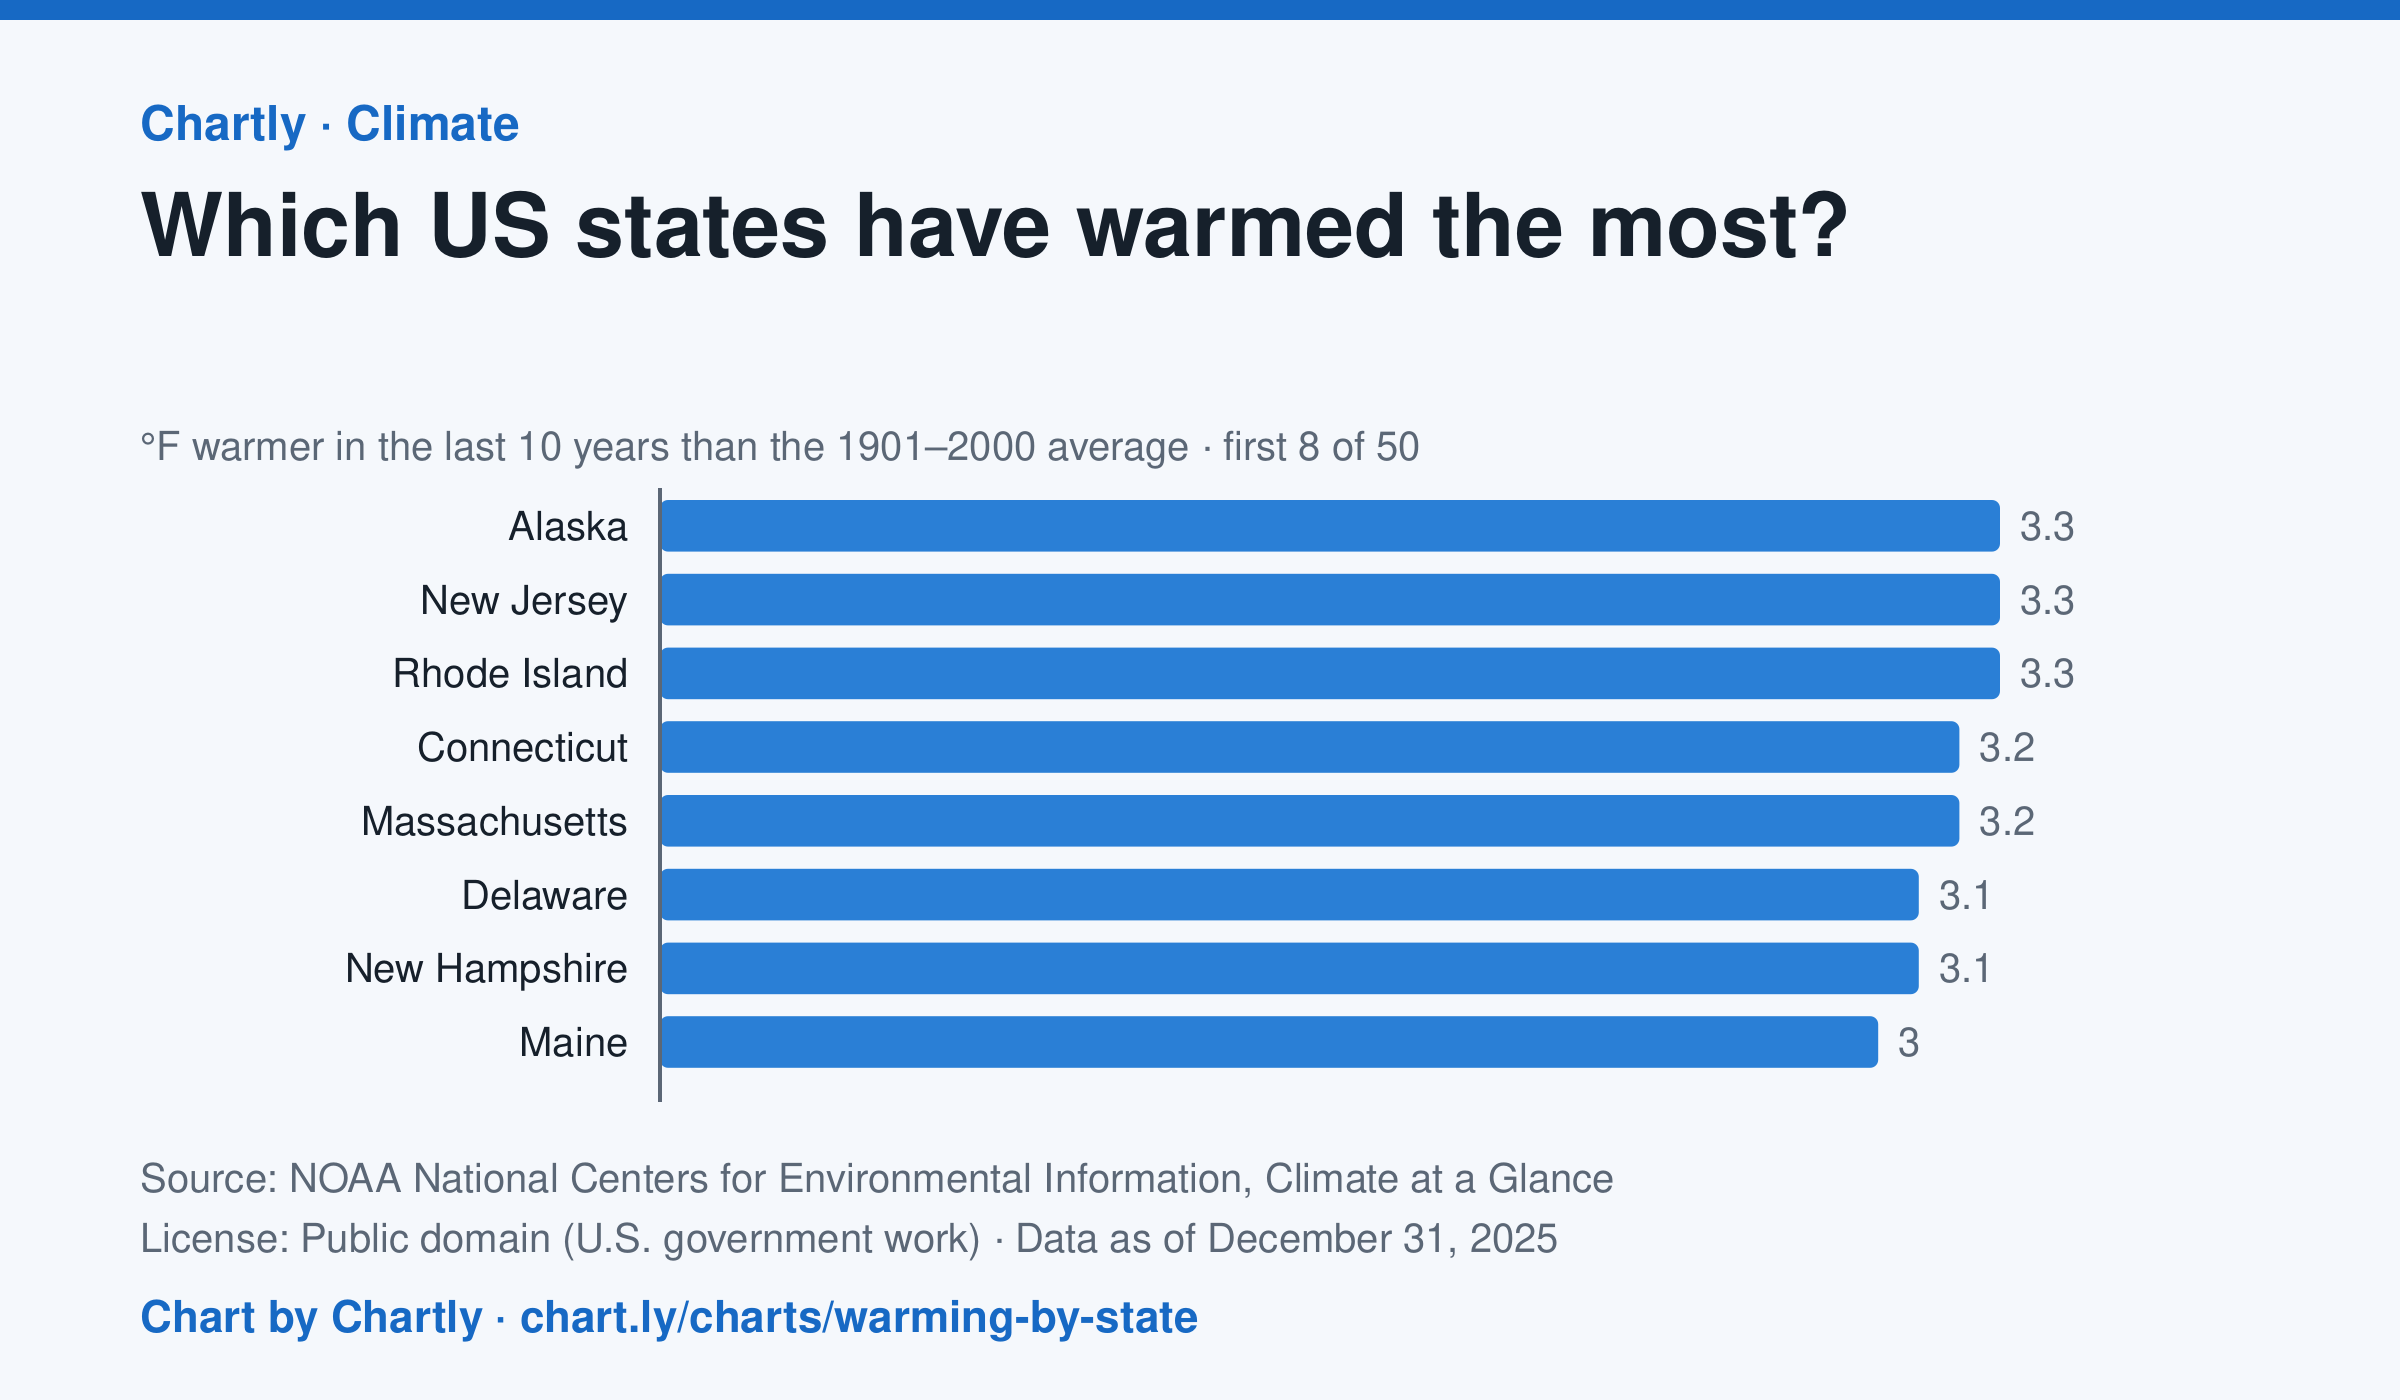
In the 10 years through 2025, Alaska was among the states that warmed most, averaging 3.3°F warmer than in 1901–2000, while Oklahoma was among those that warmed least, 1.6°F; the contiguous US warmed 2.2°F. Alaska's records start in 1925, so its baseline is 1925–2000. Hawaii's start in 1991, so it isn't included.
Source: NOAA National Centers for Environmental Information, Climate at a Glance (Public domain (U.S. government work)) · Data as of Dec 31, 2025
How to read this chart
Each bar shows how much warmer a state's last 10 years were than its average for 1901 to 2000, in degrees Fahrenheit. Ten years are averaged so one hot or cold year doesn't decide a state's place. The dashed line is the whole lower 48 states.
Questions
- Which states warmed the most and the least? How many degrees apart are they?
- Do the states that warmed most sit together in one part of the country, or are they spread out?
- Why do scientists compare with a long average like 1901 to 2000 instead of with just last year?
Chart and numbers: chart.ly/charts/warming-by-state · More free charts at chart.ly