Print this worksheet, or choose "Save as PDF" in the print window to share a file.
Chart worksheet
Charts to read and discuss
Name:
Class:
Date:
Chart 1 of 3 · Federal budget
Where does federal spending go?
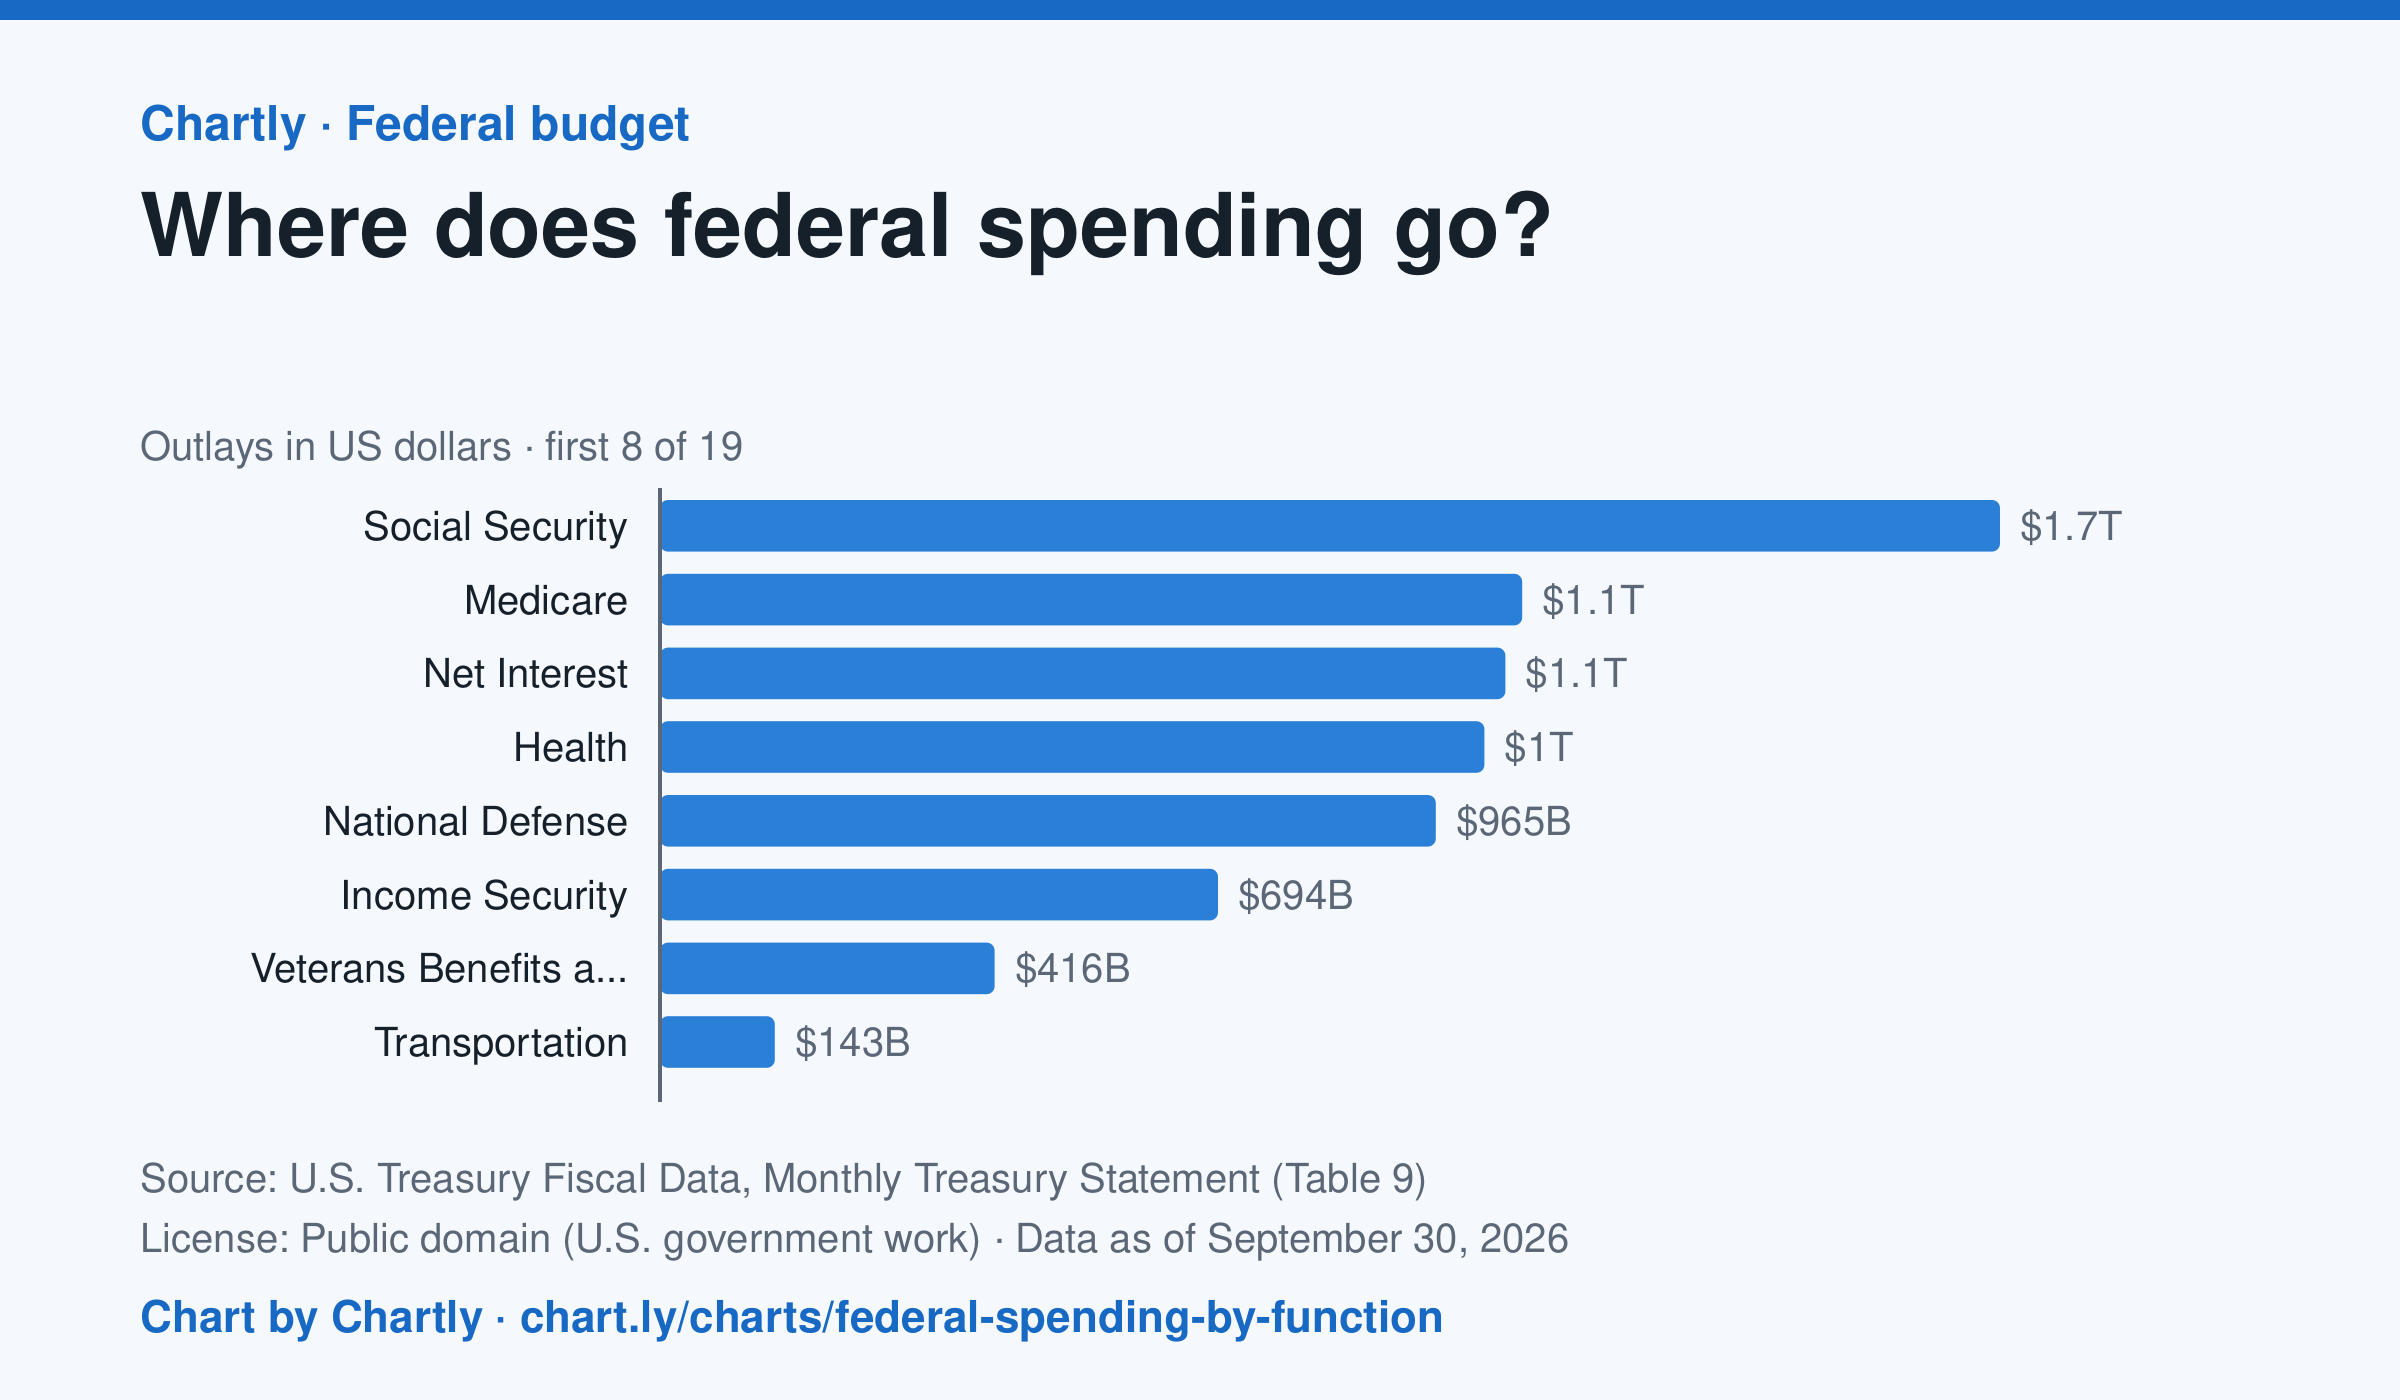
Social Security was the biggest item in fiscal 2026 at $1.67 trillion, out of $7.4 trillion in total. Next came Medicare ($1.07 trillion), Net Interest ($1.05 trillion), Health ($1.03 trillion) and National Defense ($965 billion). Two accounting lines are below zero, so the bars add up to the total.
Source: U.S. Treasury Fiscal Data, Monthly Treasury Statement (Table 9) (Public domain (U.S. government work)) · Data as of Sep 30, 2026
How to read this chart
Each bar is how much the federal government spent on one area in a fiscal year, which runs from October to September. The axis shows dollars: 1T is a trillion dollars, a thousand billion. One bar is below zero because it counts money the government takes back in, such as payments agencies make to each other, which lowers the total.
Questions
- Which area gets the most money? About how many times more than the smallest positive bar?
- Which of the biggest areas are paid to people directly, like retirees and patients, and which pay for services?
- If Congress wanted to cut spending by a lot, which bars would it have to change, and why is that hard?
Chart and numbers: chart.ly/charts/federal-spending-by-function · More free charts at chart.ly
Chart 2 of 3 · Jobs and wages
How much do US workers earn an hour?
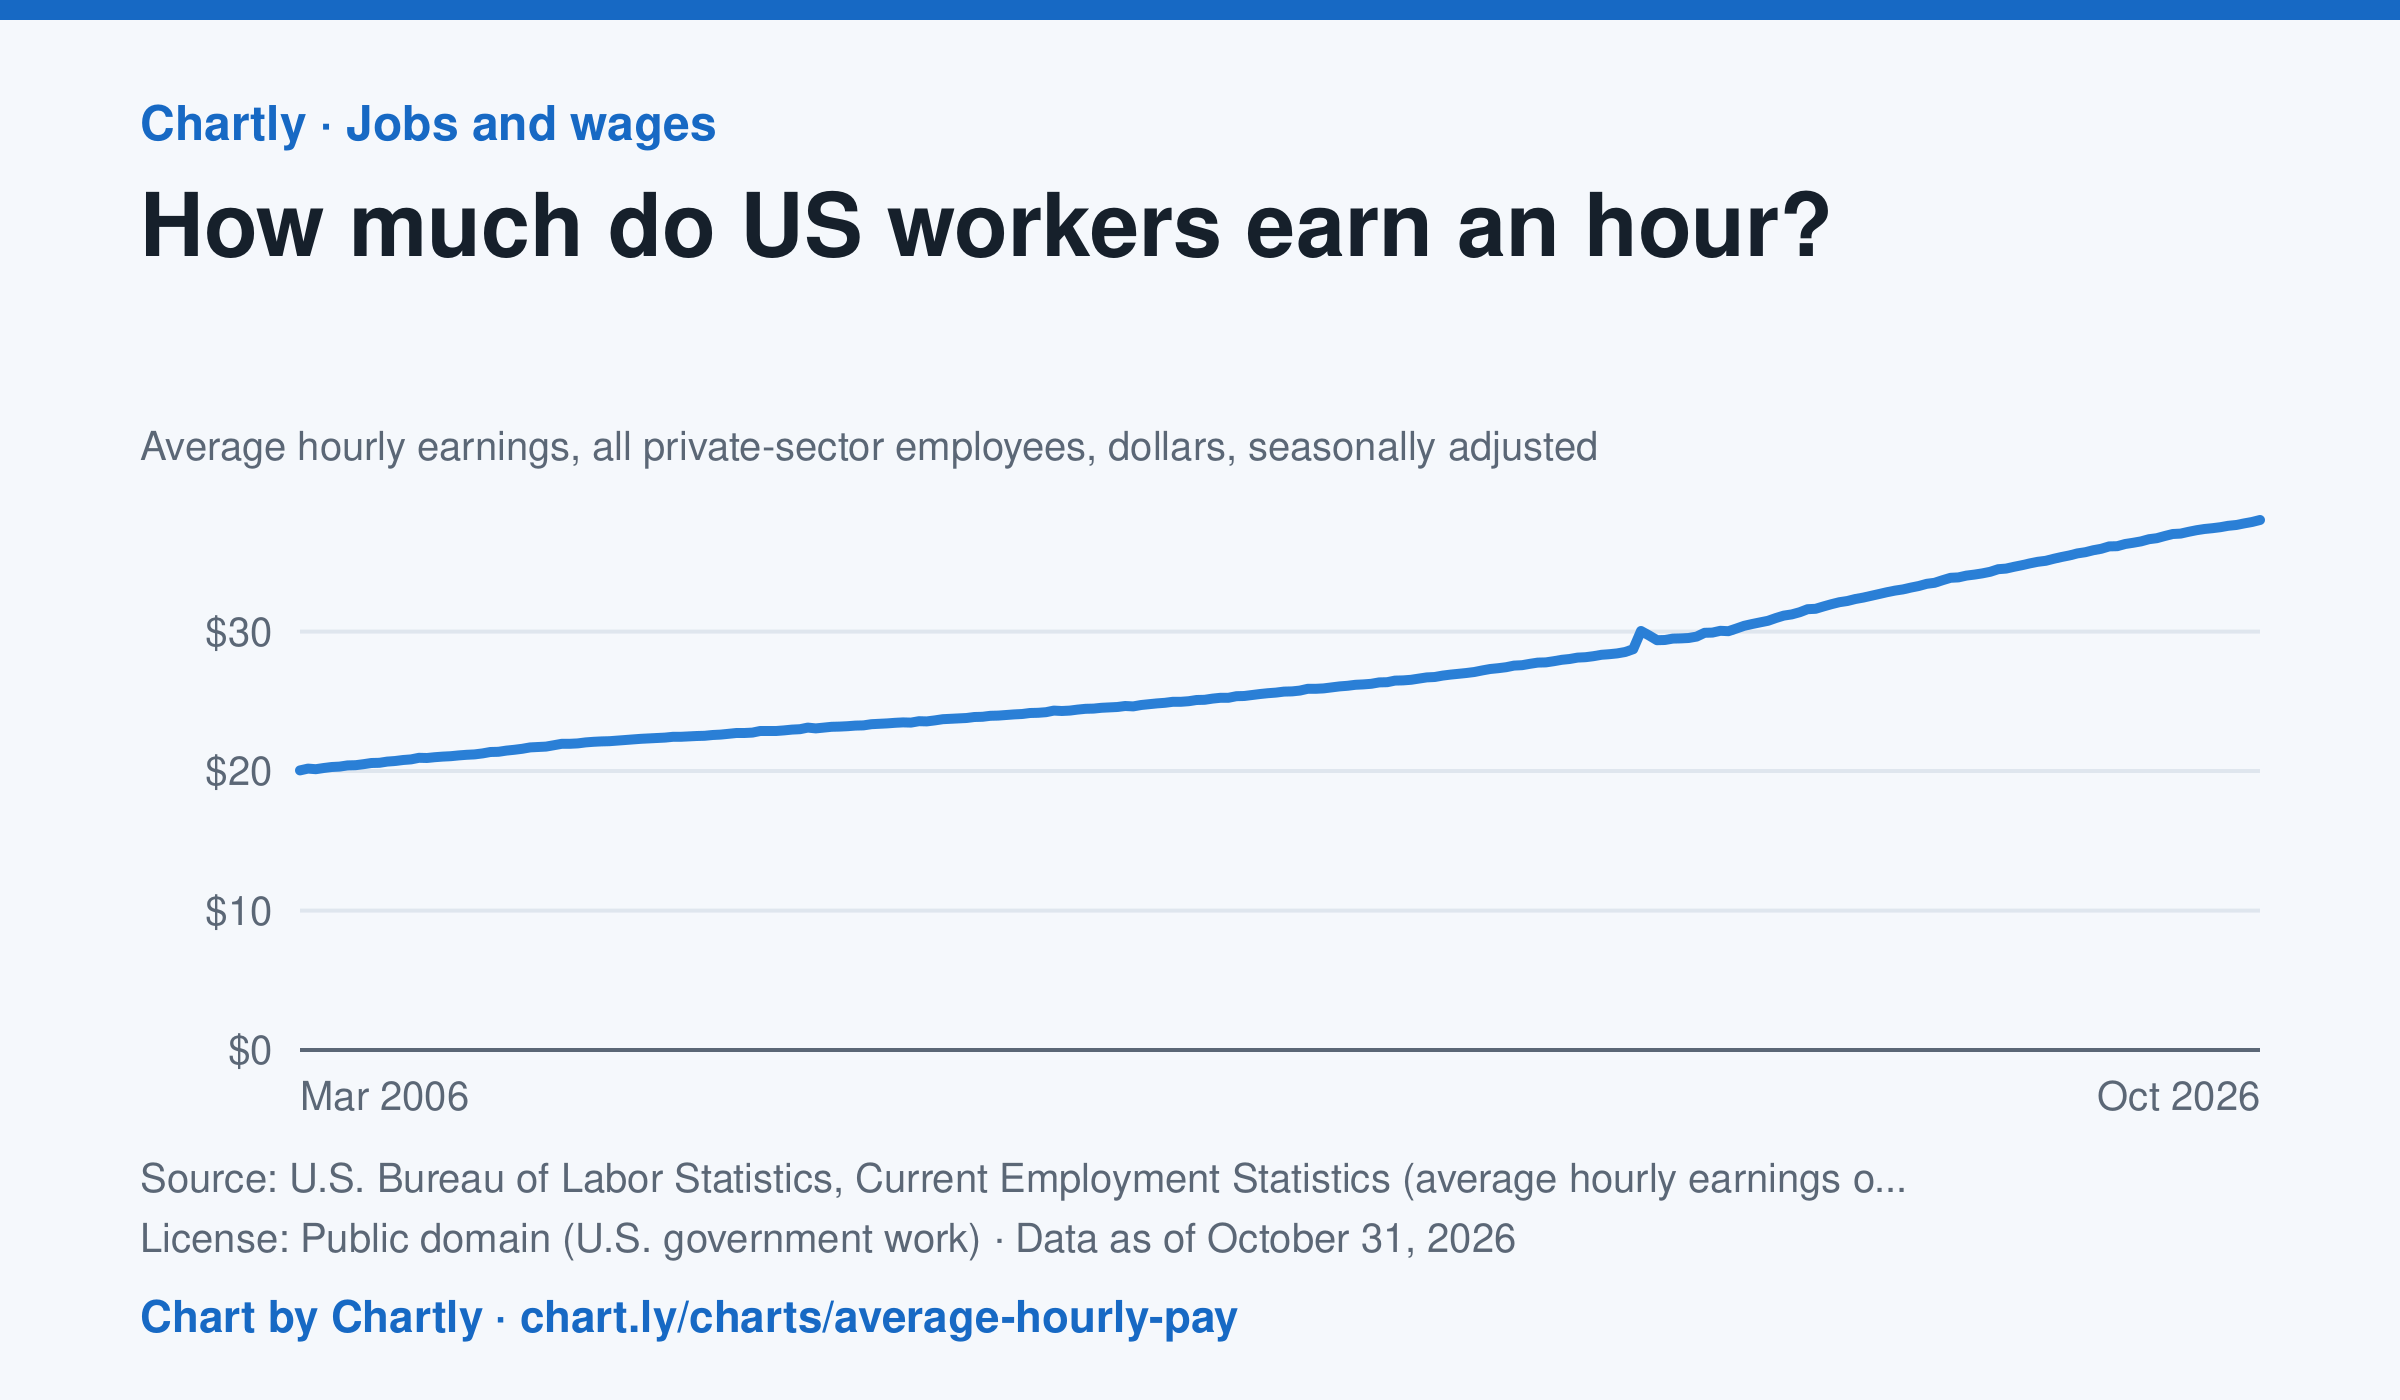
Private-sector employees earned an average of $38.00 an hour in October 2026, 3.1% more than in October 2025 and 1.9 times the $20.04 of March 2006, when the series begins. That is in dollars of the day, not adjusted for inflation; the monthly jobs report compares it with prices. The average rose sharply in spring 2020 because the pandemic put mostly lower-paid people out of work, not because pay jumped.
Source: U.S. Bureau of Labor Statistics, Current Employment Statistics (average hourly earnings of all employees, total private) (Public domain (U.S. government work)) · Data as of Oct 31, 2026
How to read this chart
Each point is the average hourly pay of private-sector employees in one month, in dollars, before taxes. It is not adjusted for inflation, so a rise in pay doesn't always mean workers can buy more. Hover or tap a point to read its month and value.
Questions
- How much did average hourly pay change from the first month on the chart to the newest?
- Find a month when pay jumped more than usual. Can you think of a reason that might happen, other than everyone getting a raise?
- If prices rose faster than pay over a year, were workers better or worse off? How could you check that with another chart?
Chart and numbers: chart.ly/charts/average-hourly-pay · More free charts at chart.ly
Chart 3 of 3 · Earthquakes
How much rarer is each step up in earthquake magnitude?
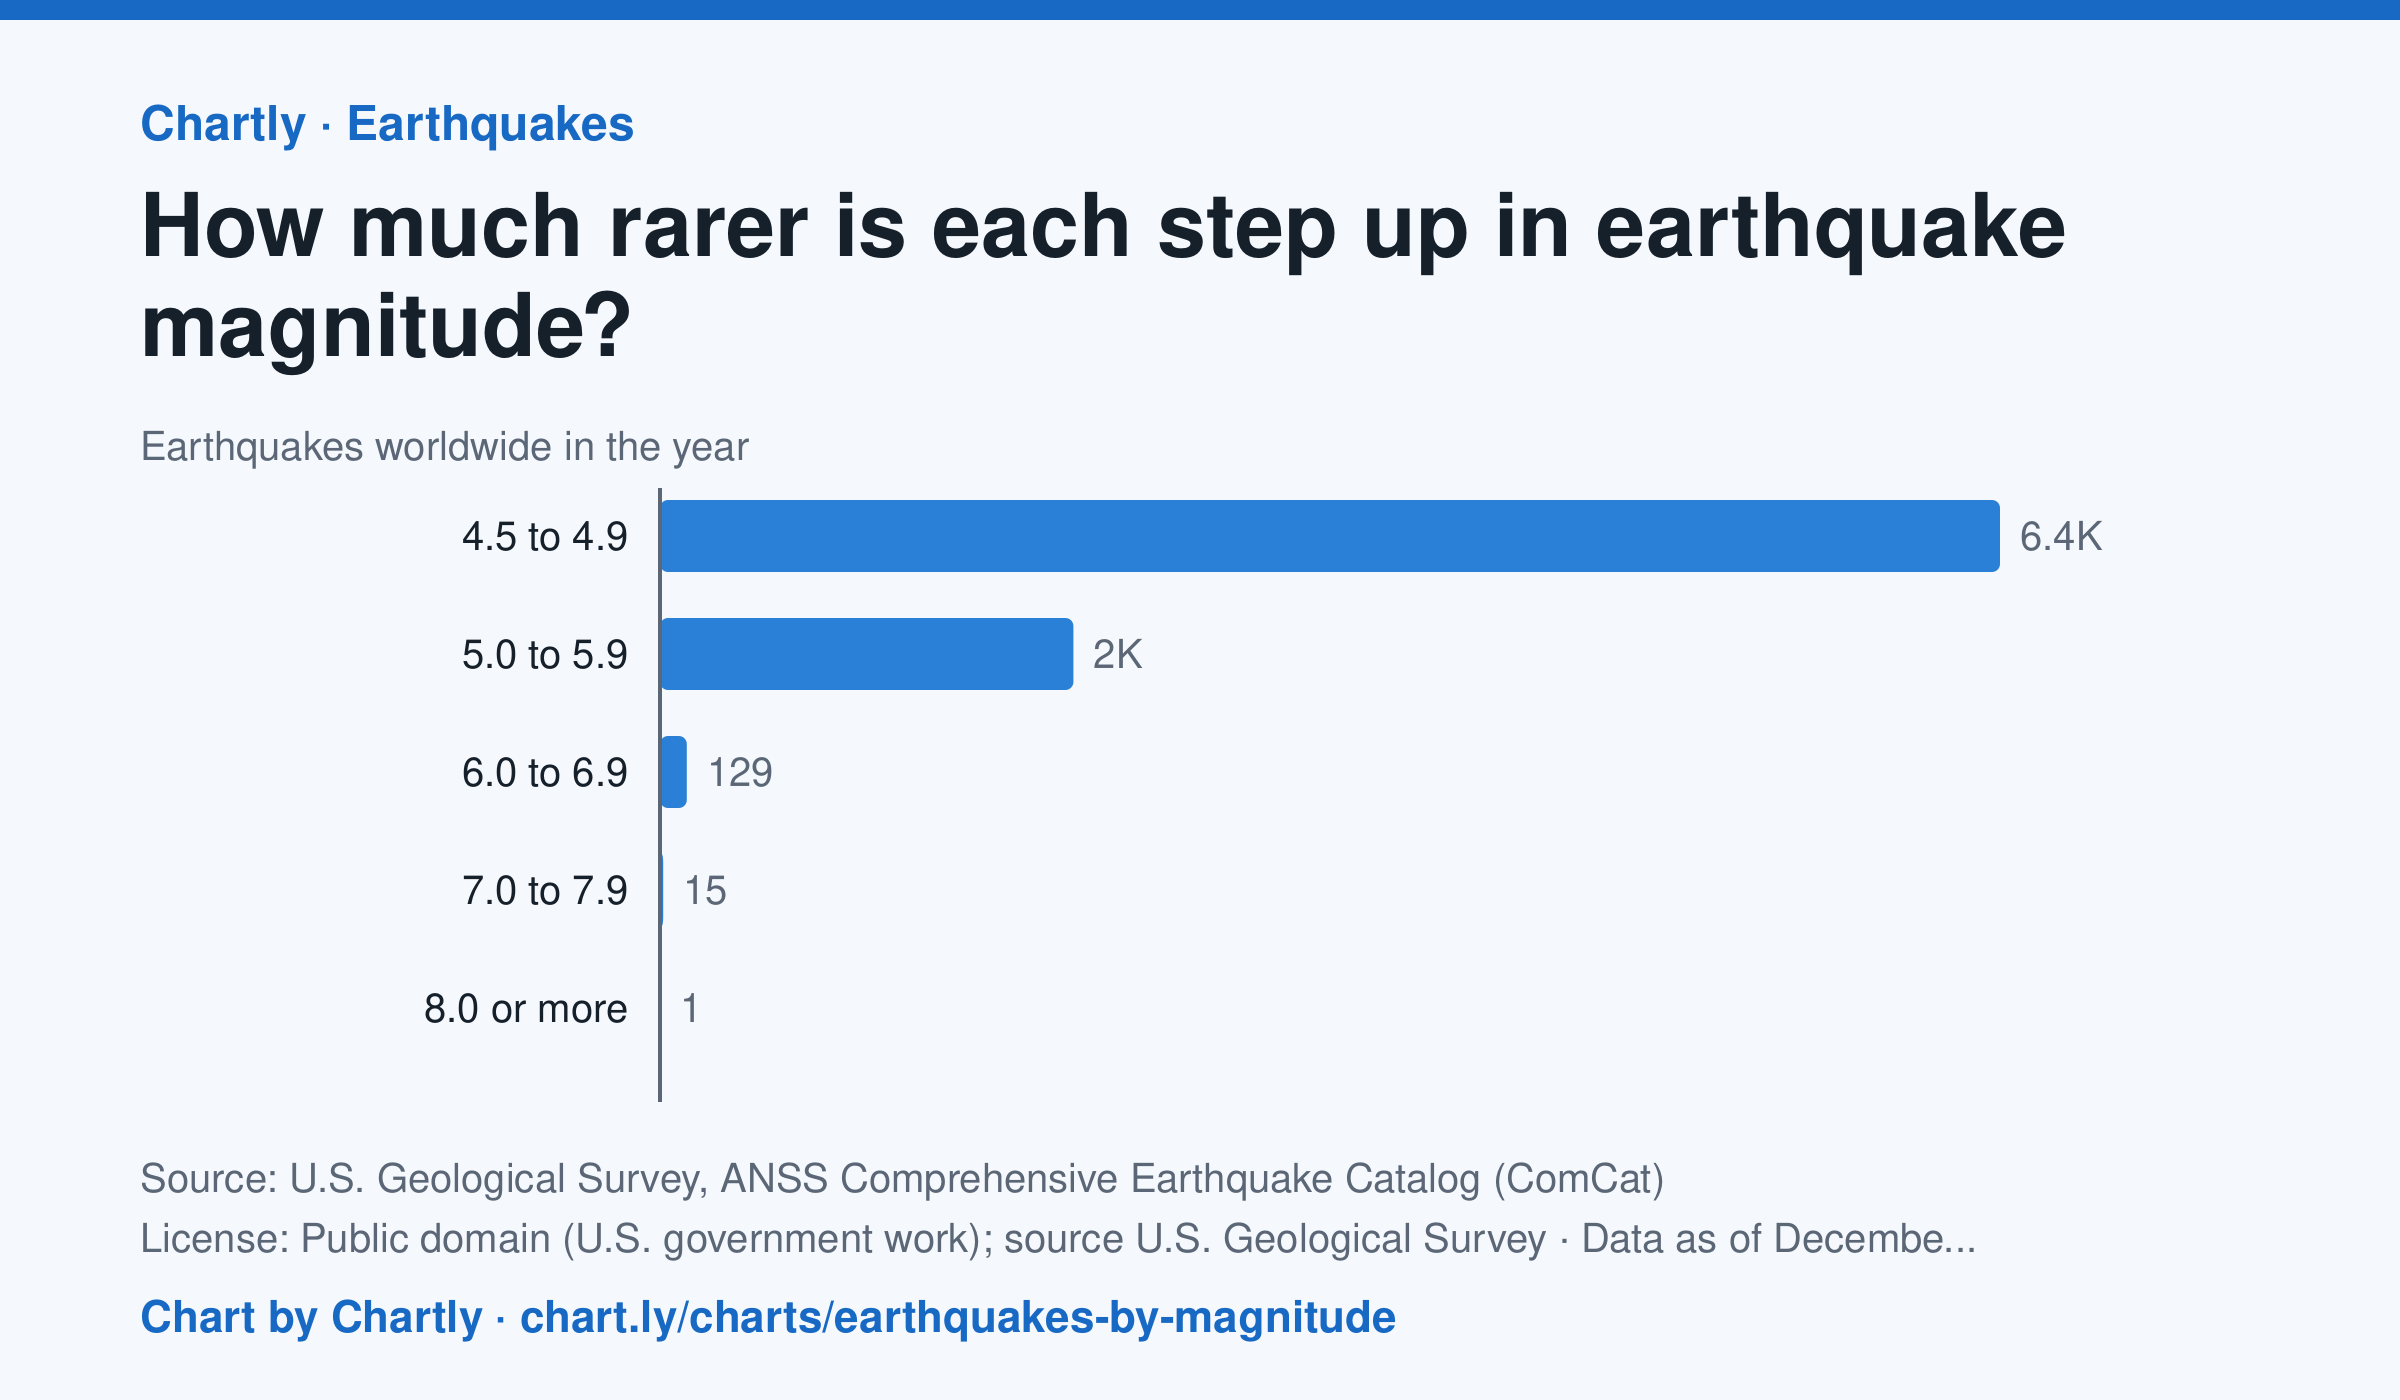
In 2025 the world recorded 6,428 earthquakes of magnitude 4.5 to 4.9, 1,983 of magnitude 5, 129 of magnitude 6, 15 of magnitude 7 and 1 of magnitude 8 or more. Each step up in magnitude is roughly ten times rarer, and releases about 32 times more energy. Countless smaller quakes go unrecorded worldwide, so the chart starts at 4.5.
Source: U.S. Geological Survey, ANSS Comprehensive Earthquake Catalog (ComCat) (Public domain (U.S. government work); source U.S. Geological Survey) · Data as of Dec 31, 2025
How to read this chart
Each bar counts the earthquakes recorded worldwide in one year within a range of magnitudes. The bars start at zero. Each whole step up in magnitude releases about 32 times more energy, so a magnitude 7 quake is far more than one step stronger than a 6.
Questions
- Roughly how many times more common is each band than the one above it?
- The biggest bars are hard to compare with the smallest ones on this scale. What other way could you show these numbers?
- The chart starts at magnitude 4.5. Why might smaller earthquakes around the world go uncounted?
Chart and numbers: chart.ly/charts/earthquakes-by-magnitude · More free charts at chart.ly