Print this worksheet, or choose "Save as PDF" in the print window to share a file.
Chart worksheet
Charts to read and discuss
Name:
Class:
Date:
Chart 1 of 2 · Space
How many planets outside our solar system are discovered each year?
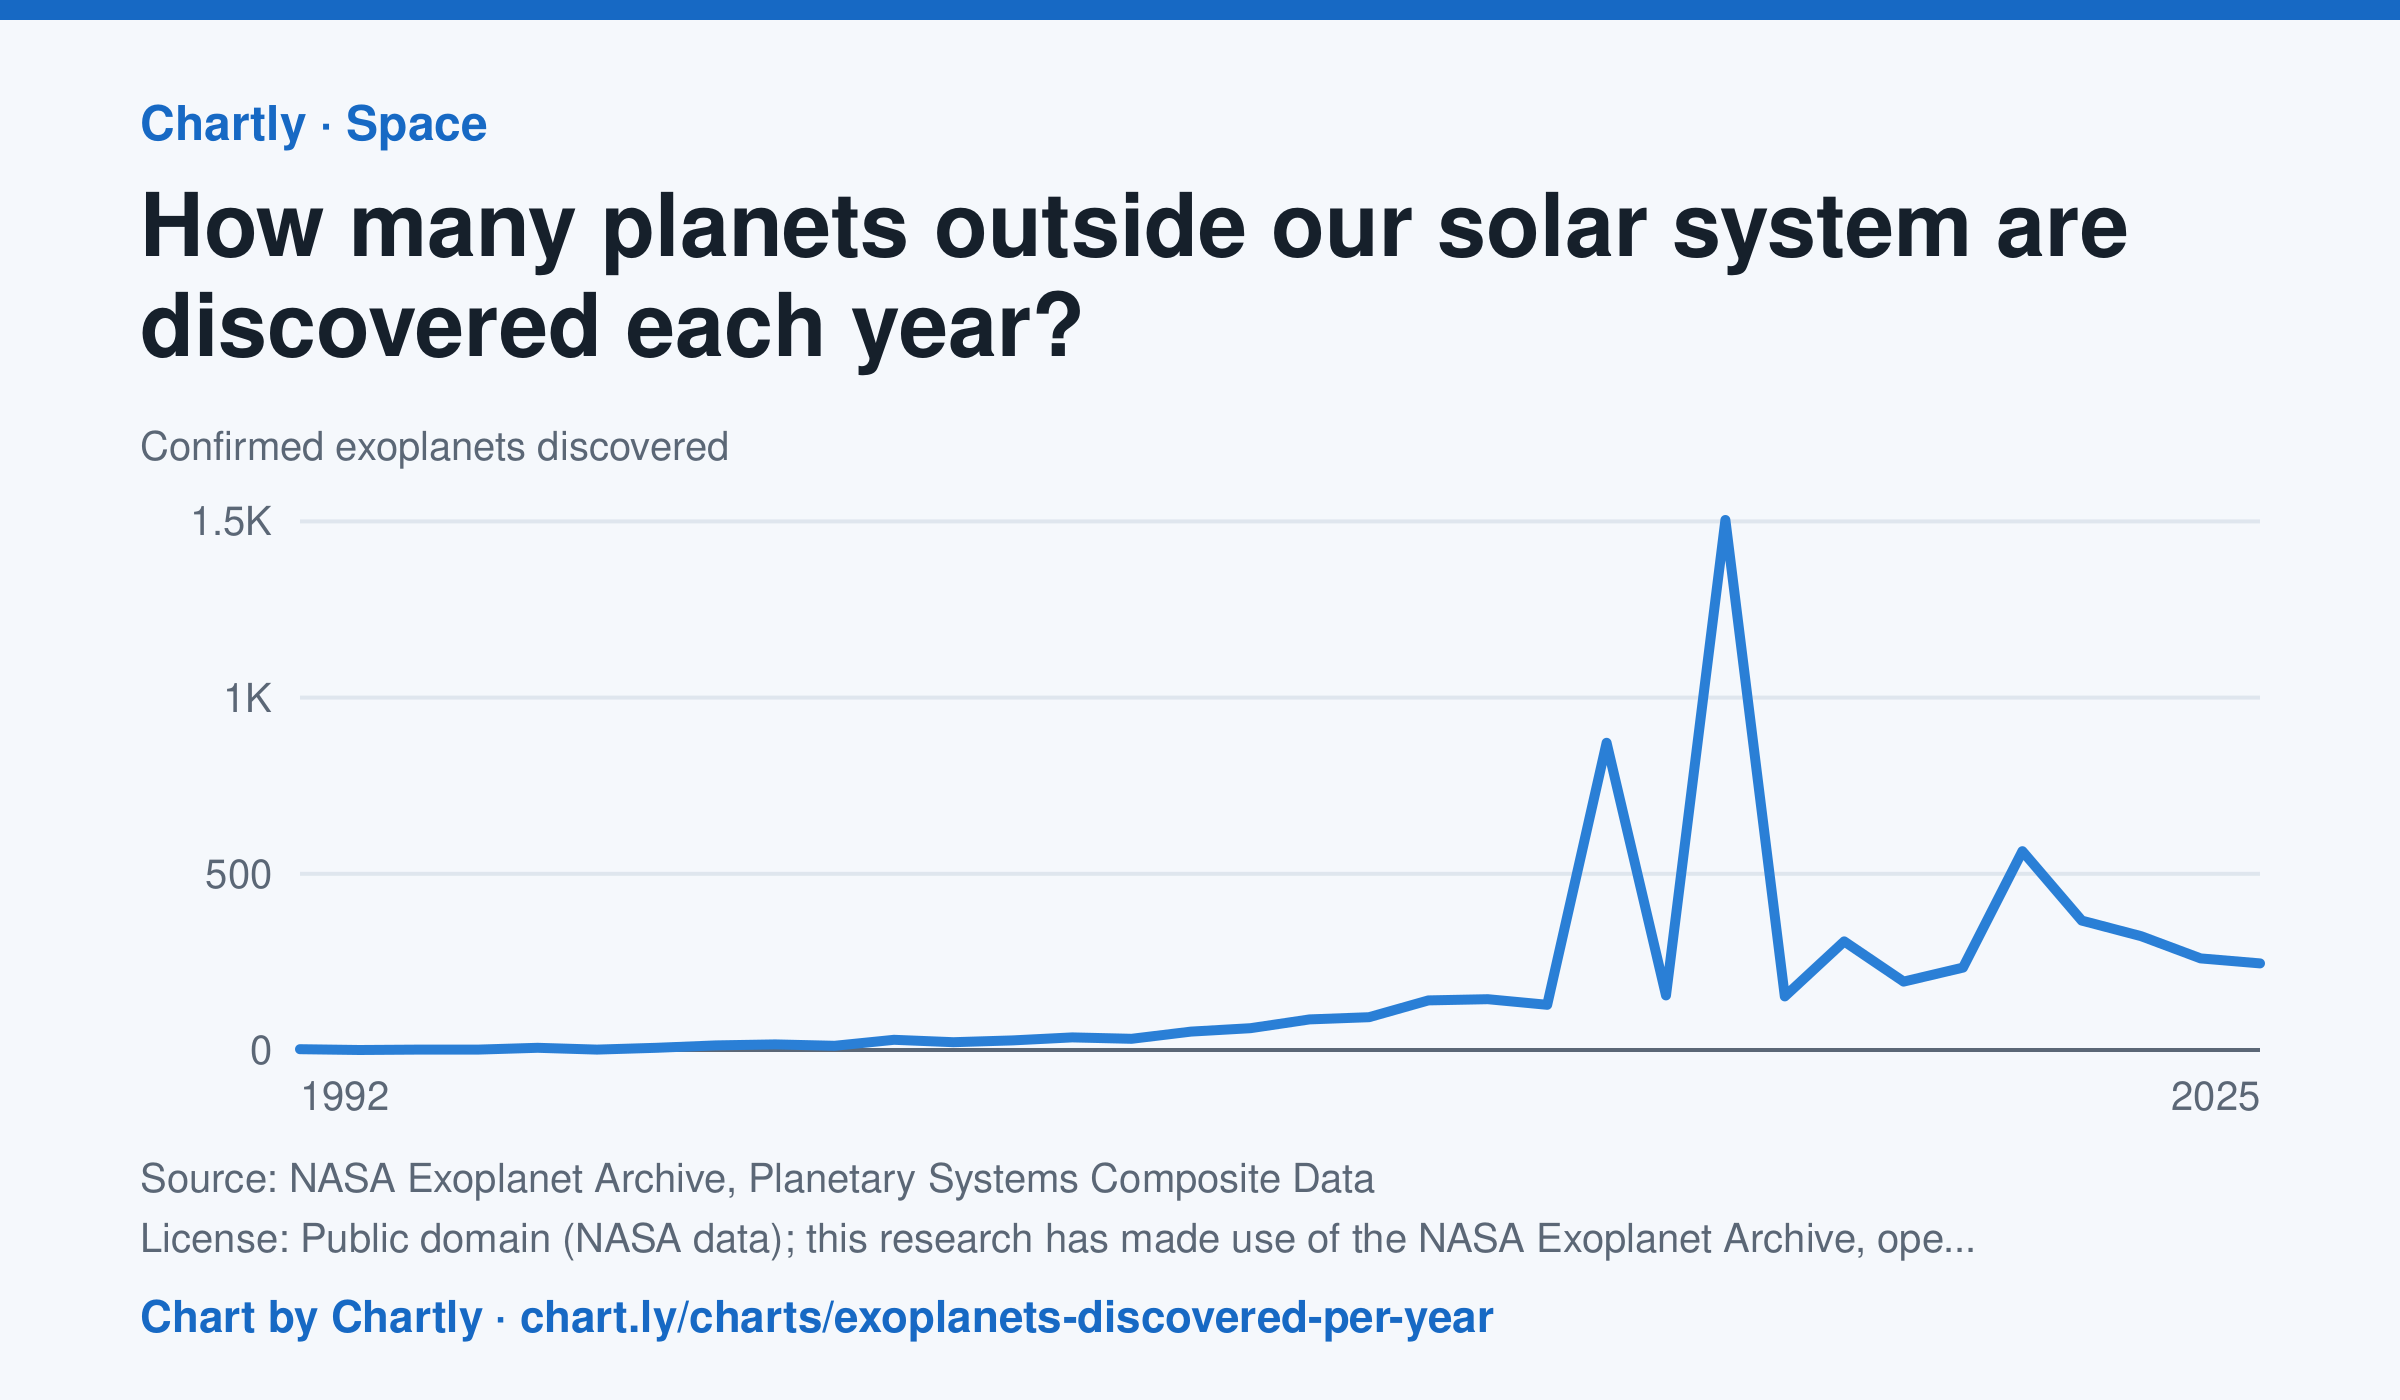
Astronomers confirmed 245 new planets around other stars in 2025. The first were found in 1992, and the count leaped in 2014 and 2016 (872 and 1,504), when NASA's Kepler team confirmed hundreds of its candidates at once. The archive counts a planet in the year its discovery was published and keeps adding late confirmations, so recent years can still rise.
Source: NASA Exoplanet Archive, Planetary Systems Composite Data (Public domain (NASA data); this research has made use of the NASA Exoplanet Archive, operated by Caltech under contract with NASA) · Data as of Dec 31, 2025
How to read this chart
Each point is how many planets around other stars, called exoplanets, astronomers confirmed in a year. The count depends on telescopes as much as on the sky: a new space telescope can confirm hundreds at once. The numbers come from NASA's Exoplanet Archive.
Questions
- Find the two biggest jumps on the chart. What could cause so many planets to be confirmed in one year?
- How many planets were confirmed in the first year on the chart, and how many in the newest year?
- Does a big year on this chart mean there were more planets in space that year? What does it really measure?
Chart and numbers: chart.ly/charts/exoplanets-discovered-per-year · More free charts at chart.ly
Chart 2 of 2 · Federal budget
Where does federal revenue come from?
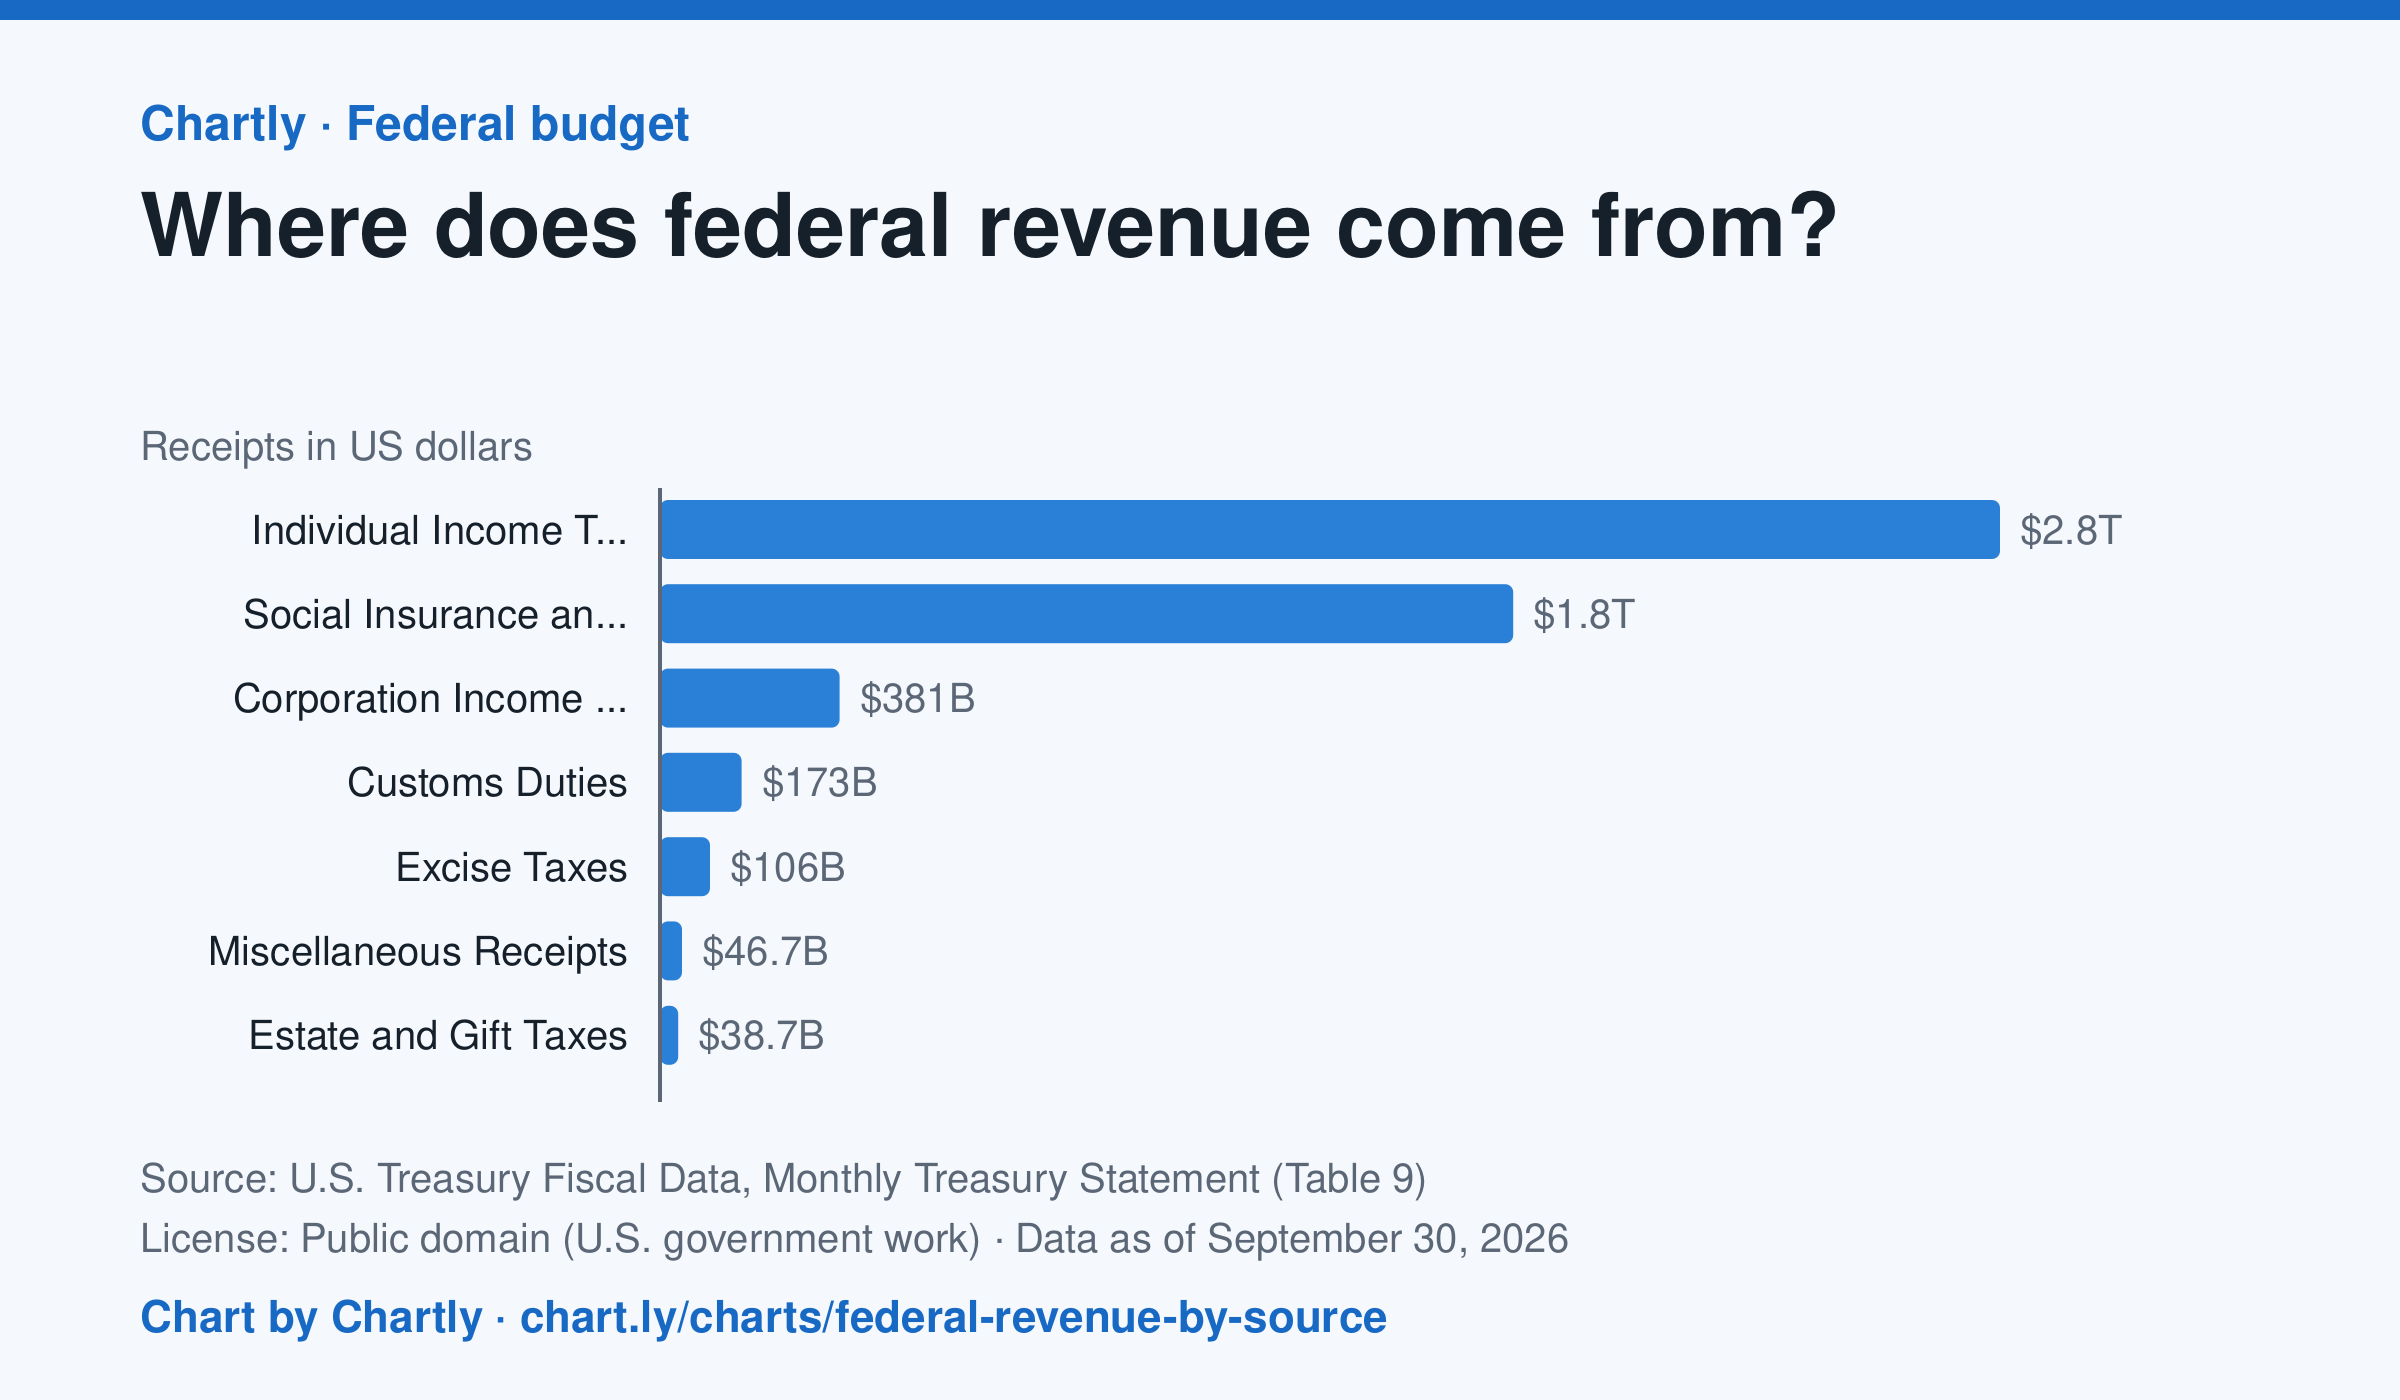
Individual income taxes brought in $2.85 trillion of the government's $5.4 trillion in fiscal 2026, about 53%. Payroll taxes for Social Security, Medicare and unemployment insurance ("social insurance") added $1.81 trillion, and corporate income taxes $381 billion.
Source: U.S. Treasury Fiscal Data, Monthly Treasury Statement (Table 9) (Public domain (U.S. government work)) · Data as of Sep 30, 2026
How to read this chart
Each bar is how much money the federal government collected from one kind of tax in a fiscal year, which runs from October to September. Payroll taxes are the Social Security and Medicare taxes taken out of paychecks. The axis shows dollars: 1T is a trillion dollars.
Questions
- Which source brings in the most money? About what share of the total is it?
- How are individual income taxes different from payroll taxes? Who pays each one?
- Compare this chart with the federal spending chart. What happens when the government spends more than it collects?
Chart and numbers: chart.ly/charts/federal-revenue-by-source · More free charts at chart.ly