Print this worksheet, or choose "Save as PDF" in the print window to share a file.
Chart worksheet
Charts to read and discuss
Name:
Class:
Date:
Chart 1 of 3 · Inflation
How much have US consumer prices risen since 1913?
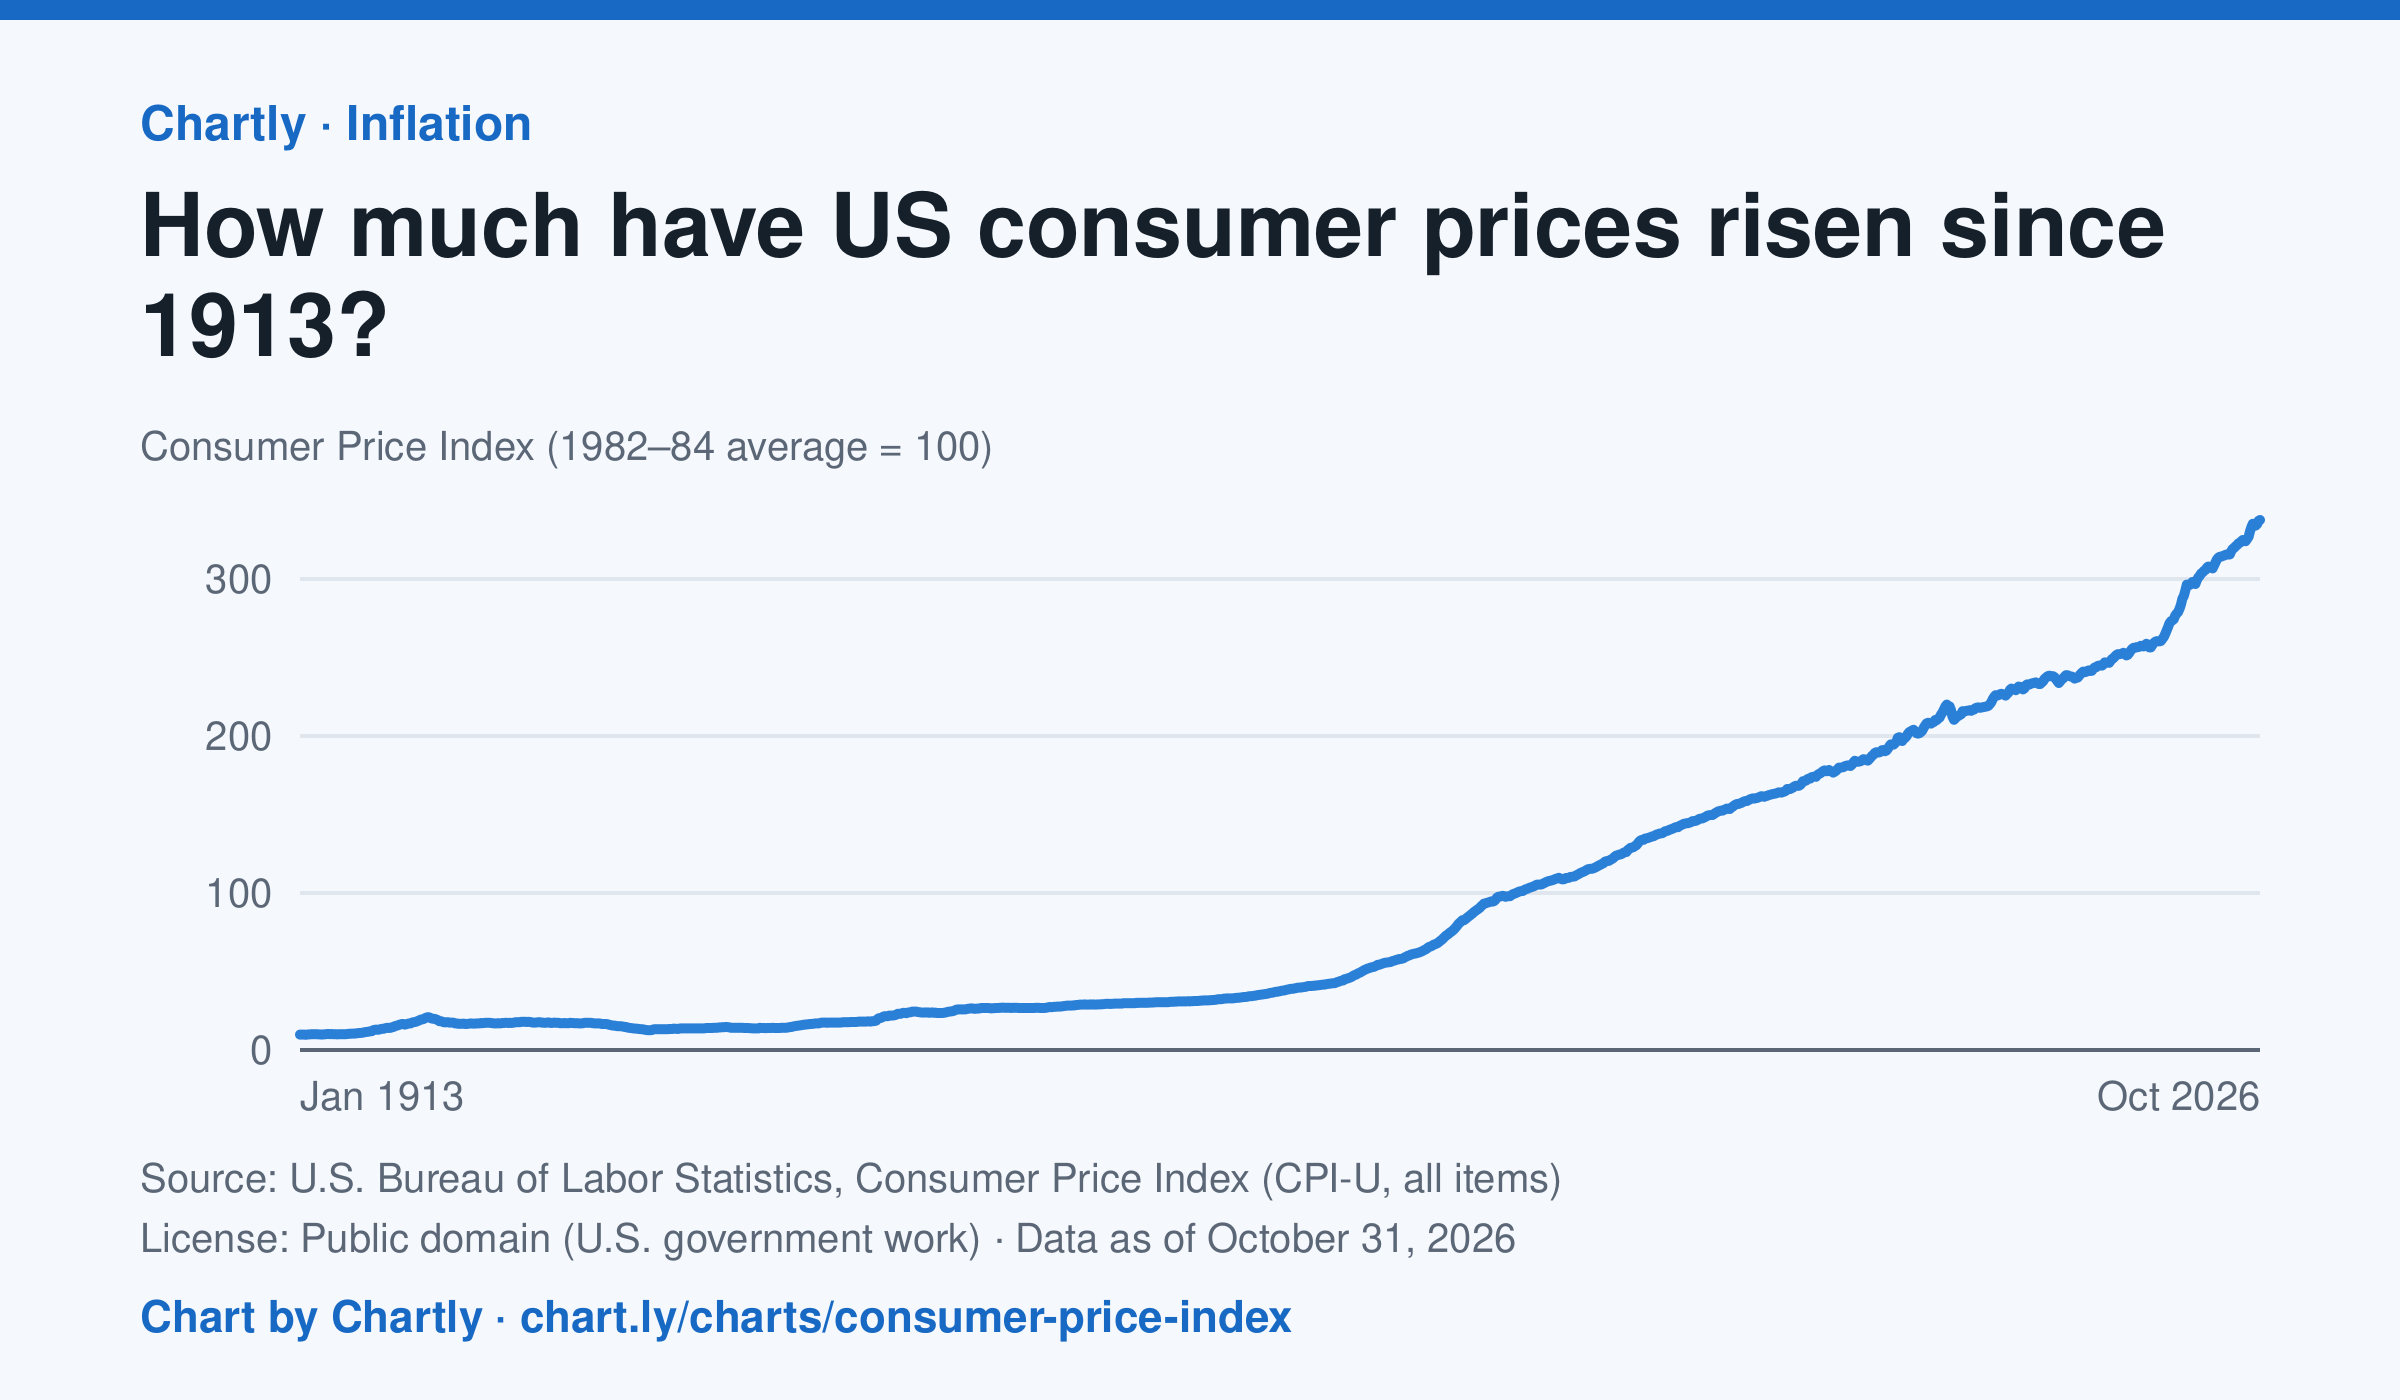
Consumer prices in October 2026 were 34 times their level in January 1913, when the Consumer Price Index begins: what cost $1 then cost about $34 in 2026. They were 2 times their level of January 2000. The index tracks what a typical basket of goods and services costs city households, with 100 as its 1982–84 average. Prices fell after 1920 and again in the early 1930s. October 2025 is missing because BLS collected no prices that month, during a lapse in federal funding.
Source: U.S. Bureau of Labor Statistics, Consumer Price Index (CPI-U, all items) (Public domain (U.S. government work)) · Data as of Oct 31, 2026
How to read this chart
The Consumer Price Index tracks the price of a fixed basket of things people buy, like food, rent, gas and clothing. It is an index, not dollars: prices in 1982 to 1984 are set to 100, so a value of 300 means the basket costs three times what it did then. Divide any two points to see how many times prices grew between them.
Questions
- How many times higher is the newest value than the first value on the chart? What does that mean for what $1 bought in 1913?
- Find a stretch where the line goes down. What does a falling index mean for prices, and when did it happen?
- Why does the government use a basket of many things instead of the price of just one item, like bread?
Chart and numbers: chart.ly/charts/consumer-price-index · More free charts at chart.ly
Chart 2 of 3 · Inflation
How much does a dozen eggs cost in the US?
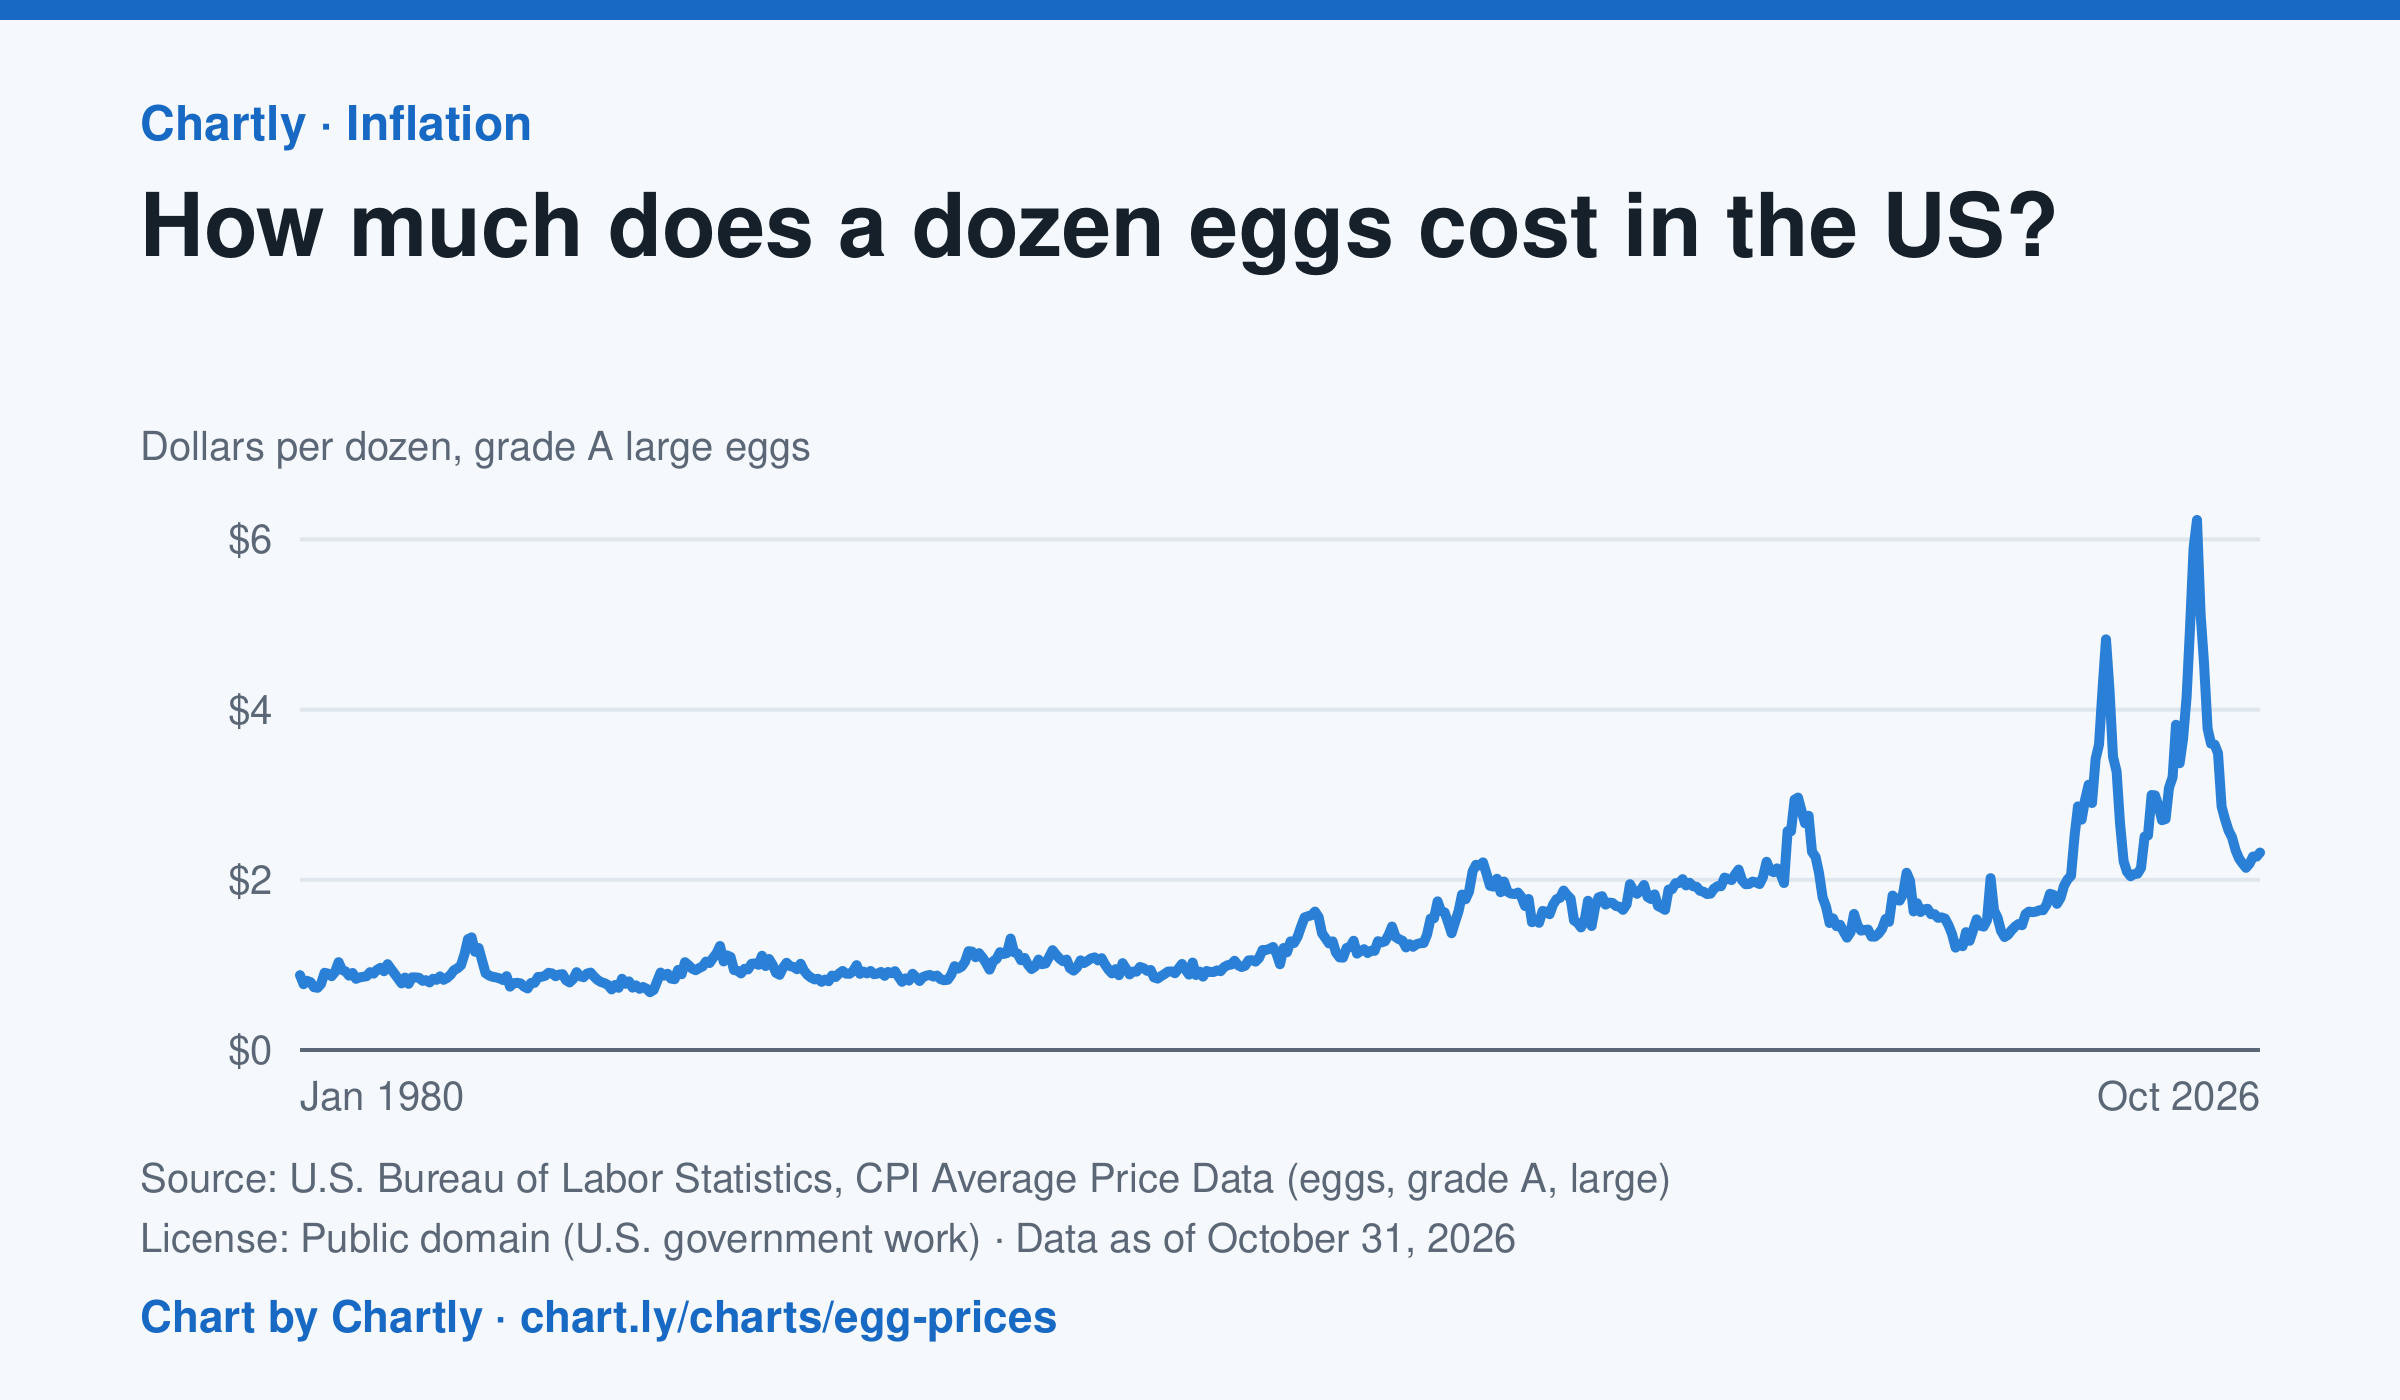
A dozen grade A large eggs averaged $2.32 in October 2026. The record so far is $6.23 in March 2025; prices spiked in 2023 and 2025 when bird flu cut the number of laying hens. Prices are BLS averages across US cities since 1980, when this series begins, in dollars of the day, not adjusted for inflation. October 2025 is missing because a lapse in federal funding stopped data collection.
Source: U.S. Bureau of Labor Statistics, CPI Average Price Data (eggs, grade A, large) (Public domain (U.S. government work)) · Data as of Oct 31, 2026
How to read this chart
Each point is the average price of a dozen grade A large eggs in U.S. cities in one month, in dollars. The axis starts at zero, so the height of the line shows the true price. Spikes often come when bird flu forces farms to lose laying hens, which cuts the supply of eggs.
Questions
- What was the highest price on the chart, and how many times more is it than the lowest?
- Showing your work, by what percent did the price change from the first month on the chart to the newest?
- When fewer hens are laying eggs but people want just as many, what happens to the price, and why?
Chart and numbers: chart.ly/charts/egg-prices · More free charts at chart.ly
Chart 3 of 3 · Wealth
What is the median household net worth by age?
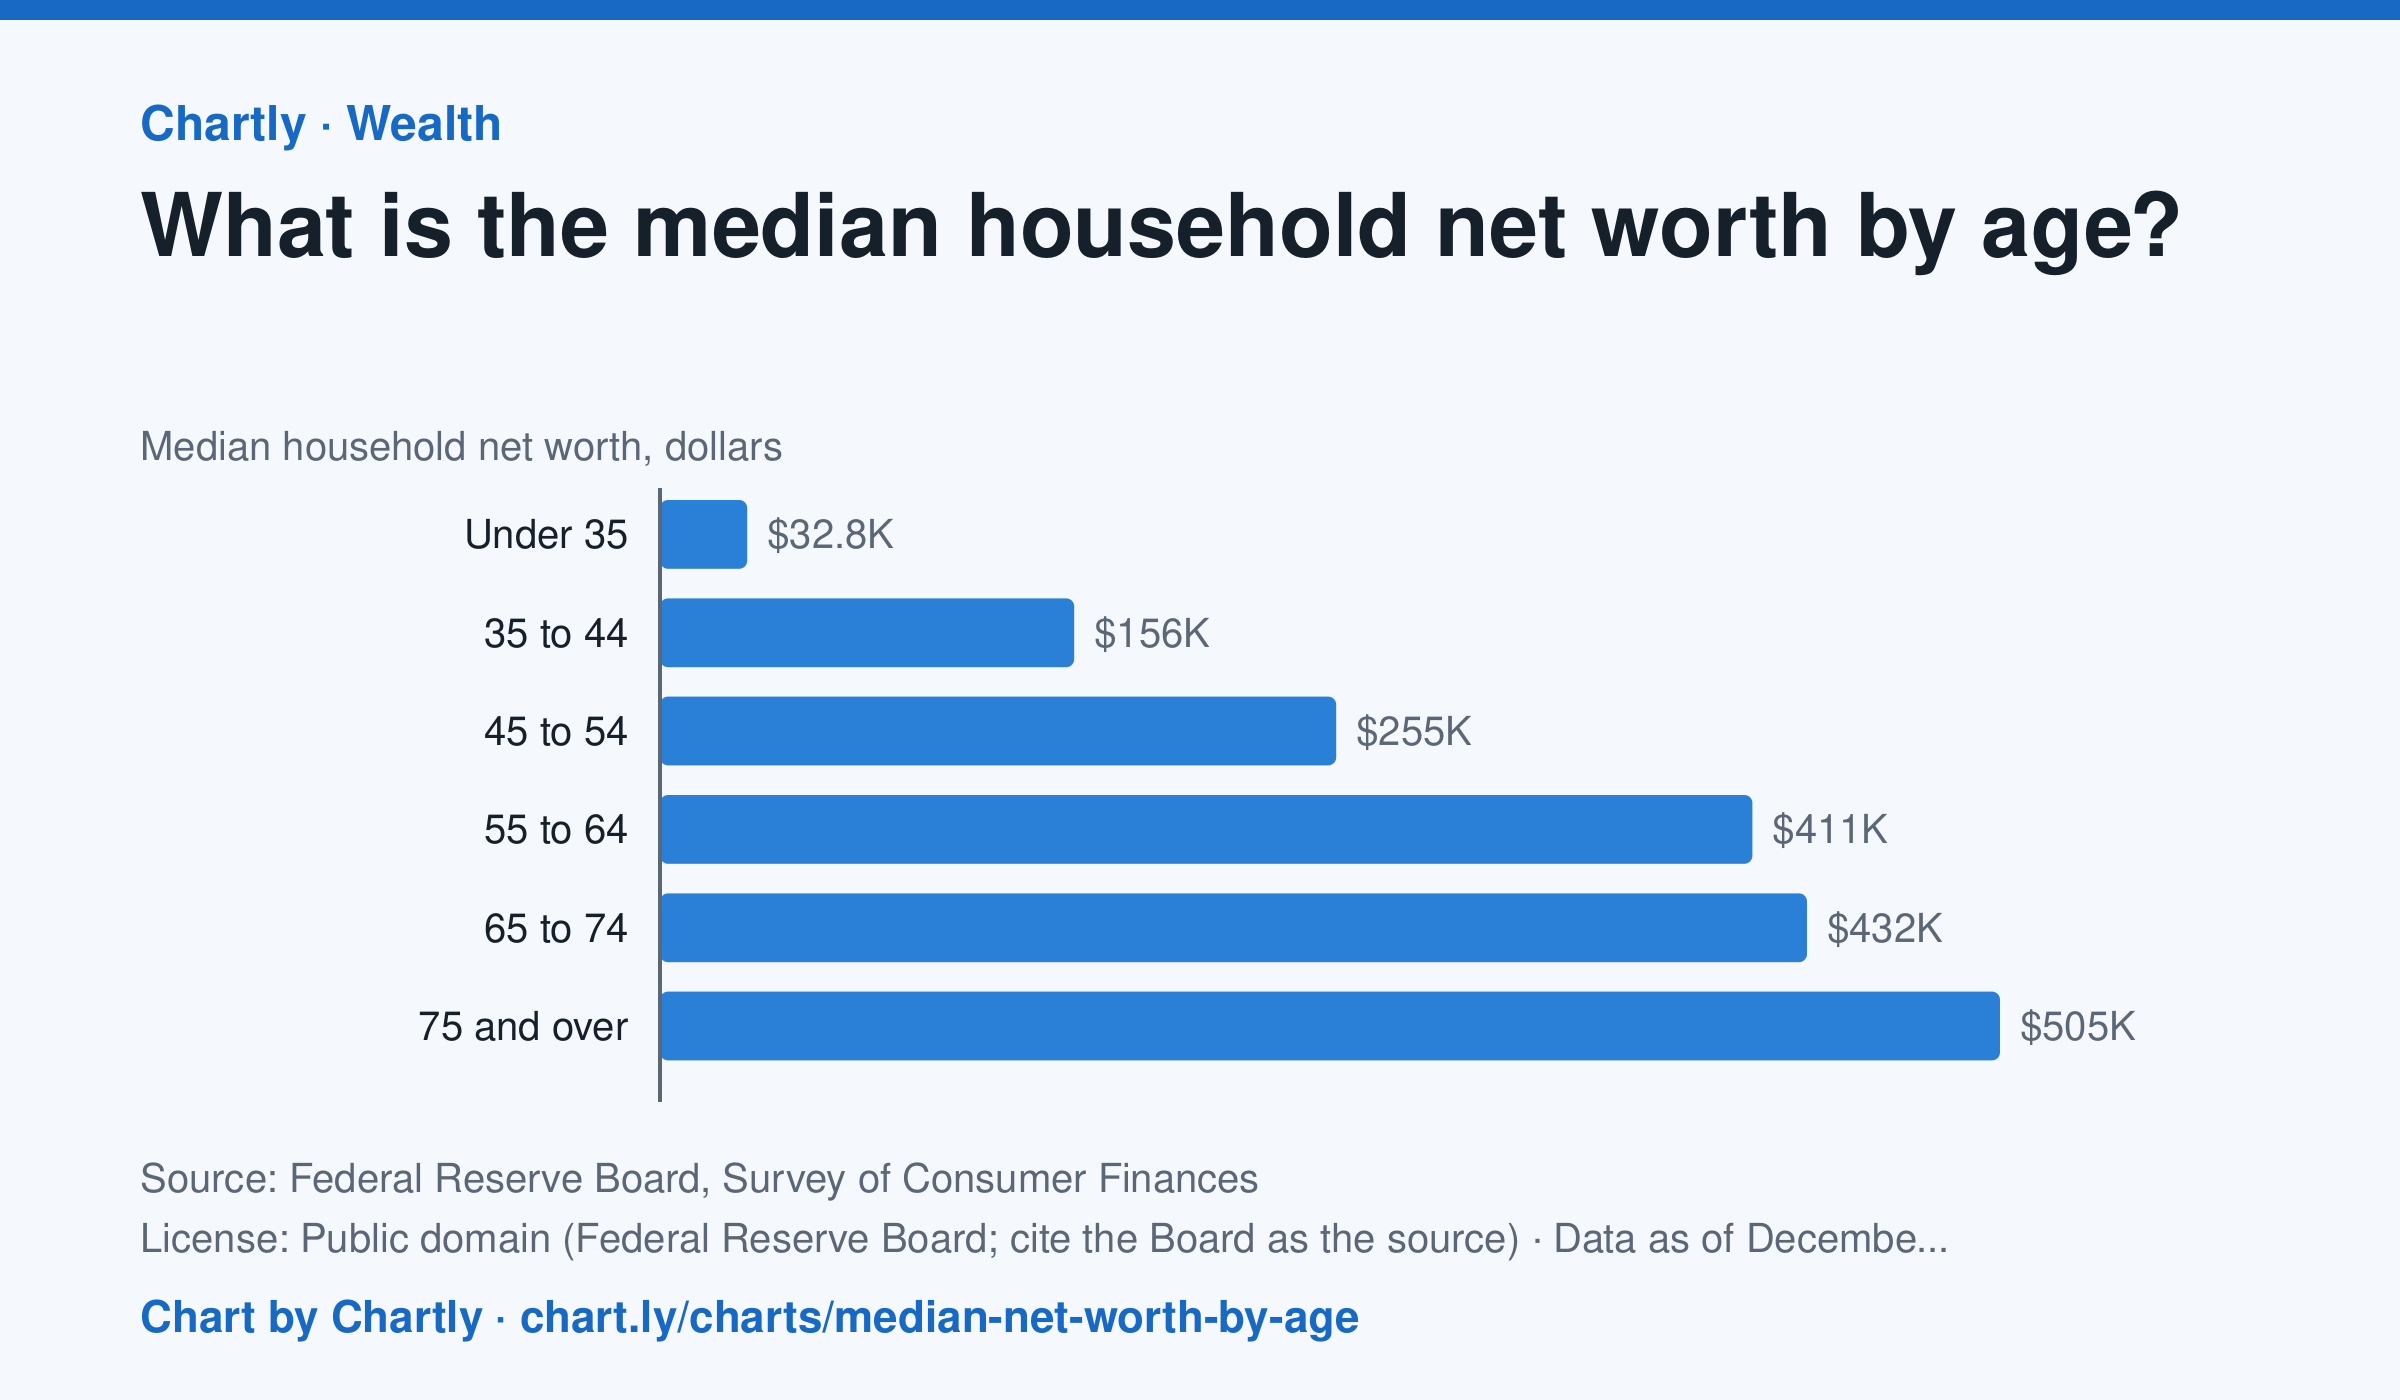
In the Federal Reserve's 2025 survey, the typical (median) household headed by someone under 35 had a net worth of $32,820, and one headed by someone 35 to 44 had $156,000. The median was $254,670 for ages 45 to 54, $411,340 for 55 to 64, $431,900 for 65 to 74 and $504,600 for 75 and over, about 15 times the under-35s'. The median is the household in the middle: half have more and half less. Averages are much higher, because a few households are very rich. Net worth is what a household owns (homes, retirement accounts, stocks, businesses, cars, bank accounts) minus what it owes (mortgages, student and car loans, credit cards). The survey is taken every three years, and figures are in dollars of the survey year. People of different ages also lived through different times, so this compares age groups, not one household's path through life.
Source: Federal Reserve Board, Survey of Consumer Finances (Public domain (Federal Reserve Board; cite the Board as the source)) · Data as of Dec 31, 2025
How to read this chart
Each bar is the median net worth of households, grouped by the age of the person who heads them. Net worth is what a household owns, such as a home, savings and retirement accounts, minus what it owes, such as a mortgage or student loans. The median is the household in the middle: half have more and half have less.
Questions
- Which age group has the highest median net worth, and about how many times the under-35 group's is it?
- Why might net worth keep rising through most of a working life, and why might it fall for the oldest group?
- A few very rich households pull the average far above the median. Why is the median a better picture of a typical household?
Chart and numbers: chart.ly/charts/median-net-worth-by-age · More free charts at chart.ly