Print this worksheet, or choose "Save as PDF" in the print window to share a file.
Chart worksheet
Charts to read and discuss
Name:
Class:
Date:
Chart 1 of 2 · Crime
Which big U.S. cities have the most car thefts?
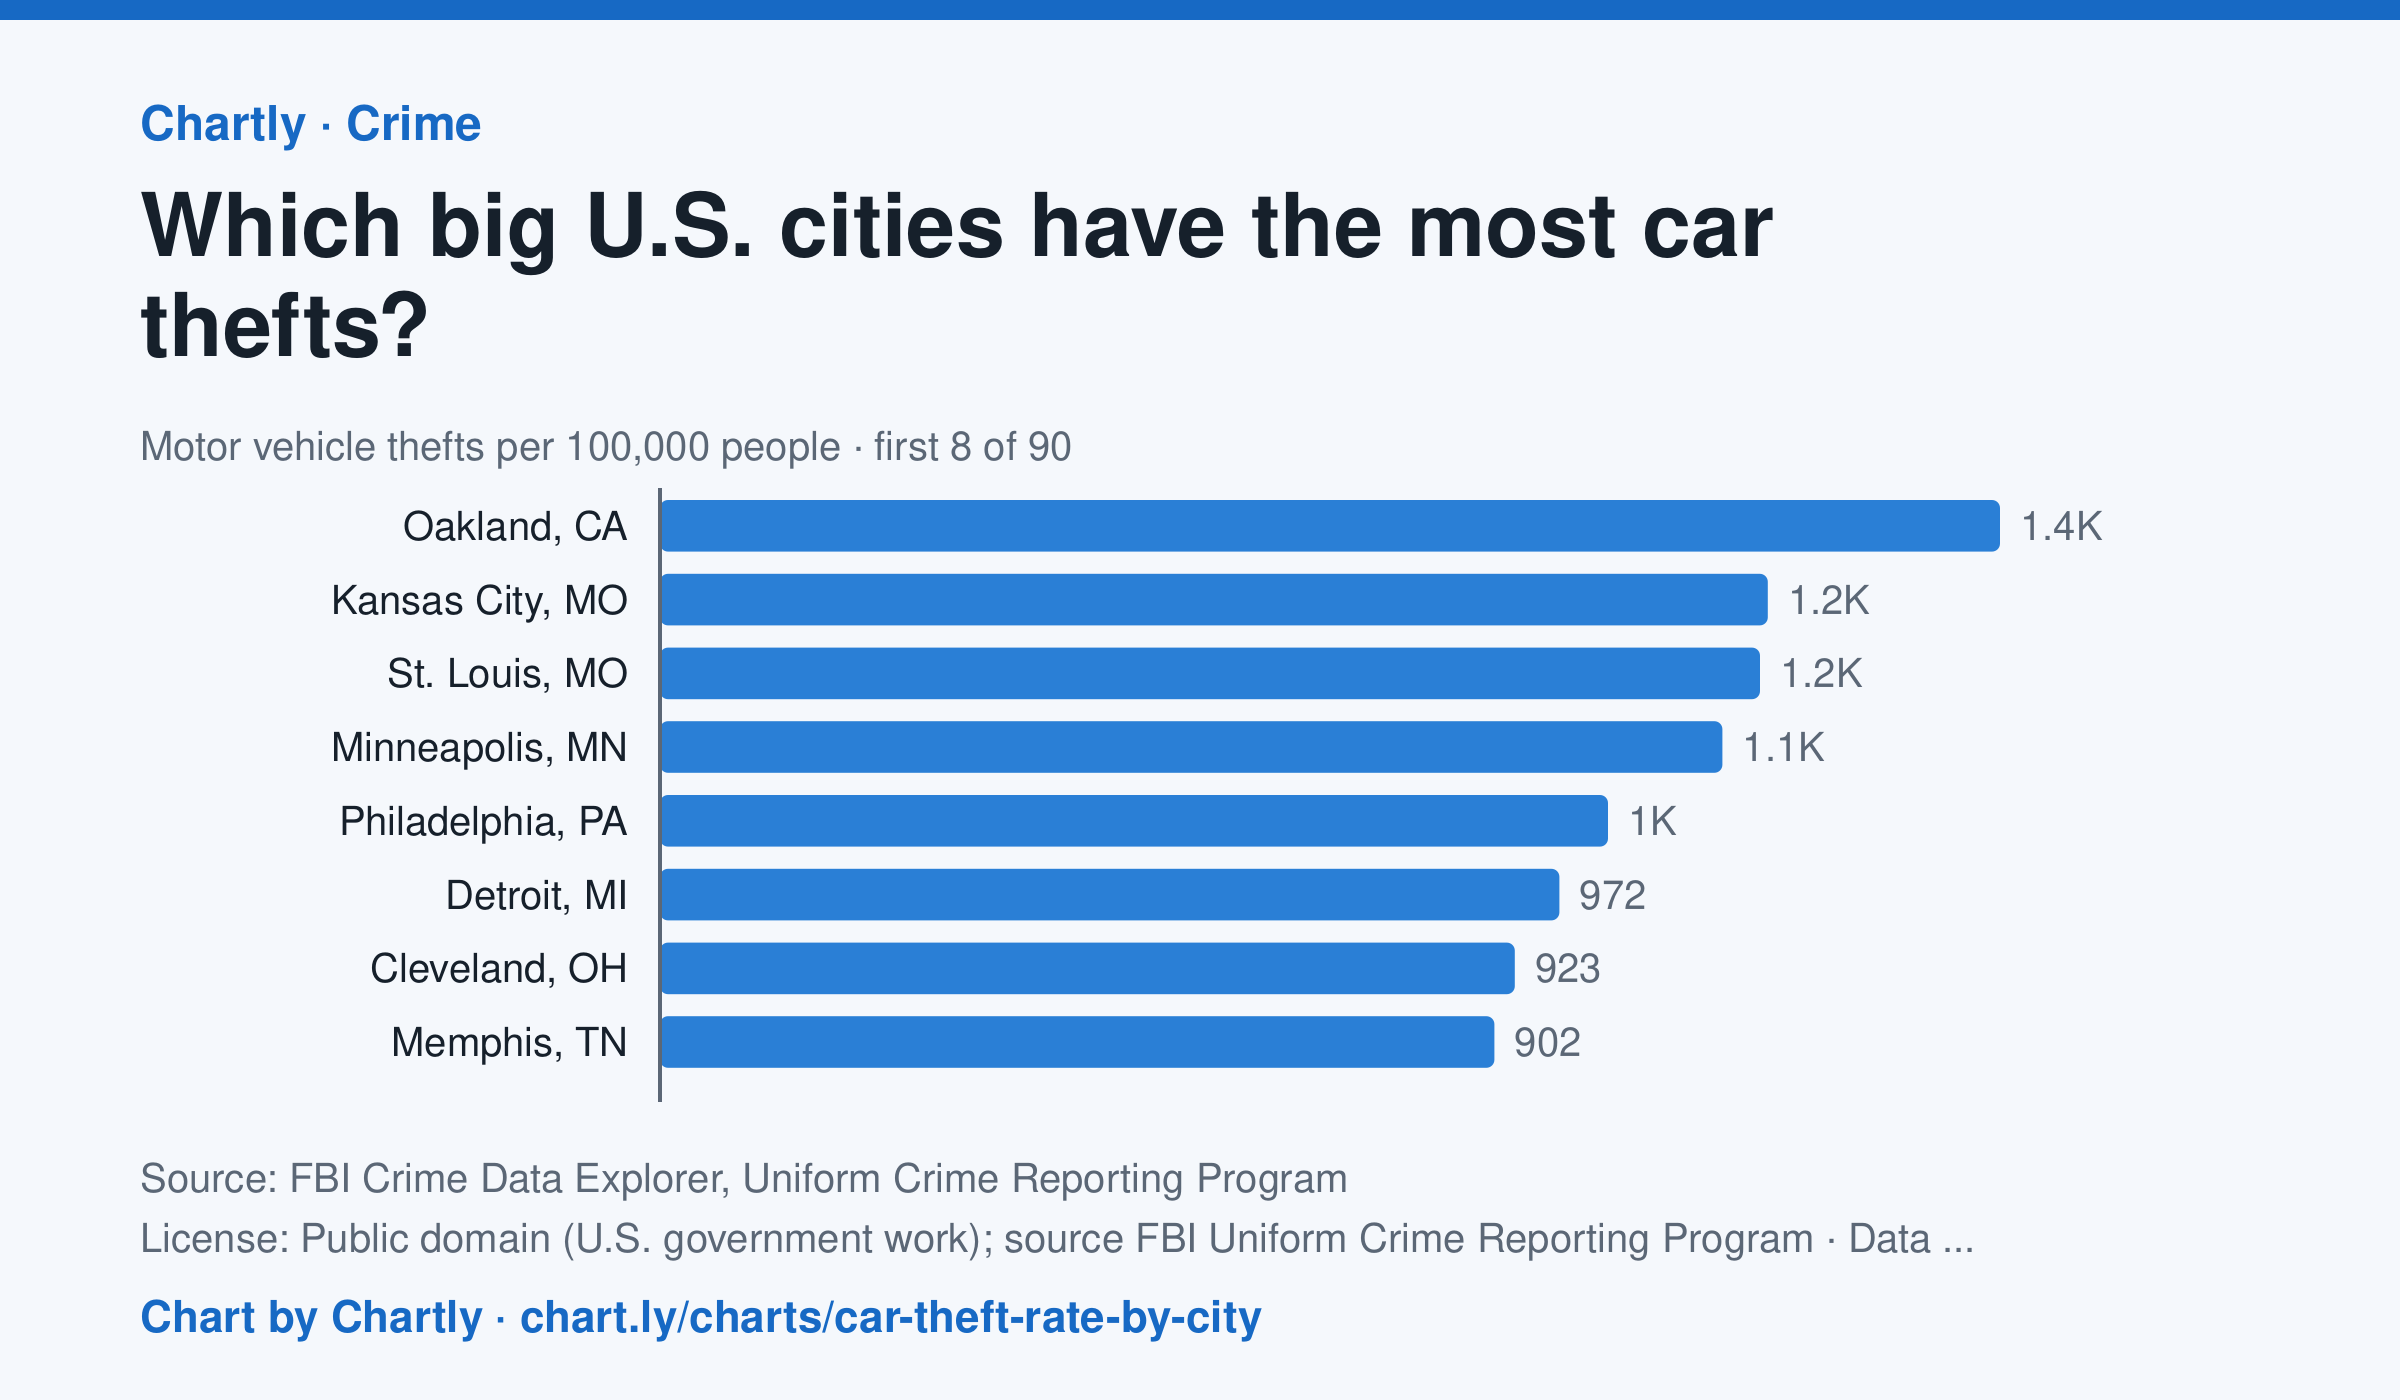
In 2025, Oakland, CA had the highest car theft rate of the 89 biggest U.S. cities whose police reported a full year to the FBI, about 1,448 per 100,000 people, followed by Kansas City, MO (1,197) and St. Louis, MO (1,188). Irvine, CA (52) and Gilbert, AZ (60) had the lowest; the U.S. rate was about 200. Car theft counts stolen cars, trucks, motorcycles and other vehicles. Departments that didn't report a full year are left out (for 2025, New Orleans, Orlando and St. Petersburg, Florida). Rates count only crimes reported to police. Each rate is per person the department serves, and a few, such as Las Vegas, Honolulu, Jacksonville and Louisville, serve their whole county. A city's rate also depends on where its borders fall, so compare cities with care.
Source: FBI Crime Data Explorer, Uniform Crime Reporting Program (Public domain (U.S. government work); source FBI Uniform Crime Reporting Program) · Data as of Dec 31, 2025
Questions
- In one sentence of your own, what does this chart show?
- Find the biggest change or difference in the chart. What might explain it?
- Who collected these numbers, and how recent are they? What else would you want to know before drawing a conclusion?
Chart and numbers: chart.ly/charts/car-theft-rate-by-city · More free charts at chart.ly
Chart 2 of 2 · Health
How long do Americans live, and how has that changed since 1900?
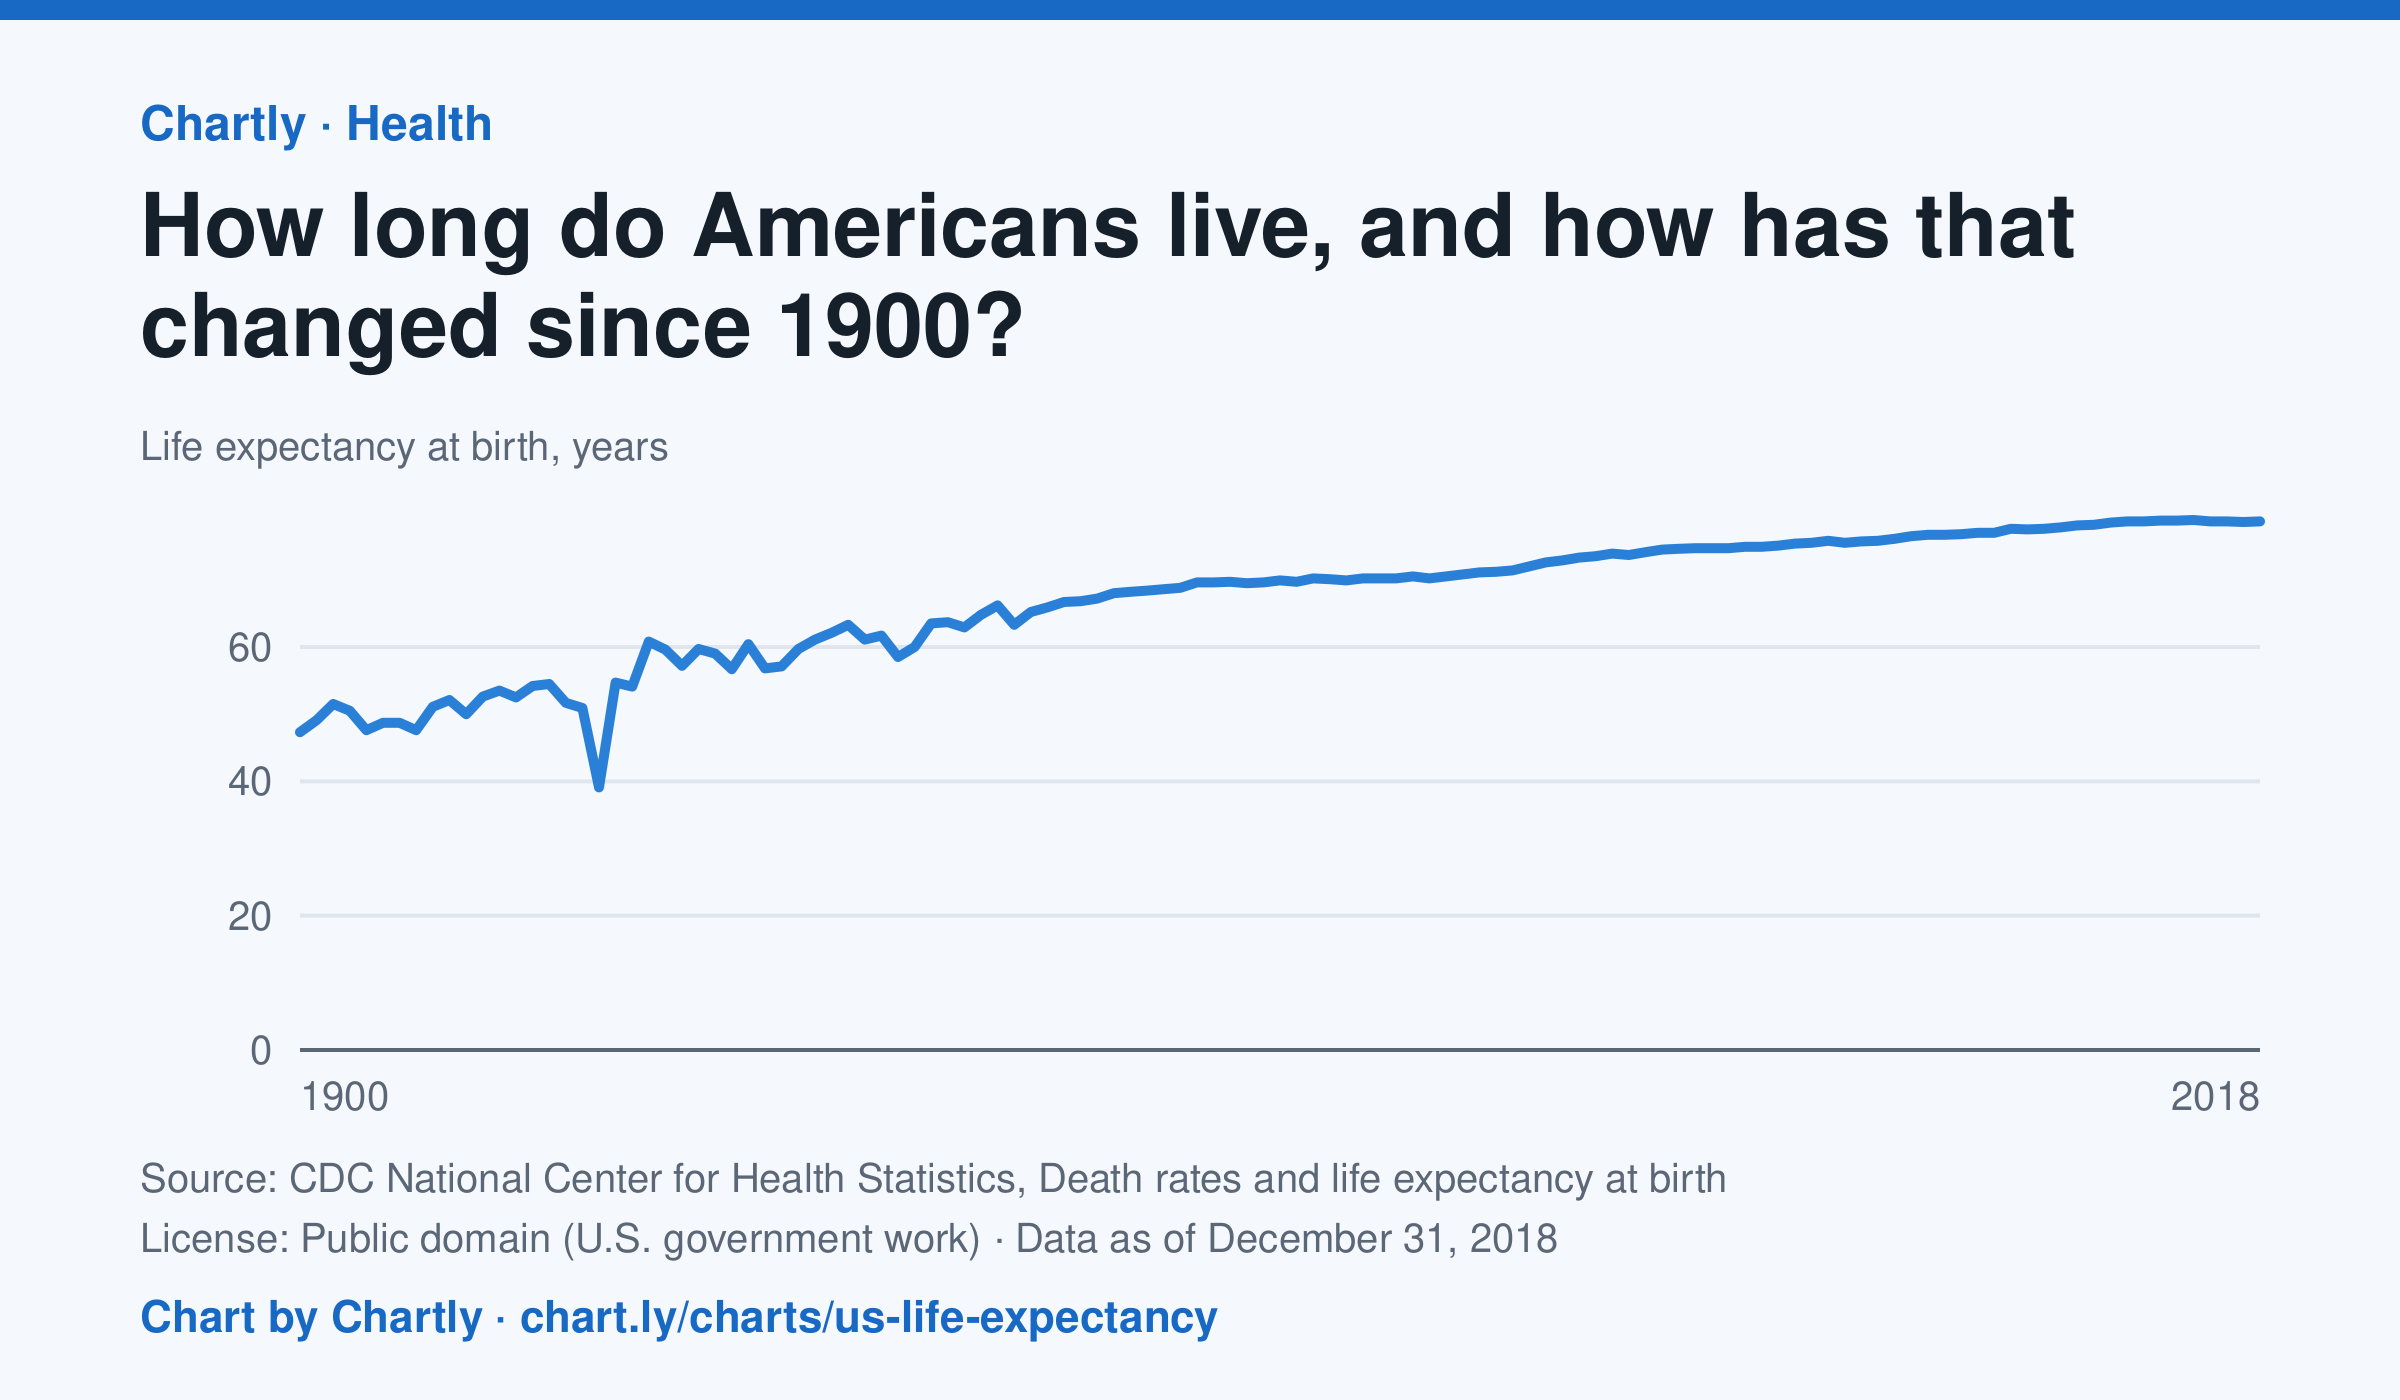
A baby born in the US in 2018 could expect to live 78.7 years, up from 47.3 in 1900. The sharpest drop was in 1918, to 39.1 years, during the influenza pandemic. This CDC dataset stops at 2018; later NCHS reports put life expectancy at 78.4 years in 2023 and 79.0 in 2024, after a fall during the COVID-19 pandemic.
Source: CDC National Center for Health Statistics, Death rates and life expectancy at birth (Public domain (U.S. government work)) · Data as of Dec 31, 2018
How to read this chart
Each point is how long a baby born in that year could expect to live, if death rates stayed as they were that year. It is an average, so it is pulled down a lot when many babies and young people die. Hover or tap a point to read its year and value.
Questions
- Find the sharpest drop on the chart. What happened in the world that year?
- Life expectancy in 1900 was under 50. Does that mean most adults died in their 40s? What else could lower the average?
- What changes in medicine, food or public health could explain the long rise?
Chart and numbers: chart.ly/charts/us-life-expectancy · More free charts at chart.ly