Print this worksheet, or choose "Save as PDF" in the print window to share a file.
Chart worksheet
AP Statistics chart assignment
Name:
Class:
Date:
Chart 1 of 2 · Baby names
How many babies were given your name each year since 1880?
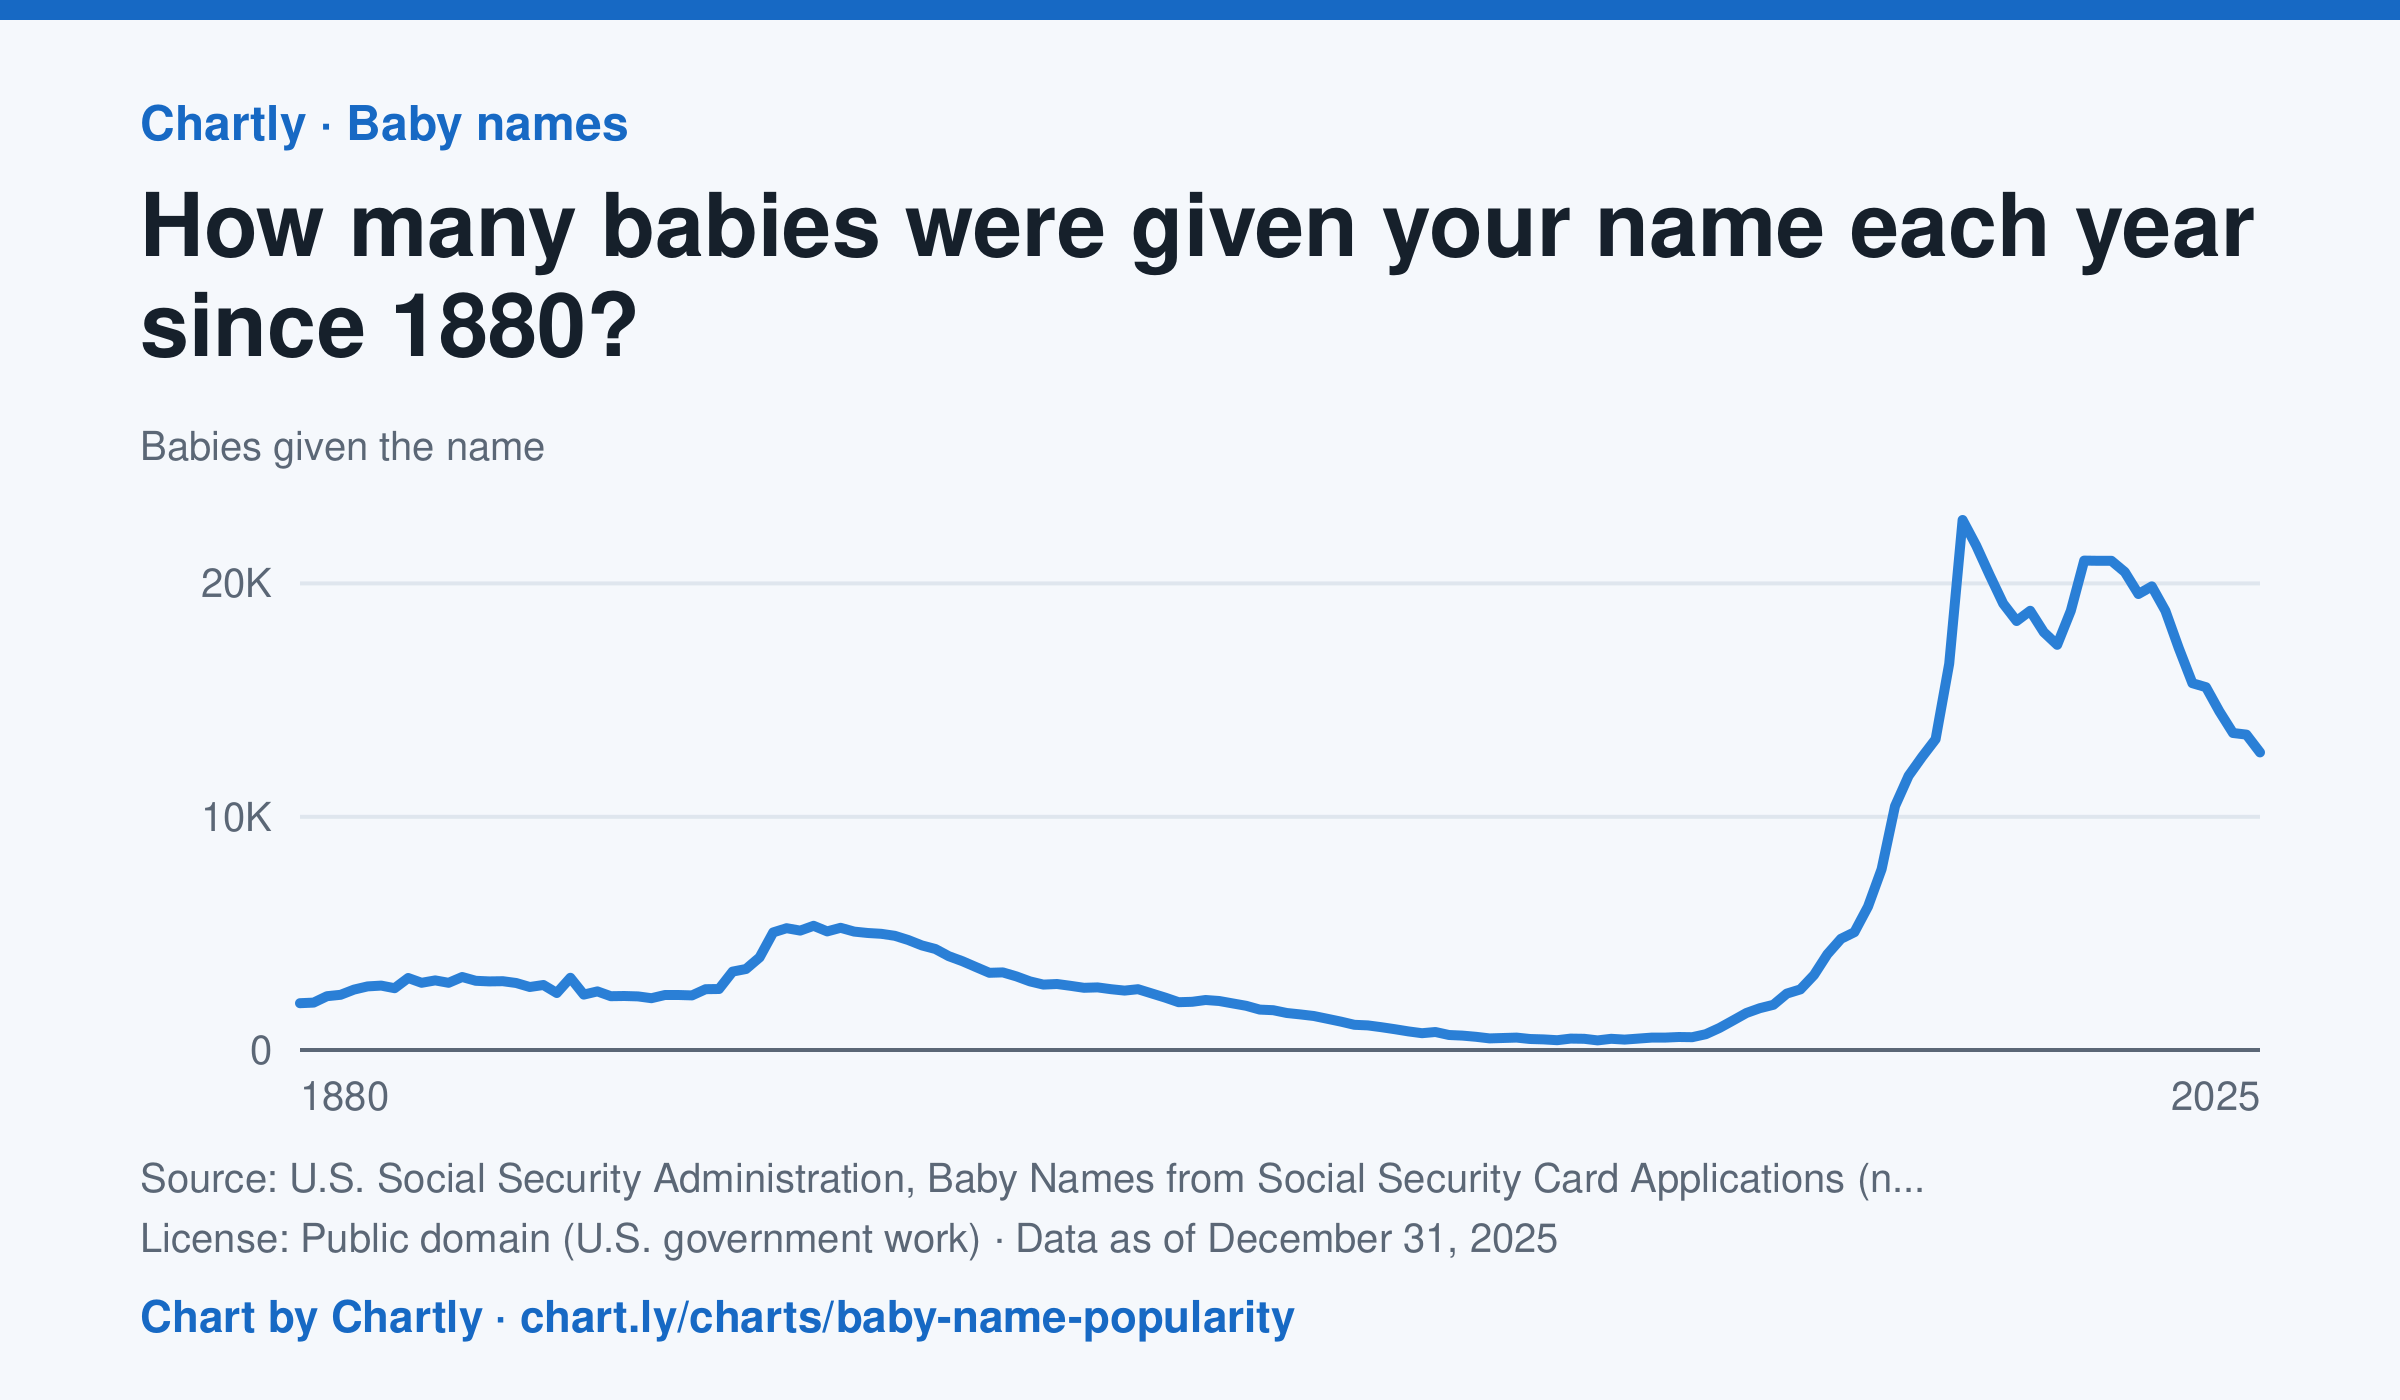
Type any name to see how many U.S. babies were given it each year since 1880, for girls or boys. Emma, shown first, went from 2,003 girls in 1880 down to 414 in 1976, then back up to a peak of 22,719 in 2003; in 2025 it was 12,754. The counts come from Social Security card applications, so the early years undercount everyone. A year with fewer than 5 babies of a name shows as 0, because Social Security leaves those names out for privacy.
Source: U.S. Social Security Administration, Baby Names from Social Security Card Applications (national data) (Public domain (U.S. government work)) · Data as of Dec 31, 2025
How to read this chart
Each point is the number of U.S. babies given a name in one year, from Social Security card applications. Type any name to see its line, for girls or boys. These are counts, not shares, and far more babies are born today than in 1880, so a count can grow just because the country did.
Questions
- Look up your own name or a friend's. When was it most popular, and what might explain that?
- Why are counts from the 1880s lower than counts today, even for names that were very popular then?
- How could you change these counts to fairly compare a name's popularity in 1900 with today?
Chart and numbers: chart.ly/charts/baby-name-popularity · More free charts at chart.ly
Chart 2 of 2 · World
How has the world's population grown since 1960?
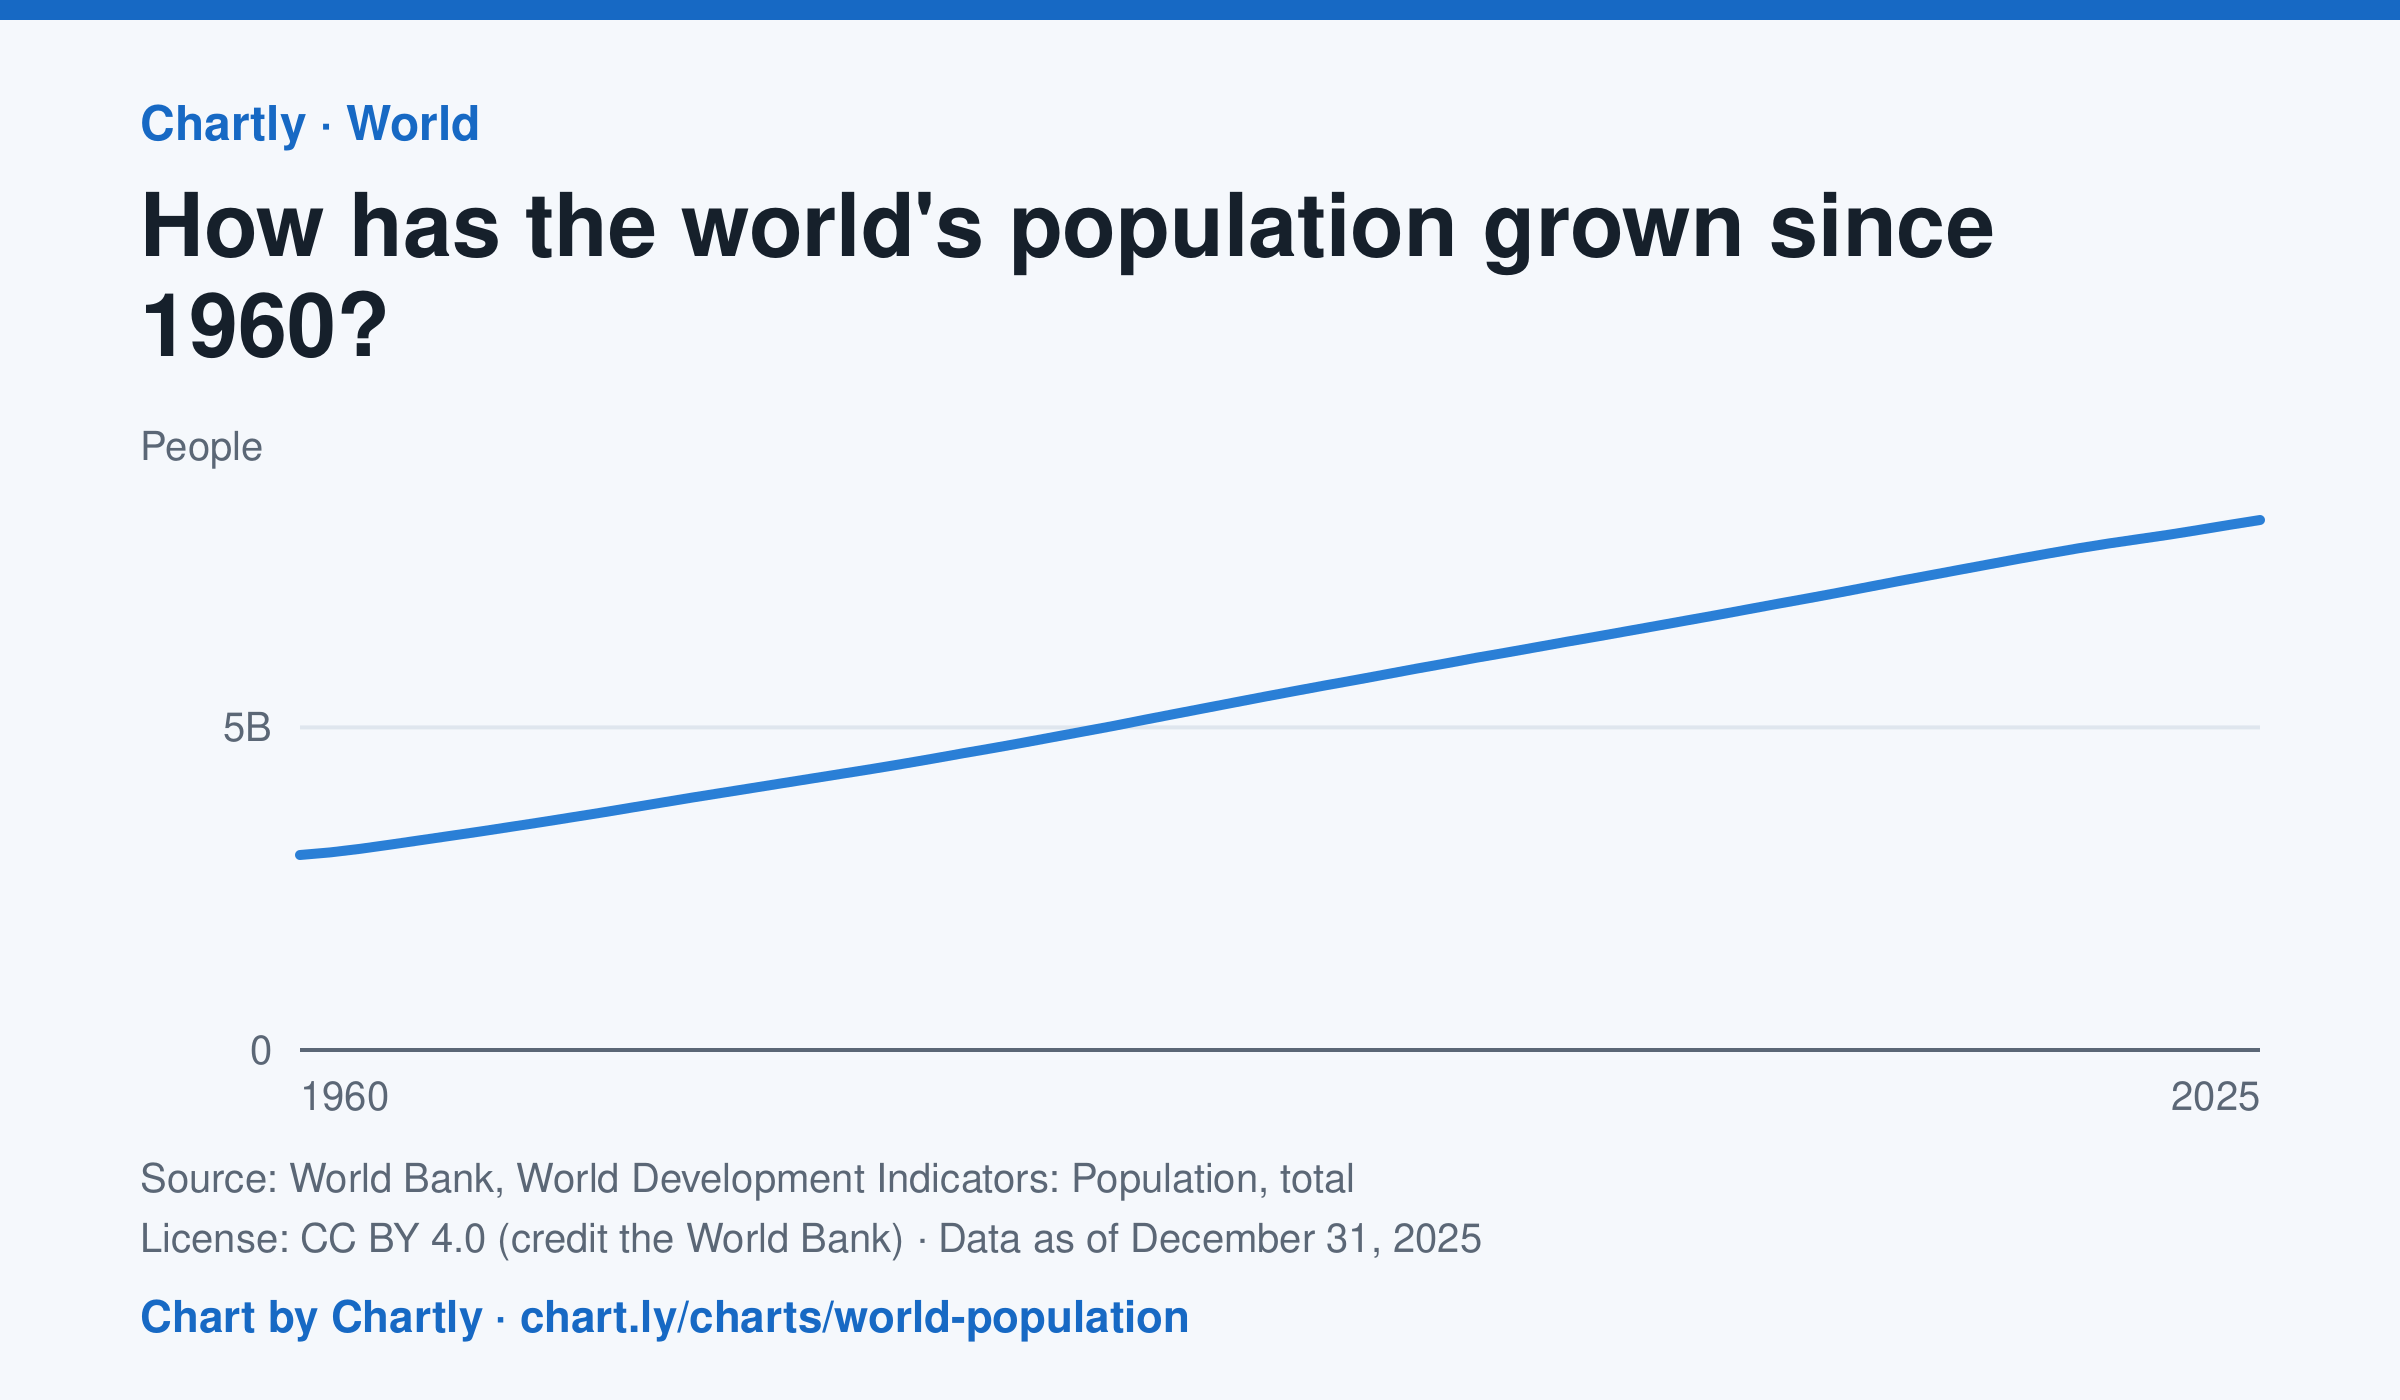
The world had 8.22 billion people in 2025, about 2.7 times the 3.02 billion of 1960. It passed 8 billion in 2023. Figures are mid-year estimates from the United Nations, which revises them as new censuses come in.
Source: World Bank, World Development Indicators: Population, total (CC BY 4.0 (credit the World Bank)) · Data as of Dec 31, 2025
How to read this chart
Each point is the number of people alive in the world in the middle of that year, estimated by the United Nations. The axis starts at zero, so the height of the line shows the true size. Look at how steep the line is to see how fast the population grew.
Questions
- Judging from the chart, about how many years did it take the world to add its most recent billion people?
- Is the line getting steeper or flatter in recent years? What does that tell you about the growth rate?
- These numbers are estimates that the UN revises. Why is it hard to count every person on Earth?
Chart and numbers: chart.ly/charts/world-population · More free charts at chart.ly