Print this worksheet, or choose "Save as PDF" in the print window to share a file.
Chart worksheet
Charts to read and discuss
Name:
Class:
Date:
Chart 1 of 3 · Baby names
How many babies were given your name each year since 1880?
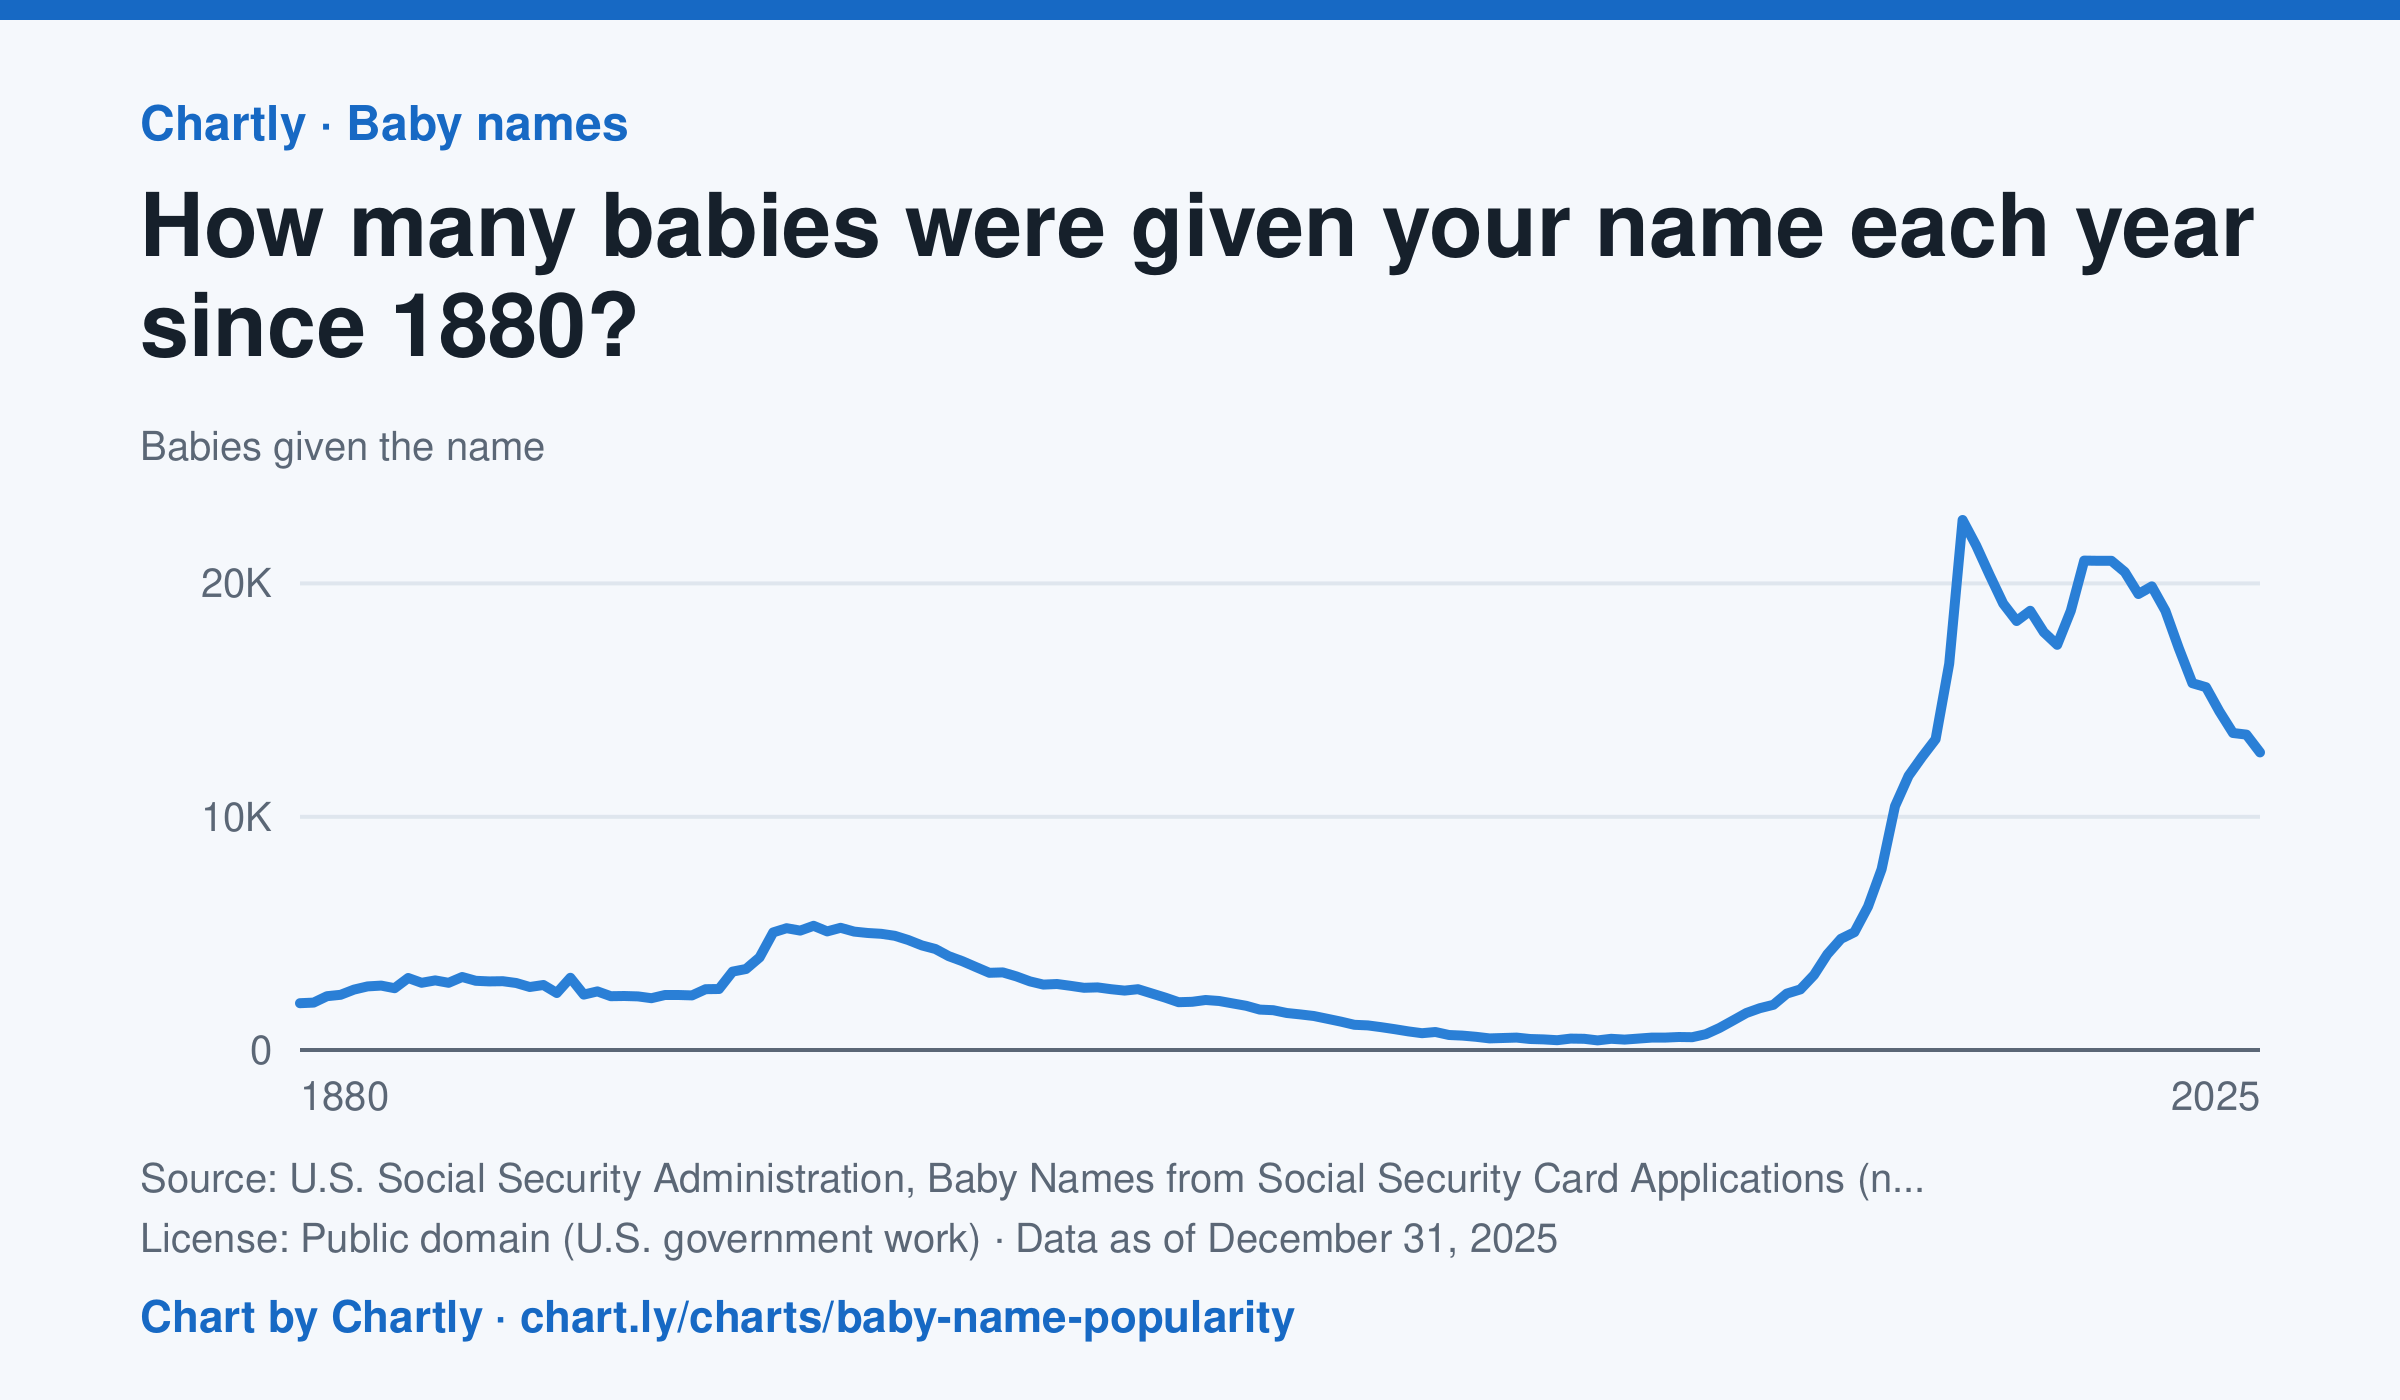
Type any name to see how many U.S. babies were given it each year since 1880, for girls or boys. Emma, shown first, went from 2,003 girls in 1880 down to 414 in 1976, then back up to a peak of 22,719 in 2003; in 2025 it was 12,754. The counts come from Social Security card applications, so the early years undercount everyone. A year with fewer than 5 babies of a name shows as 0, because Social Security leaves those names out for privacy.
Source: U.S. Social Security Administration, Baby Names from Social Security Card Applications (national data) (Public domain (U.S. government work)) · Data as of Dec 31, 2025
How to read this chart
Each point is the number of U.S. babies given a name in one year, from Social Security card applications. Type any name to see its line, for girls or boys. These are counts, not shares, and far more babies are born today than in 1880, so a count can grow just because the country did.
Questions
- Look up your own name or a friend's. When was it most popular, and what might explain that?
- Why are counts from the 1880s lower than counts today, even for names that were very popular then?
- How could you change these counts to fairly compare a name's popularity in 1900 with today?
Chart and numbers: chart.ly/charts/baby-name-popularity · More free charts at chart.ly
Chart 2 of 3 · Energy
How much has a gallon of gas cost in the US since 1990?
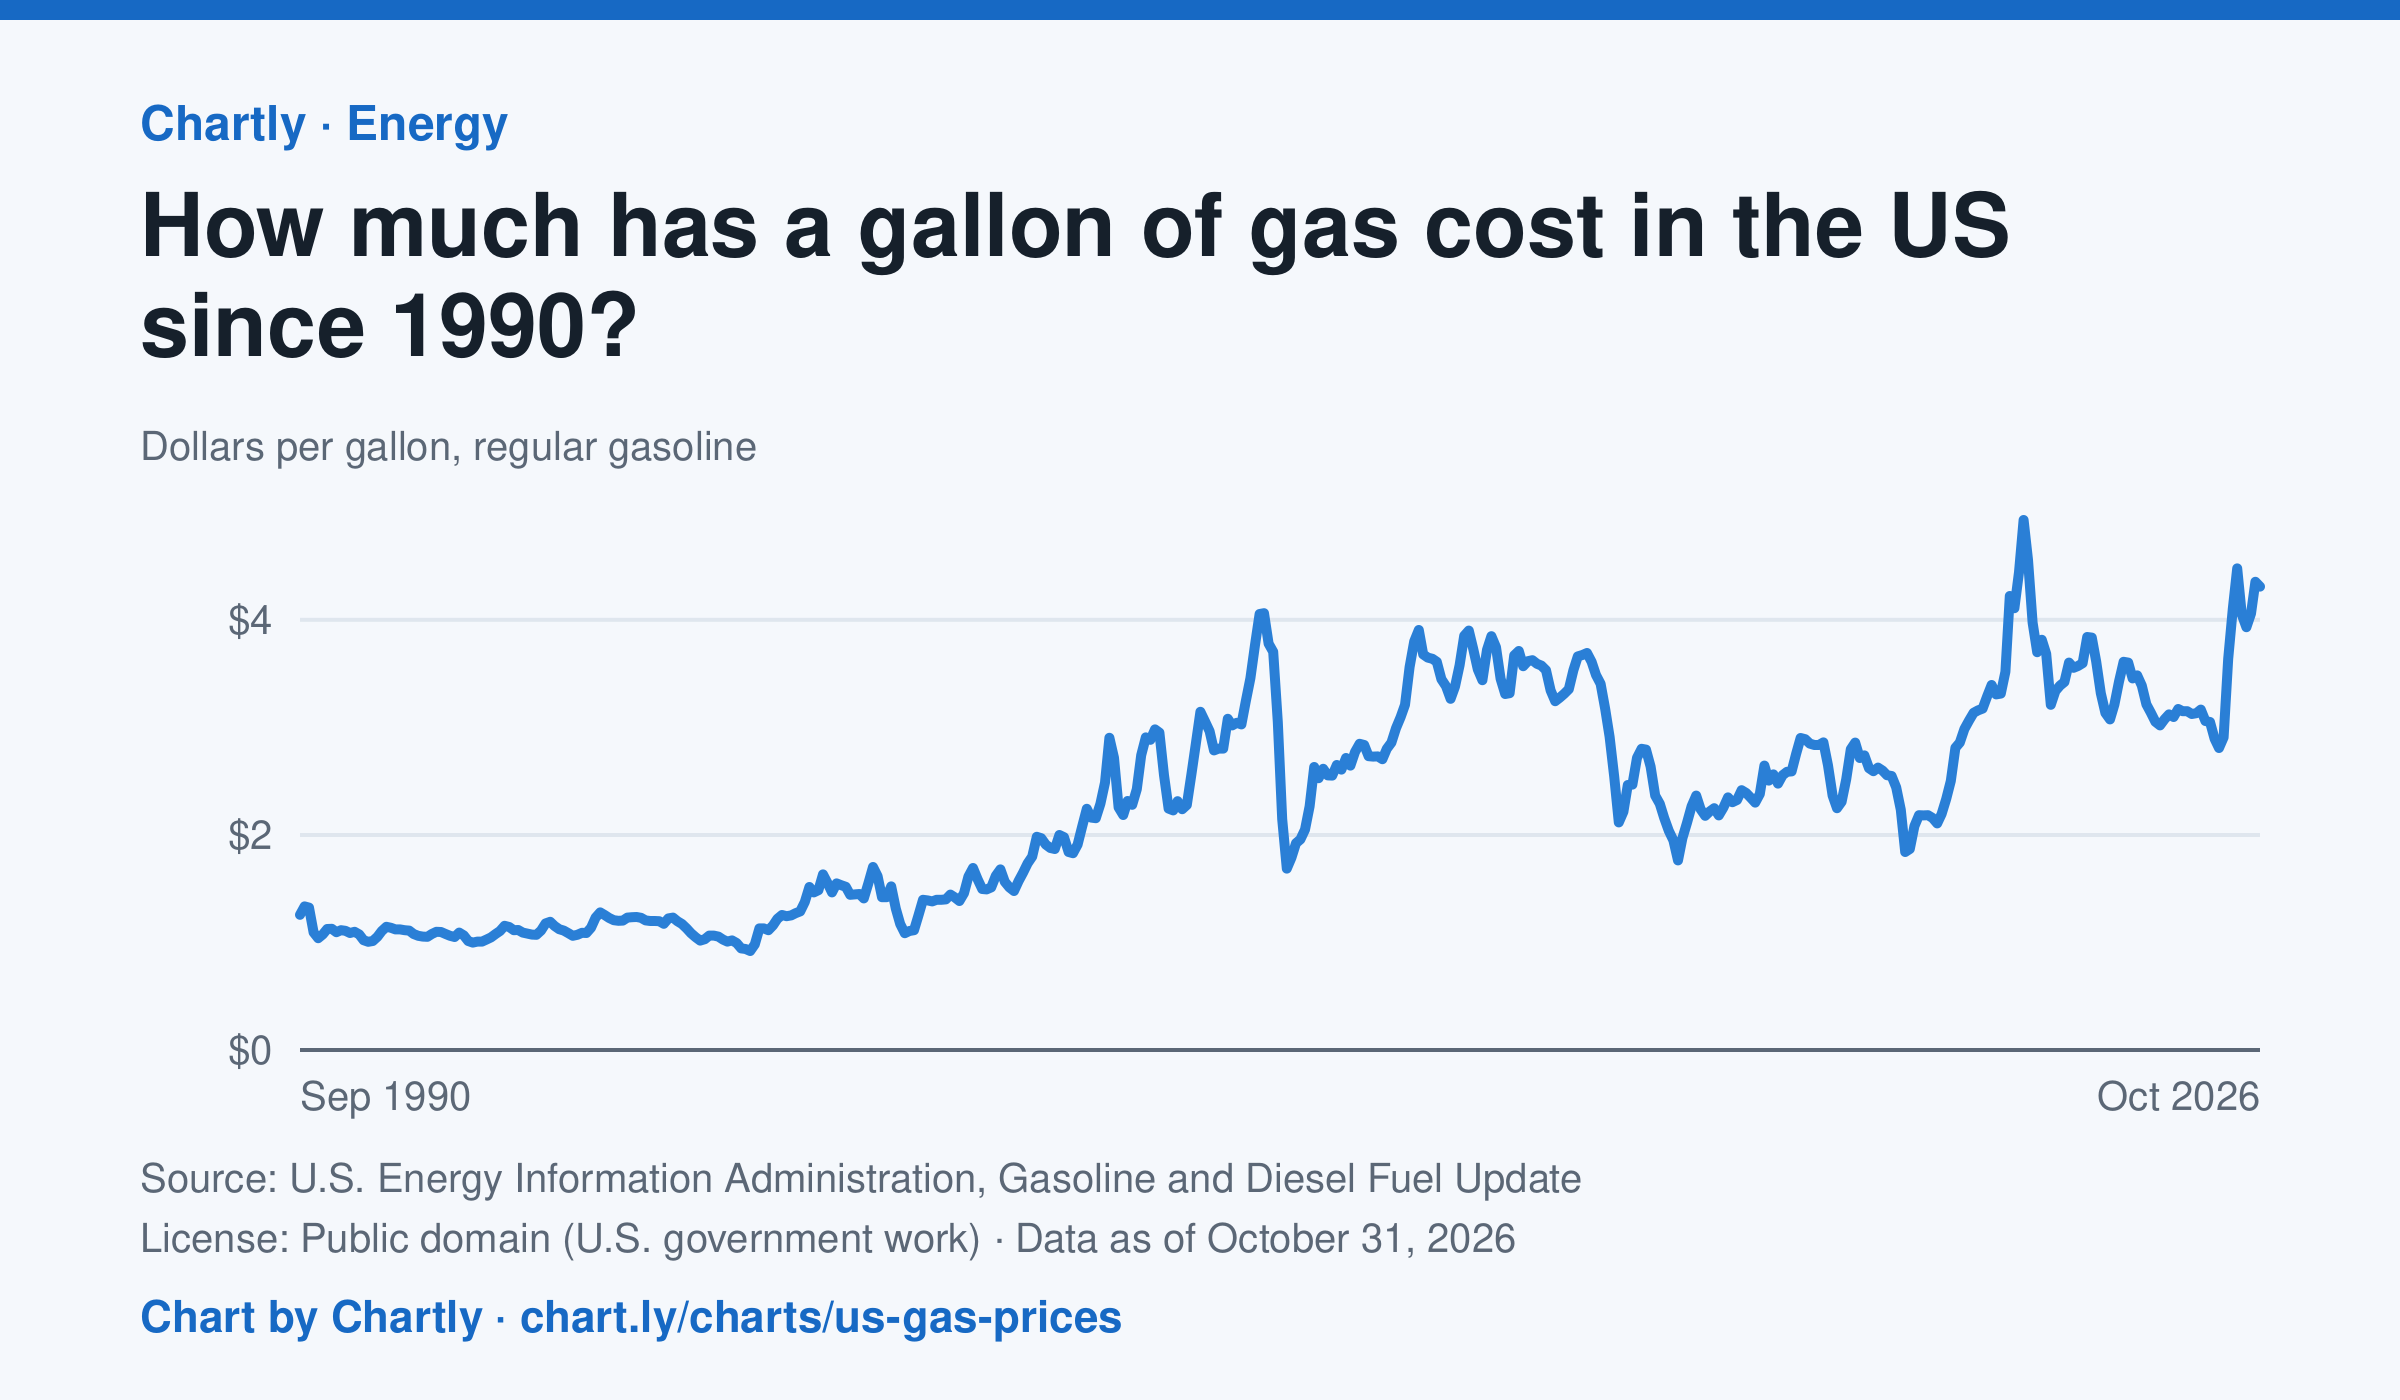
Regular gas averaged $4.31 a gallon in October 2026. The monthly average peaked at $4.93 in June 2022 and was lowest at $0.92 in February 1999. Each point averages EIA's weekly survey of gas stations nationwide, taxes included, in dollars of the day, not adjusted for inflation.
Source: U.S. Energy Information Administration, Gasoline and Diesel Fuel Update (Public domain (U.S. government work)) · Data as of Oct 31, 2026
How to read this chart
Each point is the average price of a gallon of regular gasoline in one month, in dollars, including taxes. The prices are not adjusted for inflation, so a dollar in 1990 bought more than a dollar does now. Gas prices follow the price of crude oil, so world events can move them quickly.
Questions
- Find the highest and lowest months on the chart. How many dollars apart are they?
- Pick a sharp drop on the chart. What world event could have made people use less gas or oil cost less?
- The chart isn't adjusted for inflation. How would that change the way the 1990s prices compare with today's?
Chart and numbers: chart.ly/charts/us-gas-prices · More free charts at chart.ly
Chart 3 of 3 · Space
How many planets outside our solar system are discovered each year?
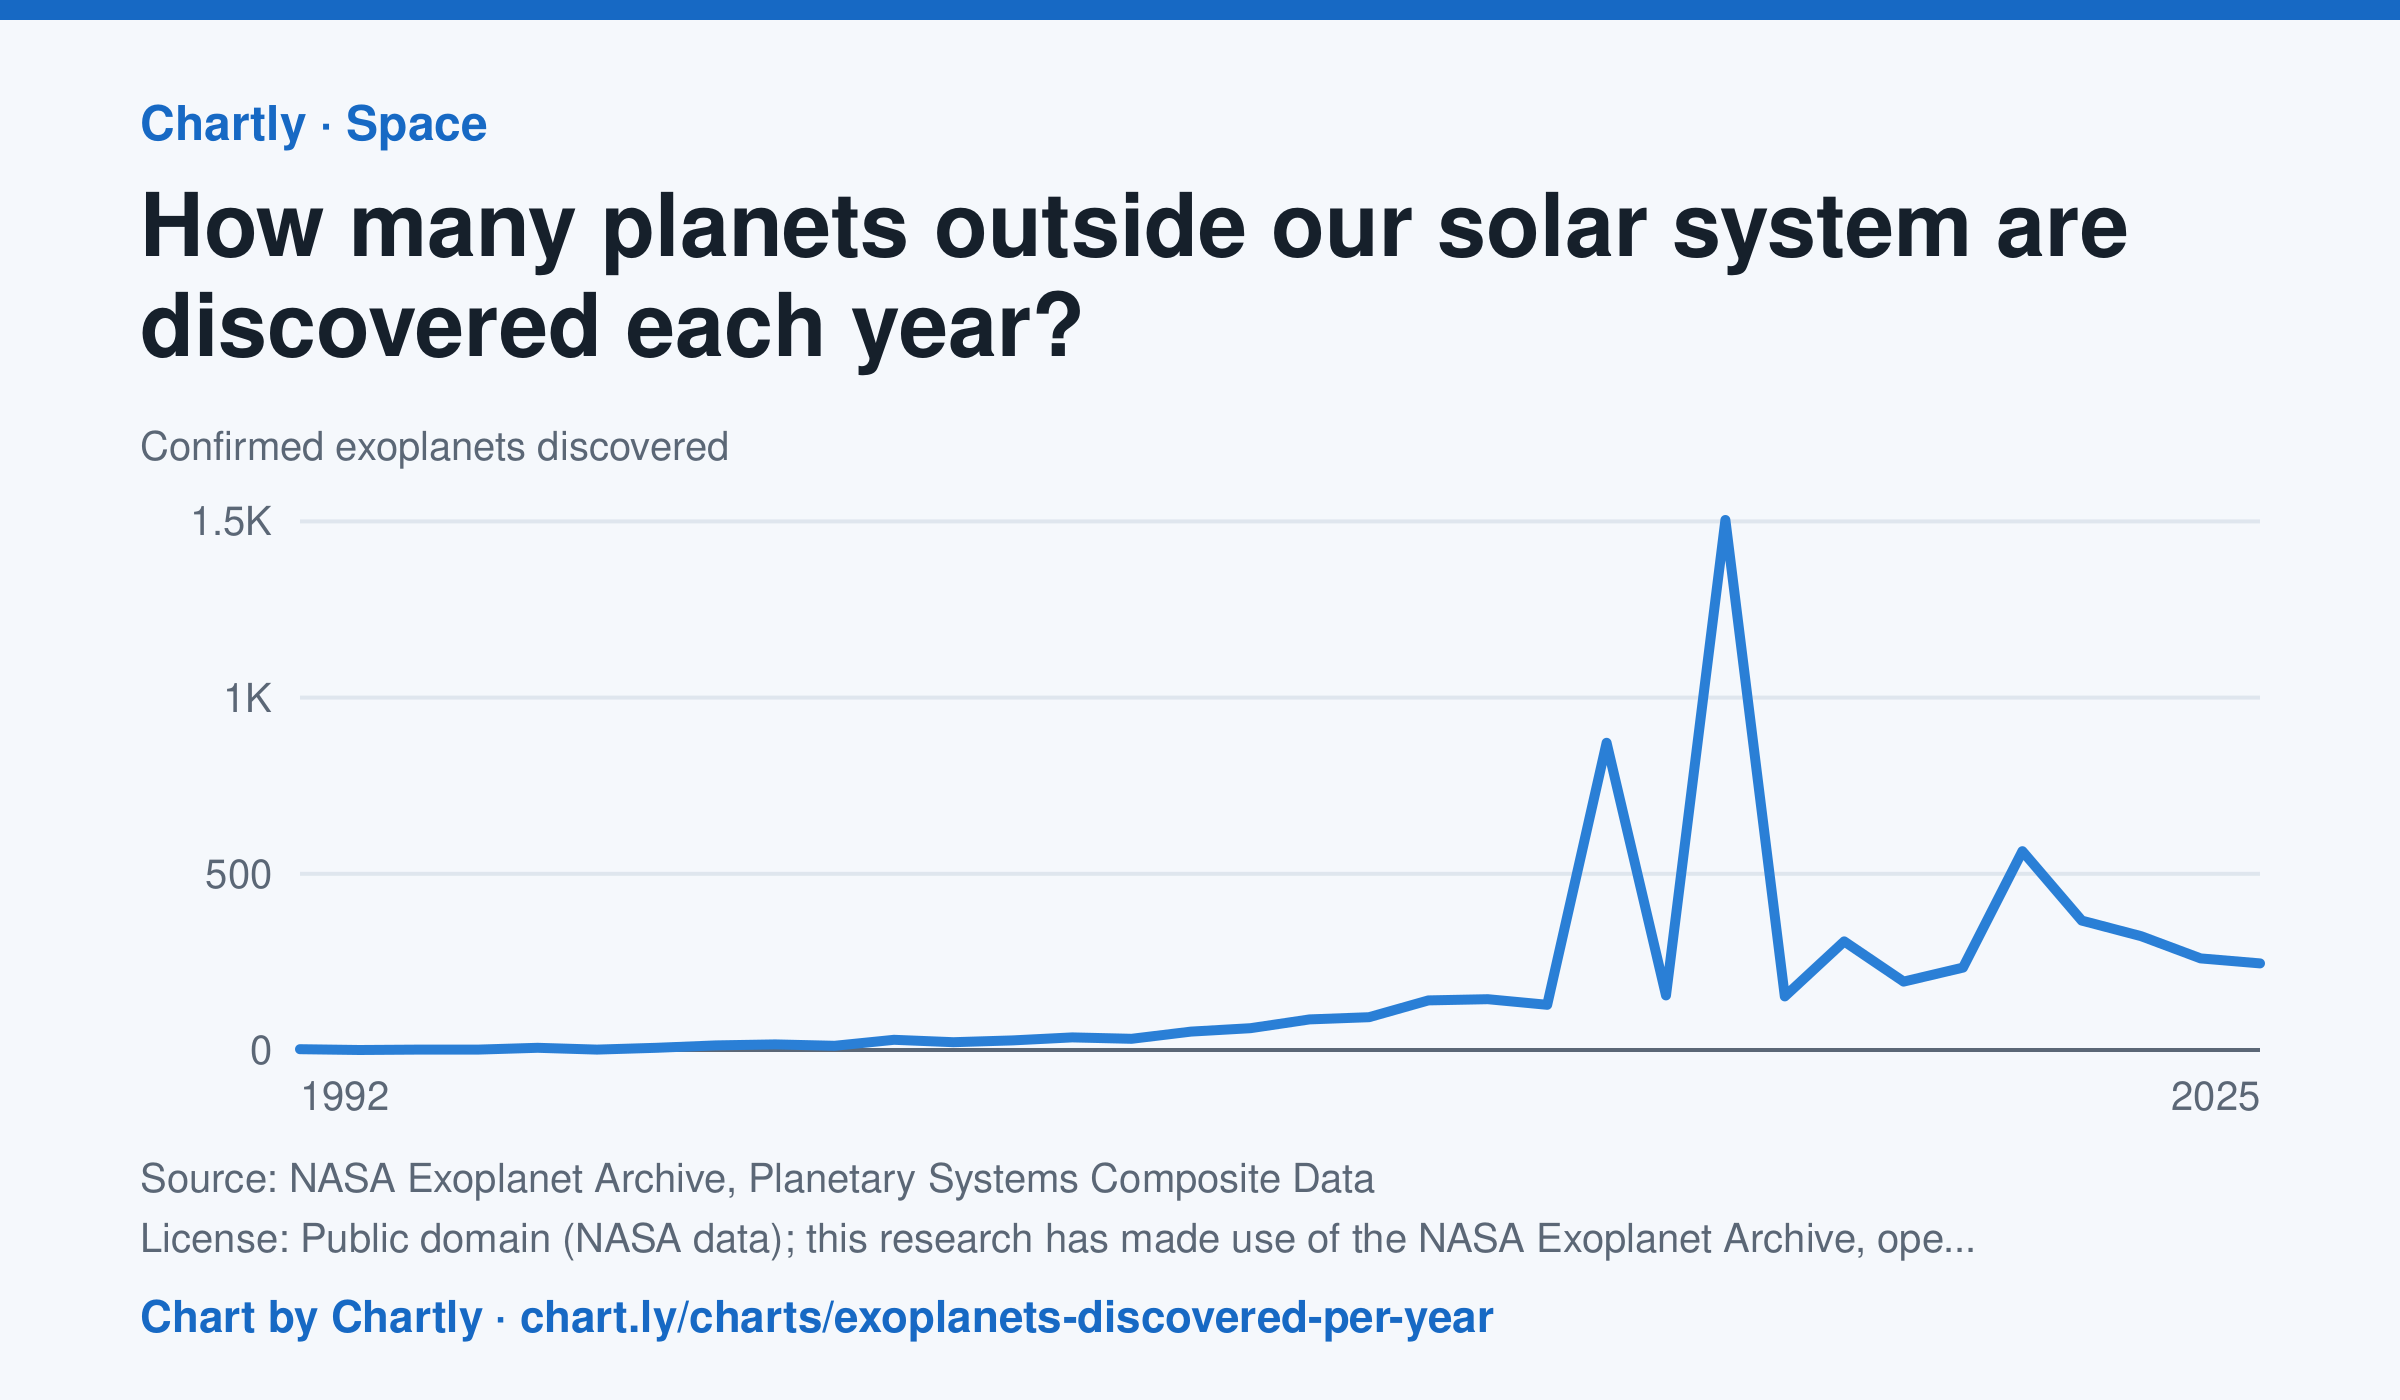
Astronomers confirmed 245 new planets around other stars in 2025. The first were found in 1992, and the count leaped in 2014 and 2016 (872 and 1,504), when NASA's Kepler team confirmed hundreds of its candidates at once. The archive counts a planet in the year its discovery was published and keeps adding late confirmations, so recent years can still rise.
Source: NASA Exoplanet Archive, Planetary Systems Composite Data (Public domain (NASA data); this research has made use of the NASA Exoplanet Archive, operated by Caltech under contract with NASA) · Data as of Dec 31, 2025
How to read this chart
Each point is how many planets around other stars, called exoplanets, astronomers confirmed in a year. The count depends on telescopes as much as on the sky: a new space telescope can confirm hundreds at once. The numbers come from NASA's Exoplanet Archive.
Questions
- Find the two biggest jumps on the chart. What could cause so many planets to be confirmed in one year?
- How many planets were confirmed in the first year on the chart, and how many in the newest year?
- Does a big year on this chart mean there were more planets in space that year? What does it really measure?
Chart and numbers: chart.ly/charts/exoplanets-discovered-per-year · More free charts at chart.ly