Print this worksheet, or choose "Save as PDF" in the print window to share a file.
Chart worksheet
Charts to read and discuss
Name:
Class:
Date:
Chart 1 of 3 · Baby names
How many babies were given your name each year since 1880?
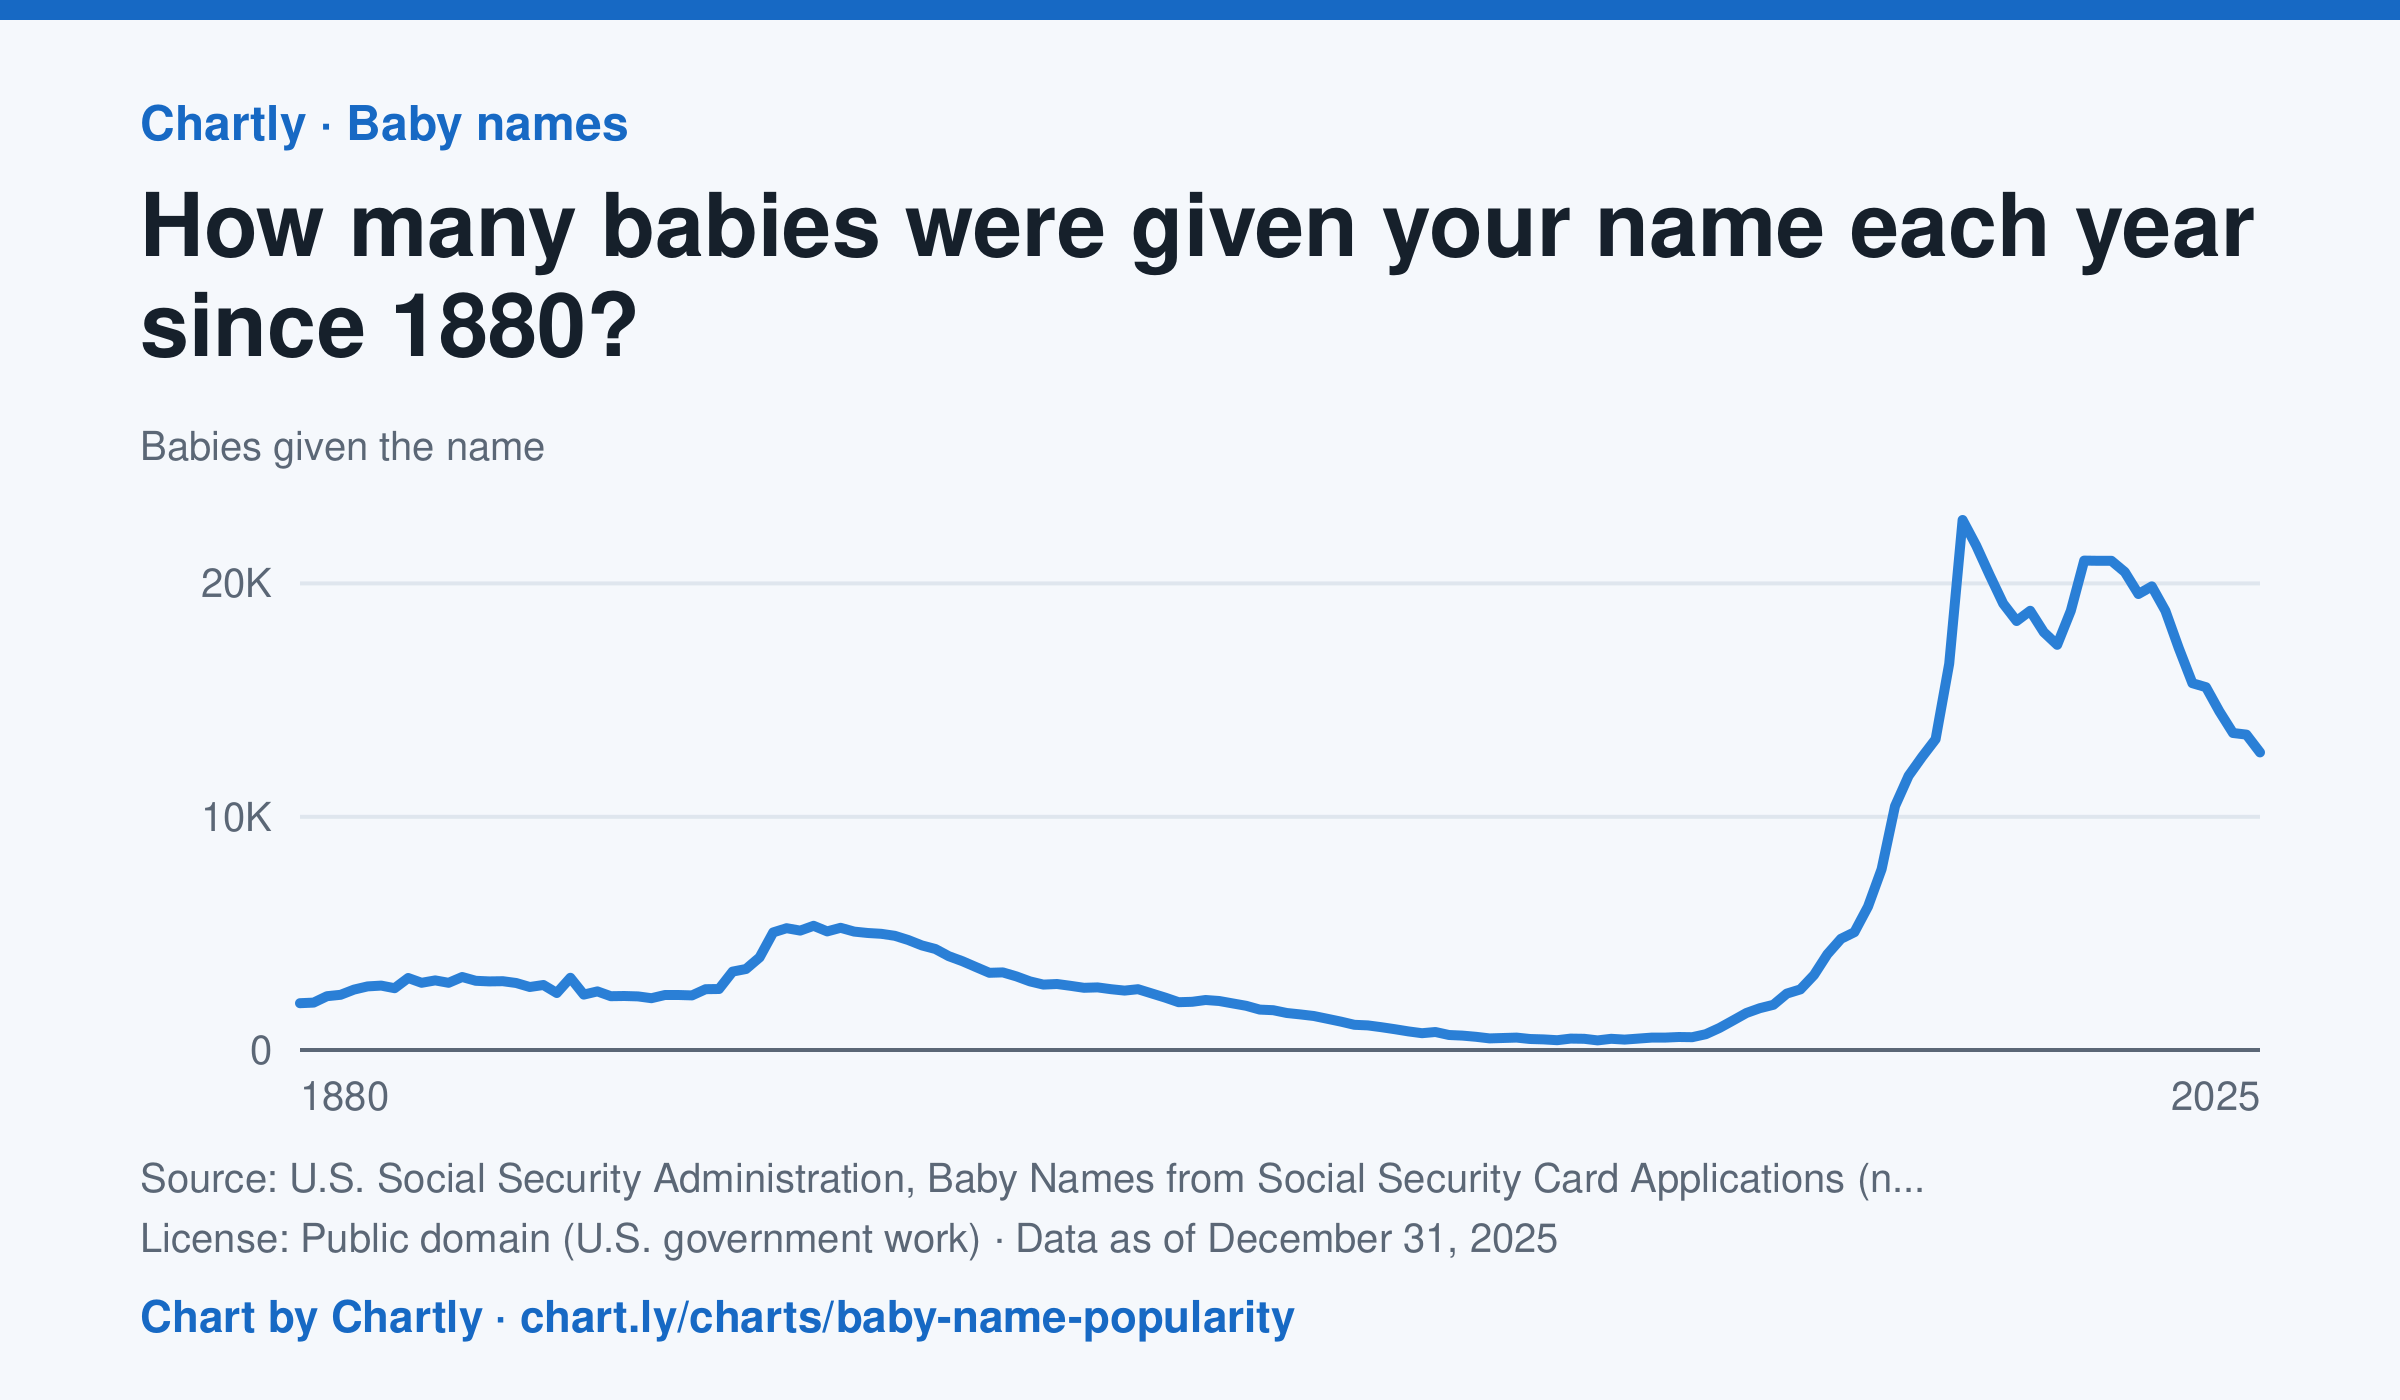
Type any name to see how many U.S. babies were given it each year since 1880, for girls or boys. Emma, shown first, went from 2,003 girls in 1880 down to 414 in 1976, then back up to a peak of 22,719 in 2003; in 2025 it was 12,754. The counts come from Social Security card applications, so the early years undercount everyone. A year with fewer than 5 babies of a name shows as 0, because Social Security leaves those names out for privacy.
Source: U.S. Social Security Administration, Baby Names from Social Security Card Applications (national data) (Public domain (U.S. government work)) · Data as of Dec 31, 2025
How to read this chart
Each point is the number of U.S. babies given a name in one year, from Social Security card applications. Type any name to see its line, for girls or boys. These are counts, not shares, and far more babies are born today than in 1880, so a count can grow just because the country did.
Questions
- Look up your own name or a friend's. When was it most popular, and what might explain that?
- Why are counts from the 1880s lower than counts today, even for names that were very popular then?
- How could you change these counts to fairly compare a name's popularity in 1900 with today?
Chart and numbers: chart.ly/charts/baby-name-popularity · More free charts at chart.ly
Chart 2 of 3 · Inflation
How much does a dozen eggs cost in the US?
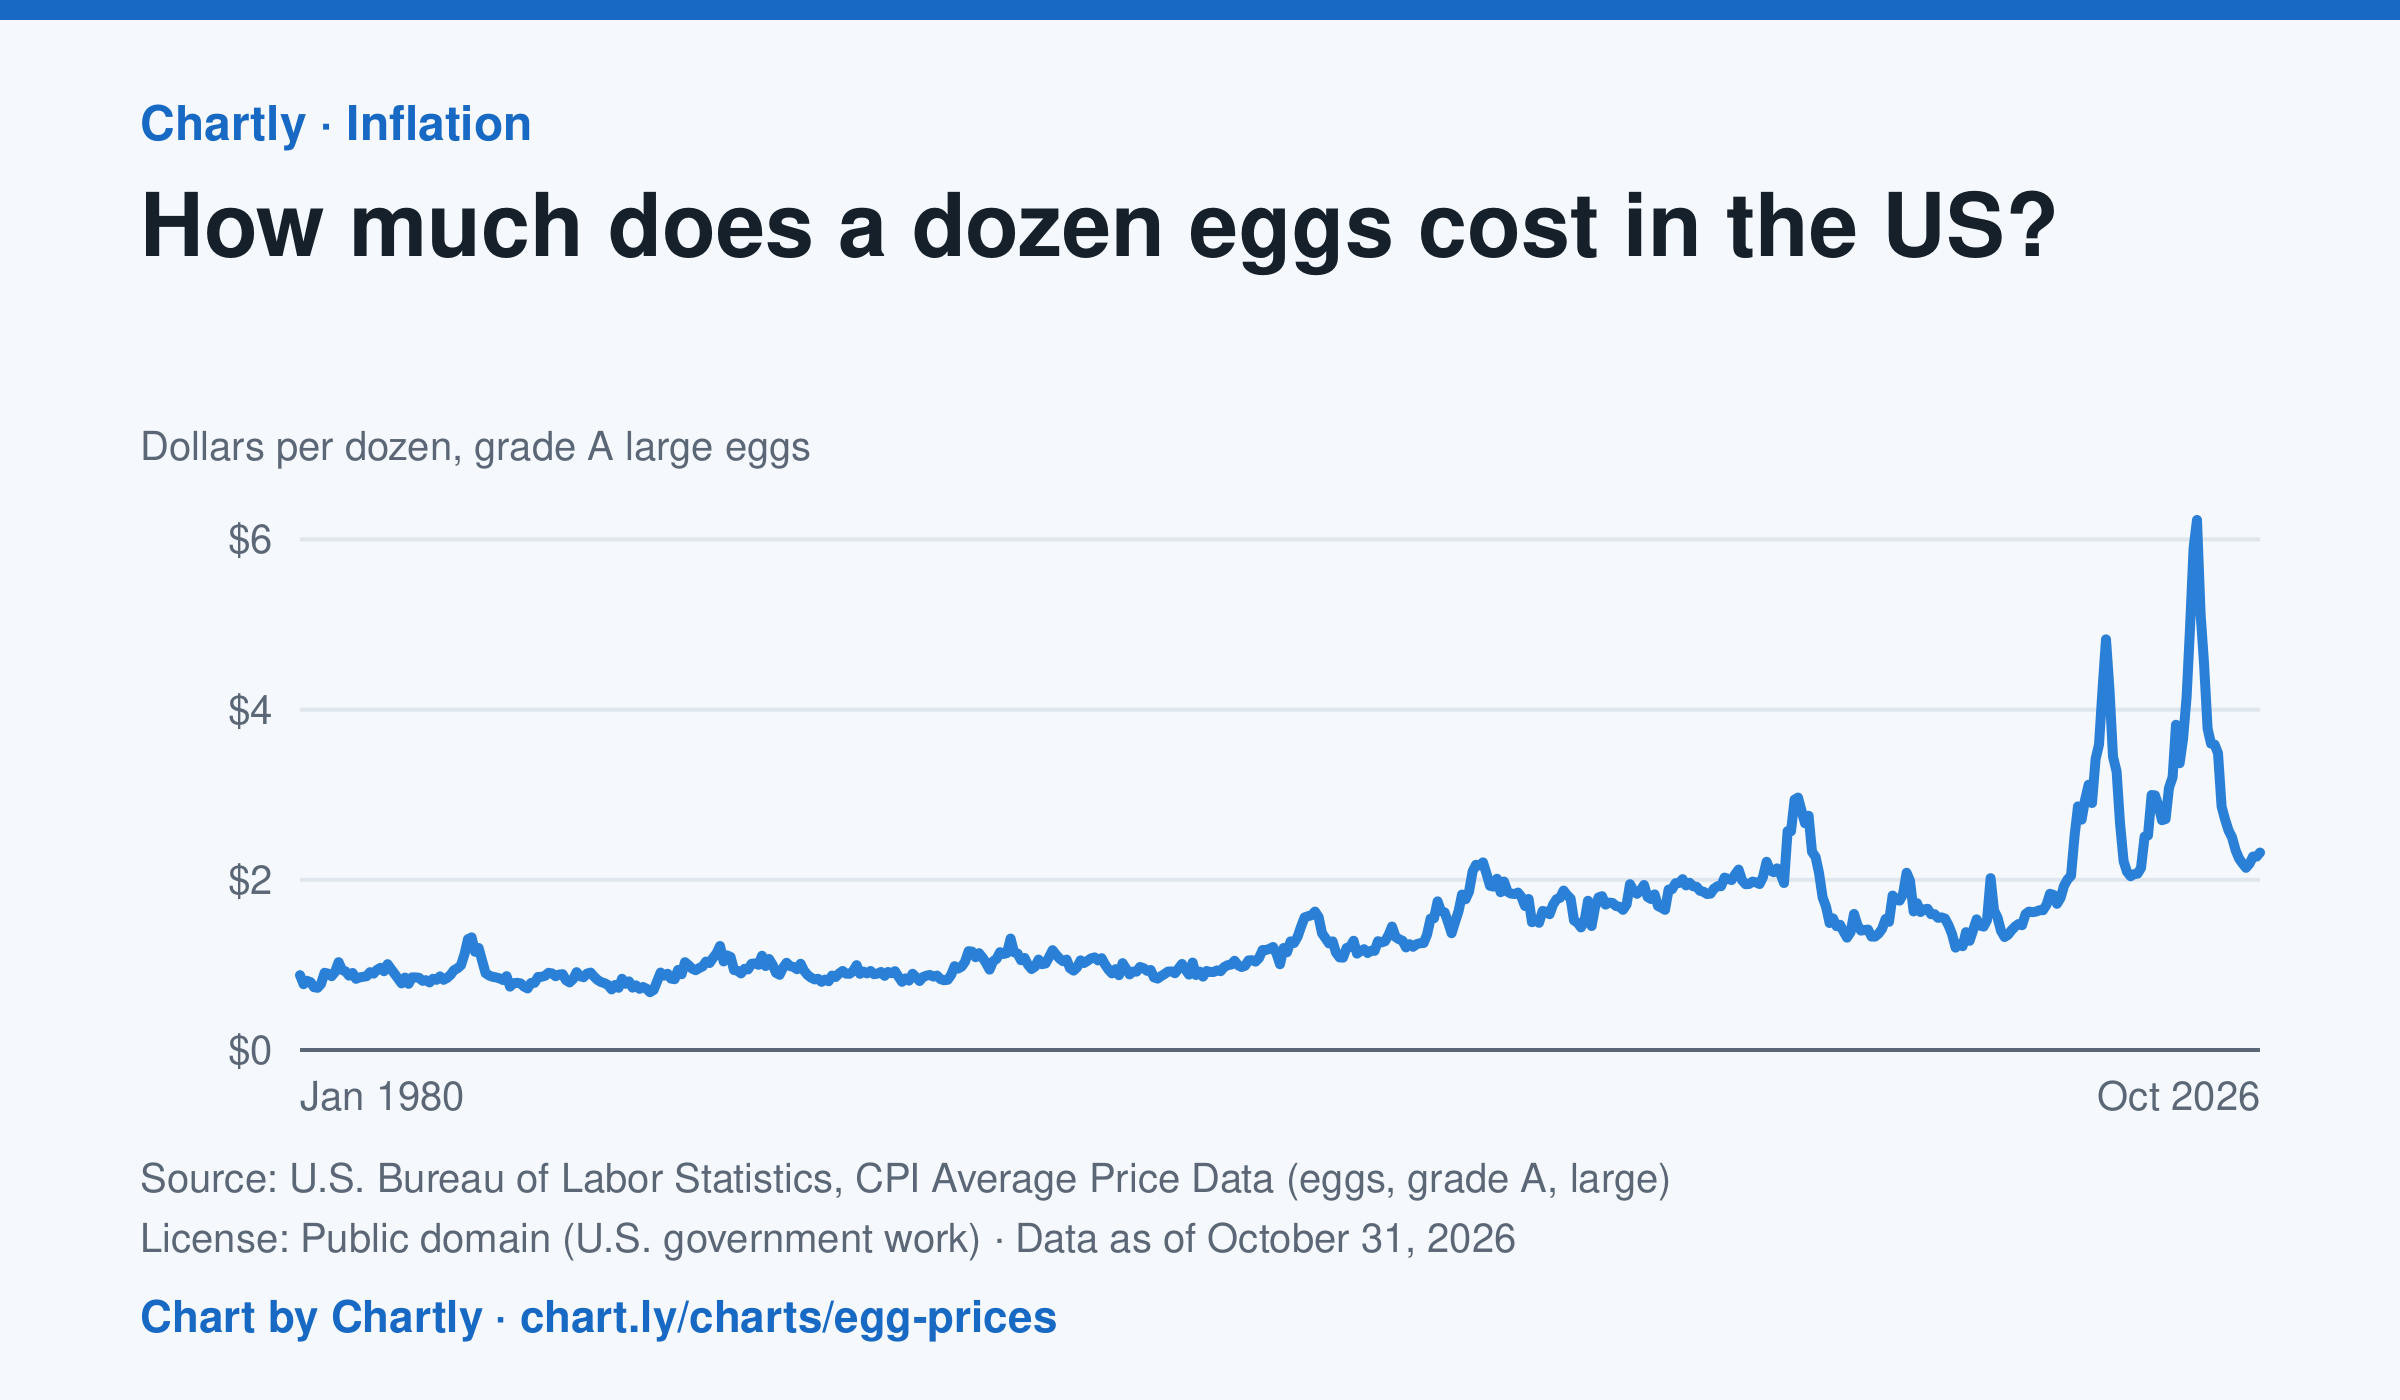
A dozen grade A large eggs averaged $2.32 in October 2026. The record so far is $6.23 in March 2025; prices spiked in 2023 and 2025 when bird flu cut the number of laying hens. Prices are BLS averages across US cities since 1980, when this series begins, in dollars of the day, not adjusted for inflation. October 2025 is missing because a lapse in federal funding stopped data collection.
Source: U.S. Bureau of Labor Statistics, CPI Average Price Data (eggs, grade A, large) (Public domain (U.S. government work)) · Data as of Oct 31, 2026
How to read this chart
Each point is the average price of a dozen grade A large eggs in U.S. cities in one month, in dollars. The axis starts at zero, so the height of the line shows the true price. Spikes often come when bird flu forces farms to lose laying hens, which cuts the supply of eggs.
Questions
- What was the highest price on the chart, and how many times more is it than the lowest?
- Showing your work, by what percent did the price change from the first month on the chart to the newest?
- When fewer hens are laying eggs but people want just as many, what happens to the price, and why?
Chart and numbers: chart.ly/charts/egg-prices · More free charts at chart.ly
Chart 3 of 3 · Crime
Is violent crime in the U.S. going up or down?
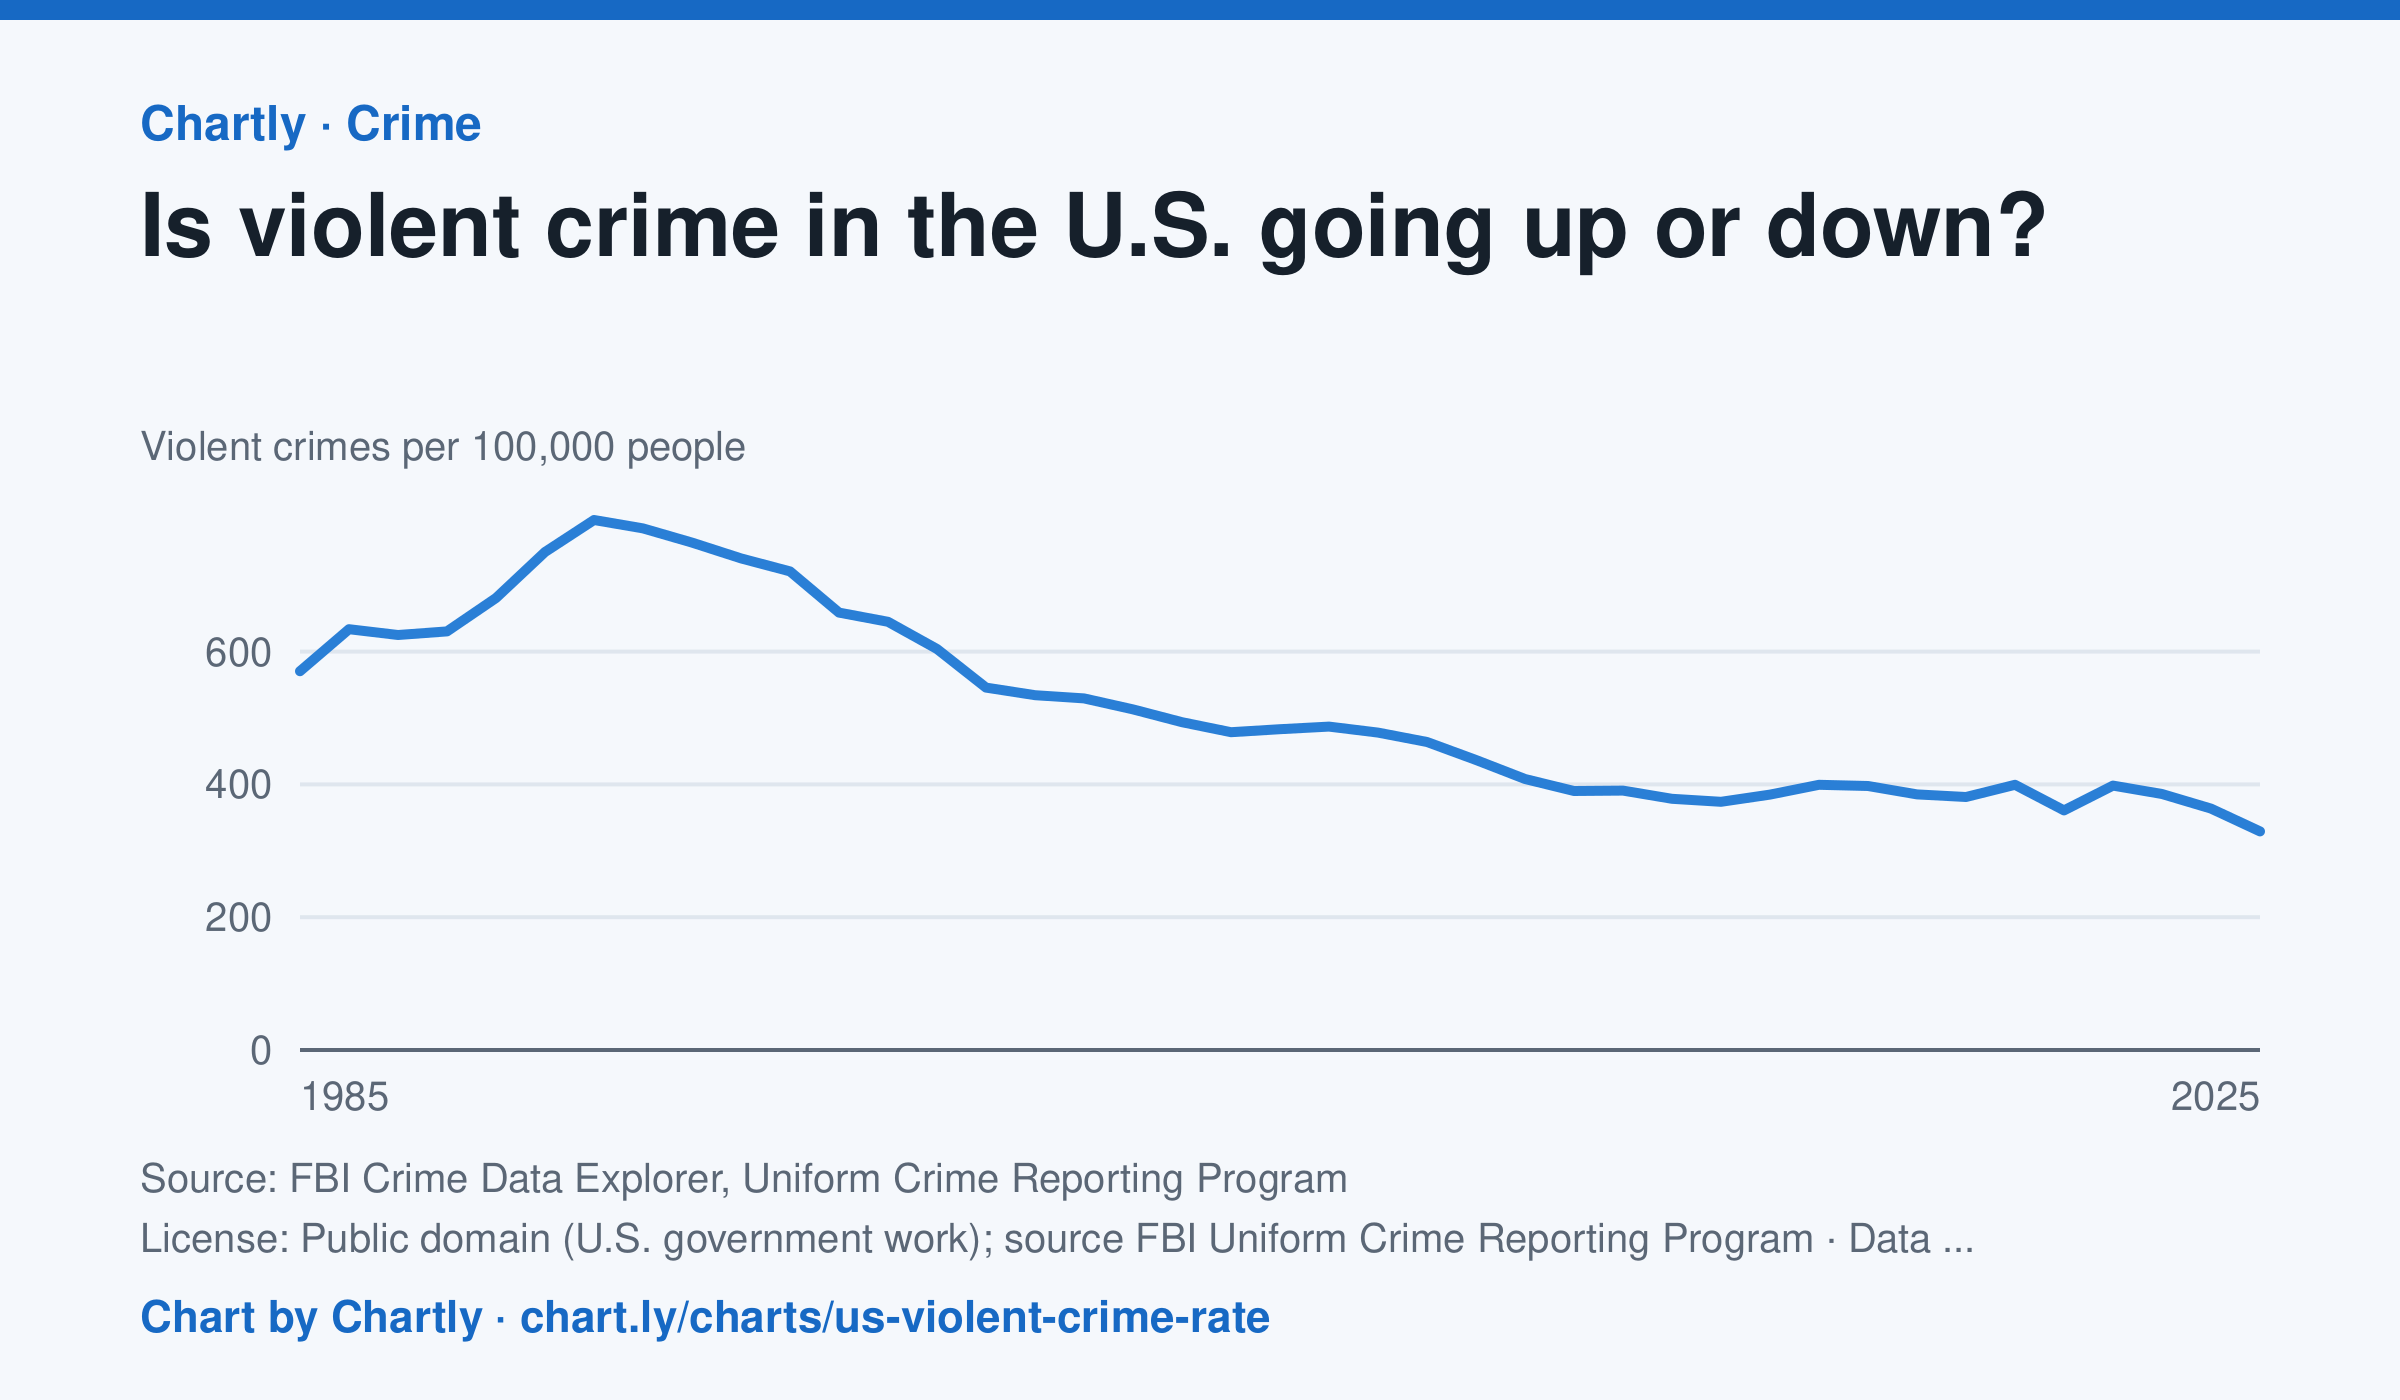
Down, over the long run. Police reported about 329 violent crimes per 100,000 people in 2025, about 59% below the 1991 peak of about 798, and the lowest since at least 1985. The rate rose in 2020 and 2022, then fell in 2023, 2024 and 2025. In 2021 the FBI stopped taking its old summary reports and accepted only its newer, more detailed system (NIBRS); many police departments hadn't switched yet, so agencies covering only about 77% of Americans reported, against 88 to 98% in other years, and 2021's number is less certain. Rates count only the agencies that reported, so they differ a little from the FBI's national estimates, and the FBI widened its definition of rape in 2013.
Source: FBI Crime Data Explorer, Uniform Crime Reporting Program (Public domain (U.S. government work); source FBI Uniform Crime Reporting Program) · Data as of Dec 31, 2025
How to read this chart
Each point is the number of violent crimes police reported for every 100,000 Americans that year. The line starts at zero, so its height shows the true size. In 2021 the FBI changed how it collects reports and fewer police departments sent numbers, so that year is less certain than the others.
Questions
- Find the year with the highest rate. About how much lower is the rate in the latest year?
- Many people say they think crime is rising. How could that belief and this chart both seem true to different people?
- Why might a change in how crimes are counted, like the one in 2021, make one year hard to compare with the rest?
Chart and numbers: chart.ly/charts/us-violent-crime-rate · More free charts at chart.ly