Print this worksheet, or choose "Save as PDF" in the print window to share a file.
Chart worksheet
Charts to read and discuss
Name:
Class:
Date:
Chart 1 of 3 · Baby names
How many babies were given your name each year since 1880?
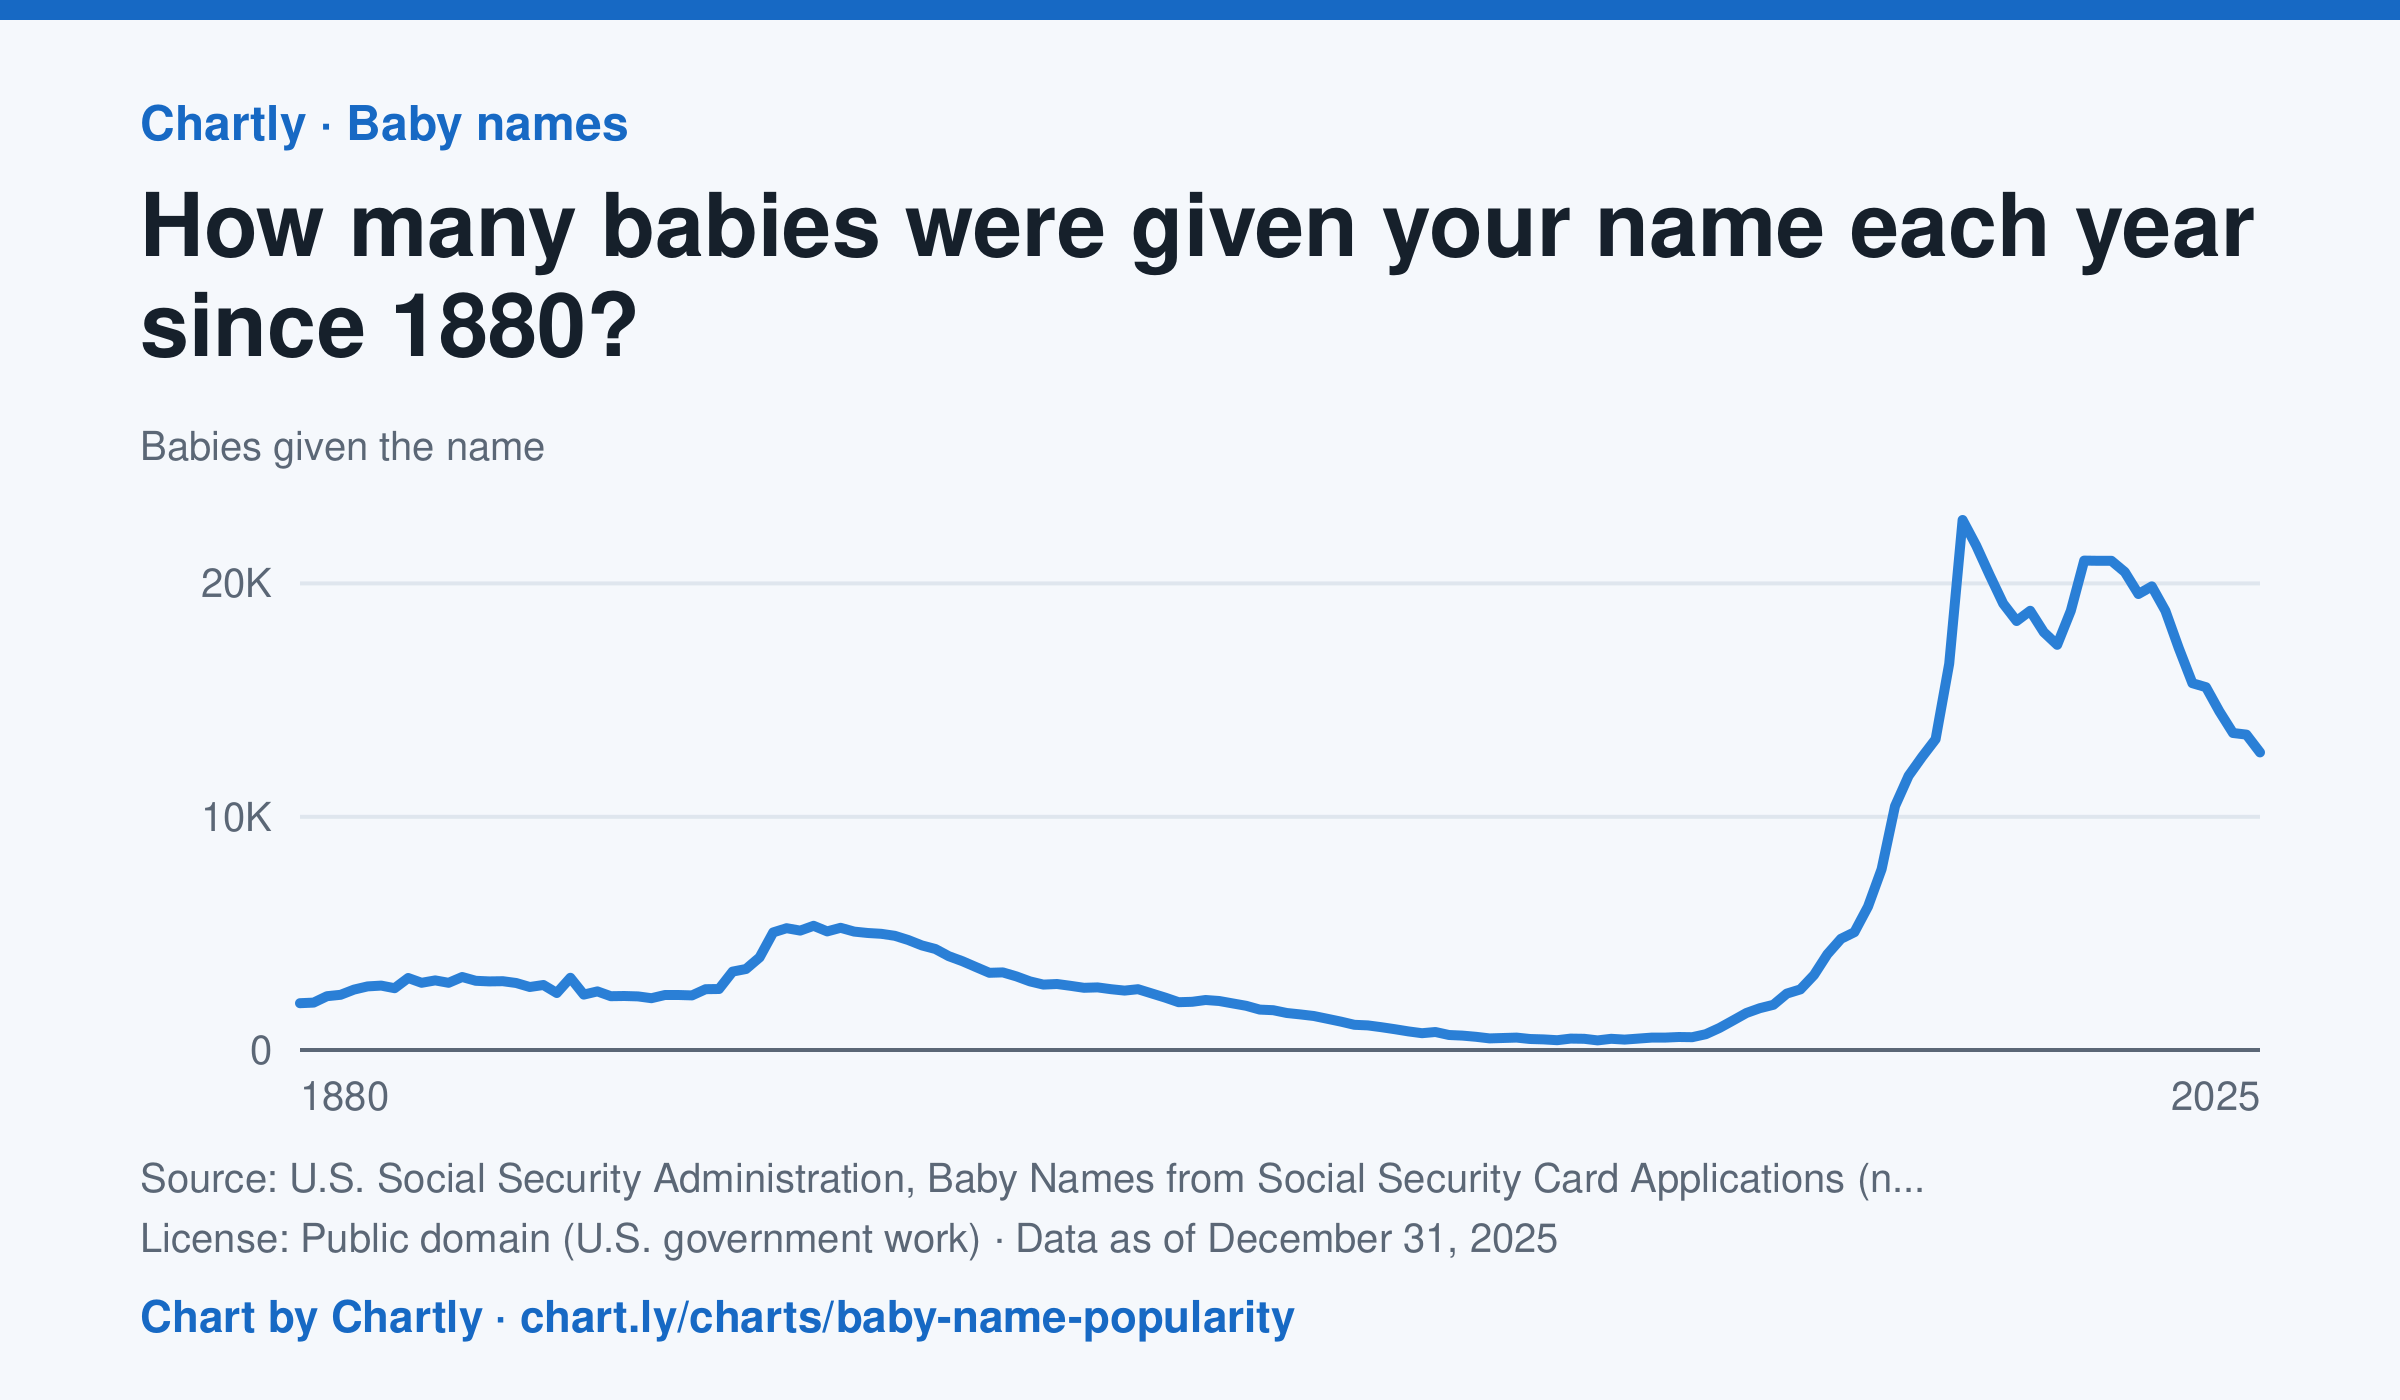
Type any name to see how many U.S. babies were given it each year since 1880, for girls or boys. Emma, shown first, went from 2,003 girls in 1880 down to 414 in 1976, then back up to a peak of 22,719 in 2003; in 2025 it was 12,754. The counts come from Social Security card applications, so the early years undercount everyone. A year with fewer than 5 babies of a name shows as 0, because Social Security leaves those names out for privacy.
Source: U.S. Social Security Administration, Baby Names from Social Security Card Applications (national data) (Public domain (U.S. government work)) · Data as of Dec 31, 2025
How to read this chart
Each point is the number of U.S. babies given a name in one year, from Social Security card applications. Type any name to see its line, for girls or boys. These are counts, not shares, and far more babies are born today than in 1880, so a count can grow just because the country did.
Questions
- Look up your own name or a friend's. When was it most popular, and what might explain that?
- Why are counts from the 1880s lower than counts today, even for names that were very popular then?
- How could you change these counts to fairly compare a name's popularity in 1900 with today?
Chart and numbers: chart.ly/charts/baby-name-popularity · More free charts at chart.ly
Chart 2 of 3 · Inflation
How much does a dozen eggs cost in the US?
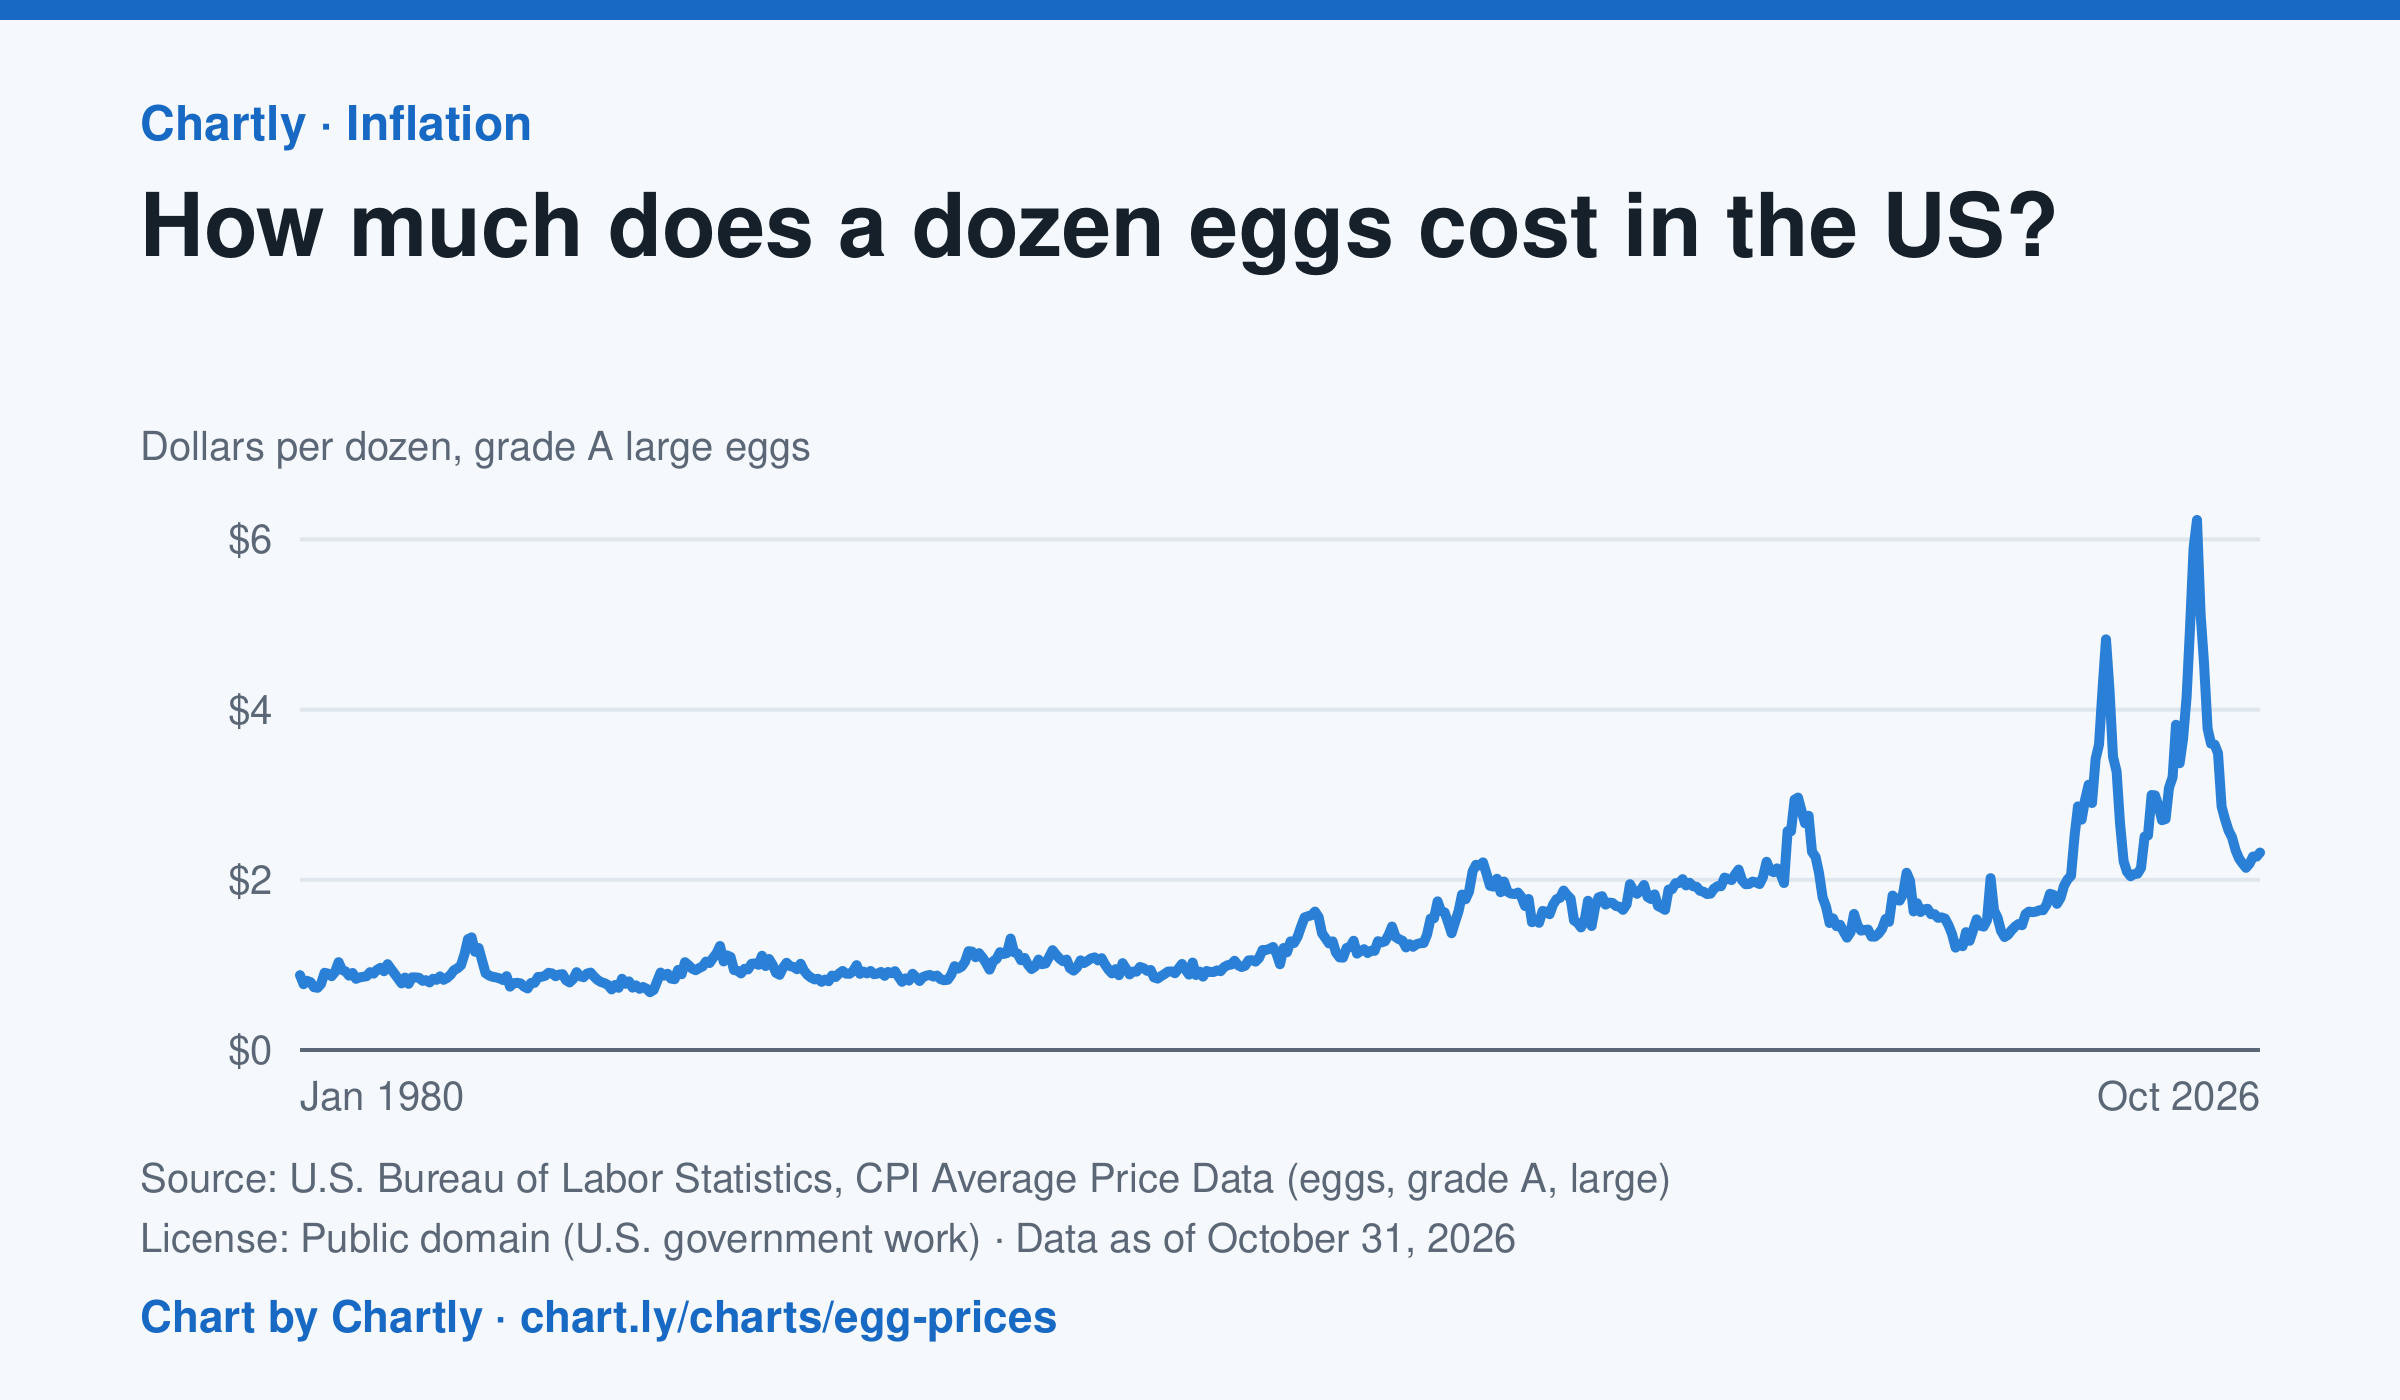
A dozen grade A large eggs averaged $2.32 in October 2026. The record so far is $6.23 in March 2025; prices spiked in 2023 and 2025 when bird flu cut the number of laying hens. Prices are BLS averages across US cities since 1980, when this series begins, in dollars of the day, not adjusted for inflation. October 2025 is missing because a lapse in federal funding stopped data collection.
Source: U.S. Bureau of Labor Statistics, CPI Average Price Data (eggs, grade A, large) (Public domain (U.S. government work)) · Data as of Oct 31, 2026
How to read this chart
Each point is the average price of a dozen grade A large eggs in U.S. cities in one month, in dollars. The axis starts at zero, so the height of the line shows the true price. Spikes often come when bird flu forces farms to lose laying hens, which cuts the supply of eggs.
Questions
- What was the highest price on the chart, and how many times more is it than the lowest?
- Showing your work, by what percent did the price change from the first month on the chart to the newest?
- When fewer hens are laying eggs but people want just as many, what happens to the price, and why?
Chart and numbers: chart.ly/charts/egg-prices · More free charts at chart.ly
Chart 3 of 3 · Housing
How much is rent in each state?
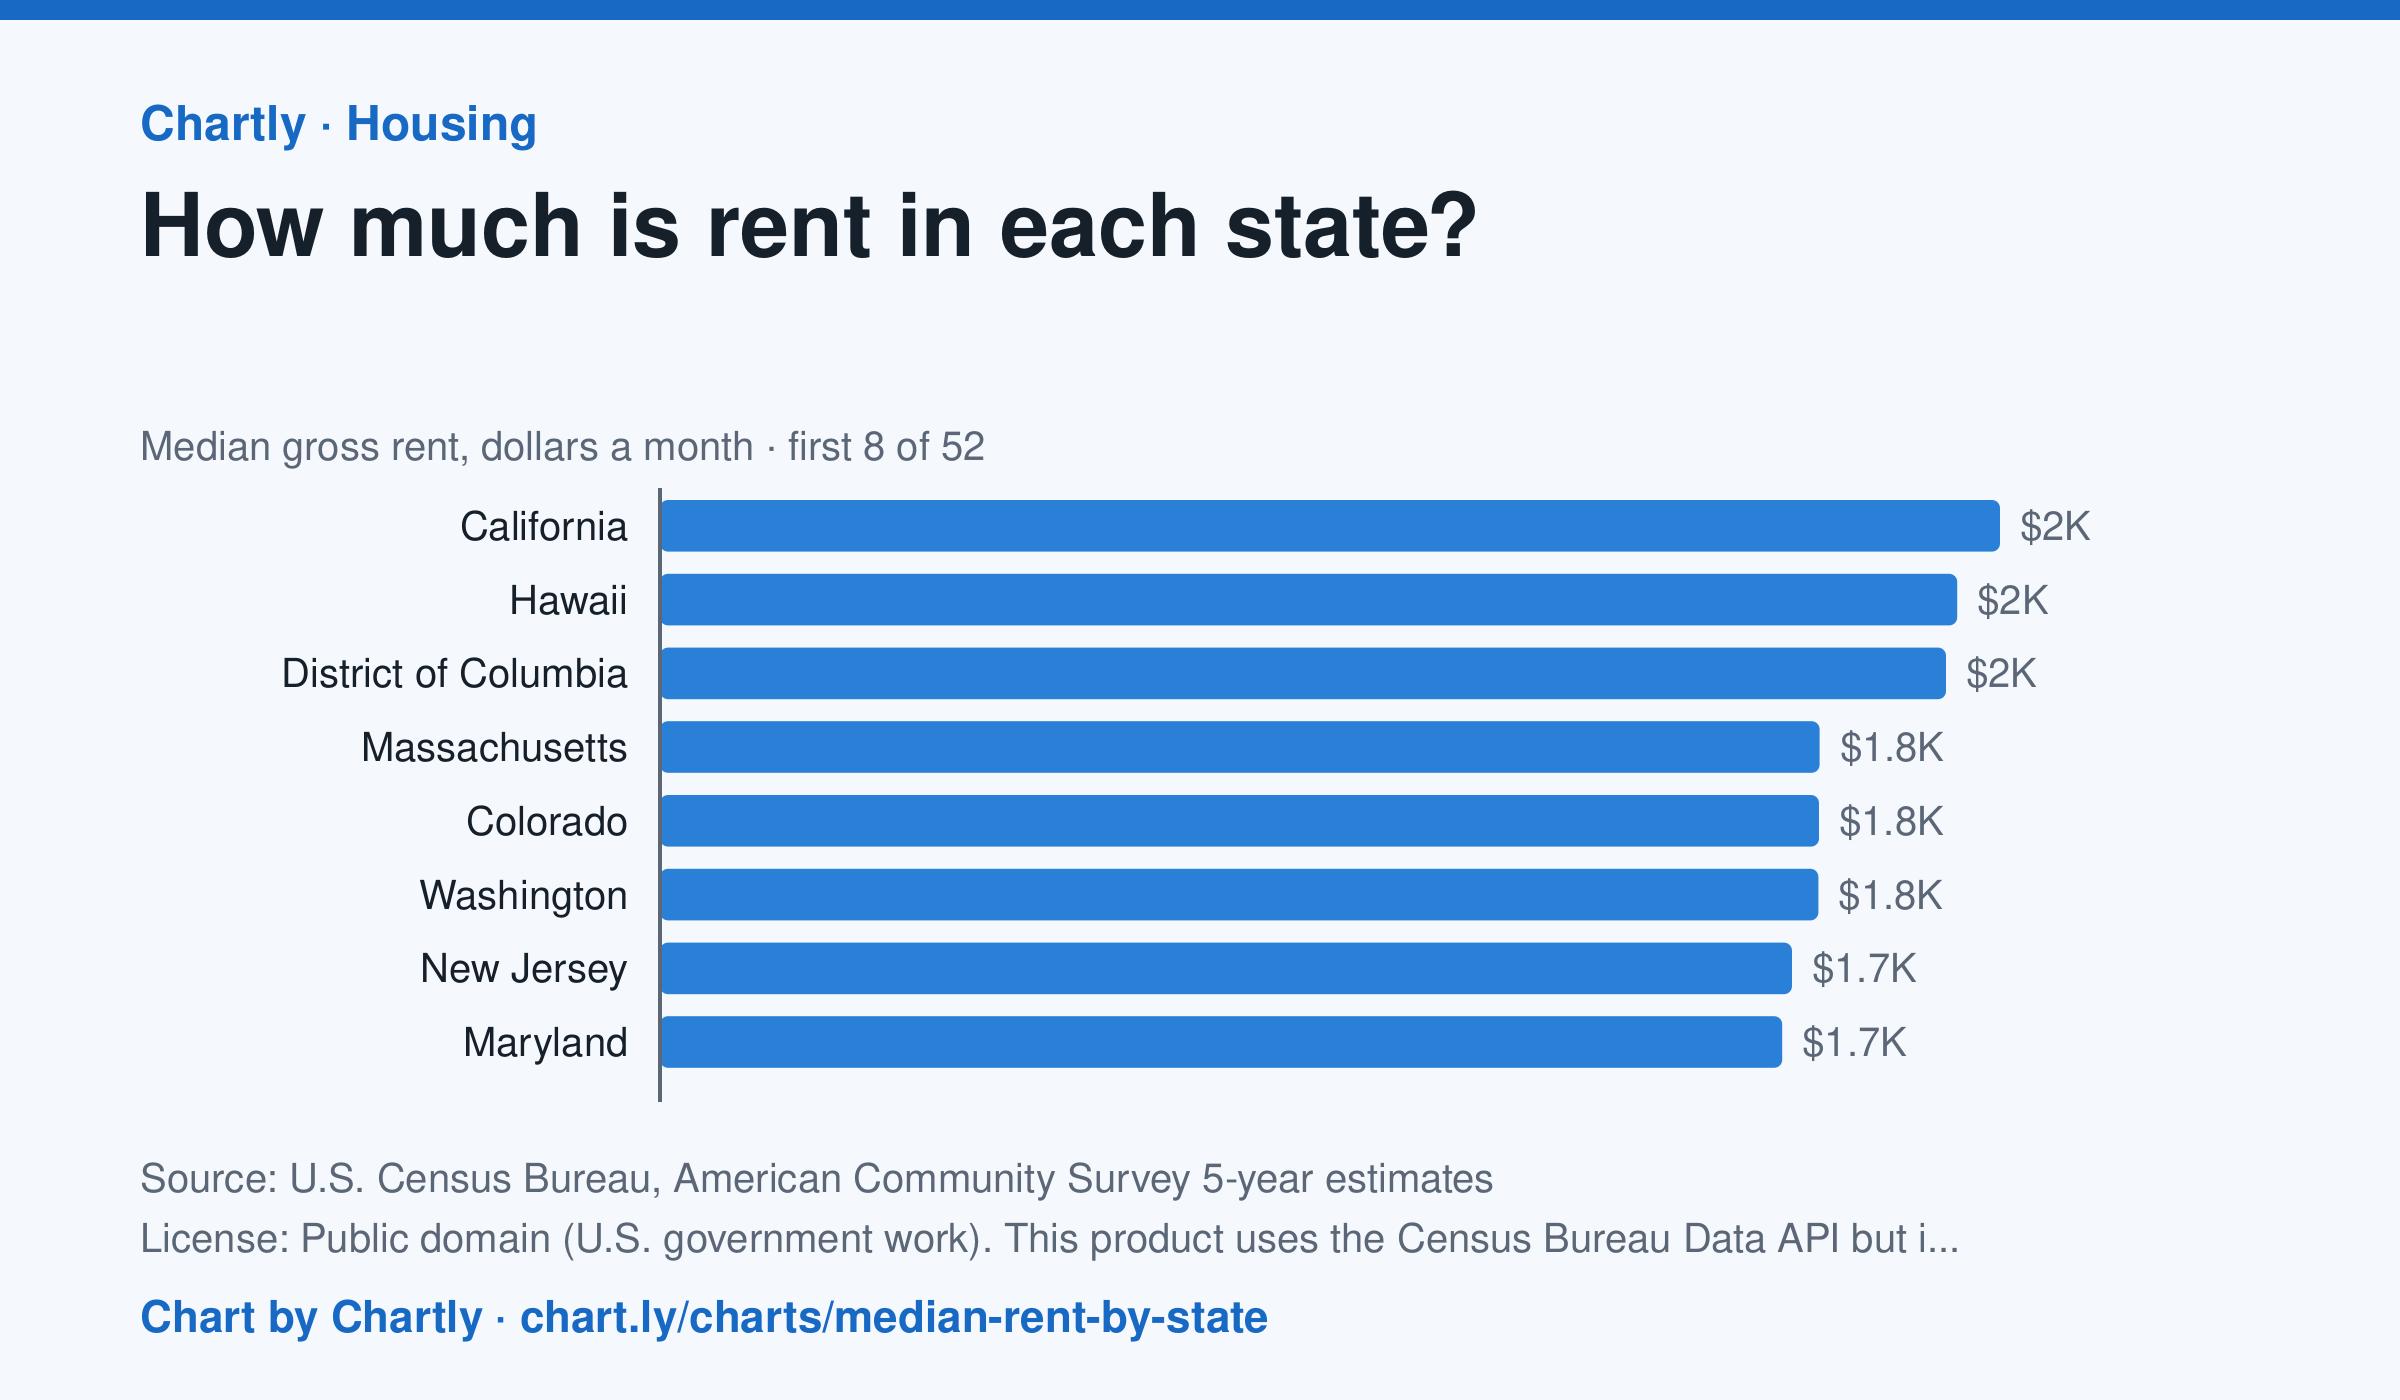
In the Census Bureau's 5-year survey ending in 2024, median rent including utilities was highest in California, $2,036 a month, followed by Hawaii ($1,971) and District of Columbia ($1,954). West Virginia was lowest at $872, and the U.S. median was $1,413. Averaged over five years, these figures trail the latest rent increases.
Source: U.S. Census Bureau, American Community Survey 5-year estimates (Public domain (U.S. government work). This product uses the Census Bureau Data API but is not endorsed or certified by the Census Bureau.) · Data as of Dec 31, 2024
How to read this chart
Each bar is the median monthly rent, including utilities, in a state: half of renters pay more and half pay less. The figures come from a Census survey of a sample of homes, so each has a margin of error, shown as a thin line and a ± figure. The dashed line is the whole U.S.
Questions
- Which state has the highest median rent and which the lowest? How many times more is the highest?
- Why is a median a better way to describe typical rent than an average, when a few apartments cost a huge amount?
- Two states' rents are only a few dollars apart and their margins of error overlap. Can you say which one is really higher?
Chart and numbers: chart.ly/charts/median-rent-by-state · More free charts at chart.ly