Print this worksheet, or choose "Save as PDF" in the print window to share a file.
Chart worksheet
Charts to read and discuss
Name:
Class:
Date:
Chart 1 of 2 · Jobs and wages
How much do US workers earn an hour?
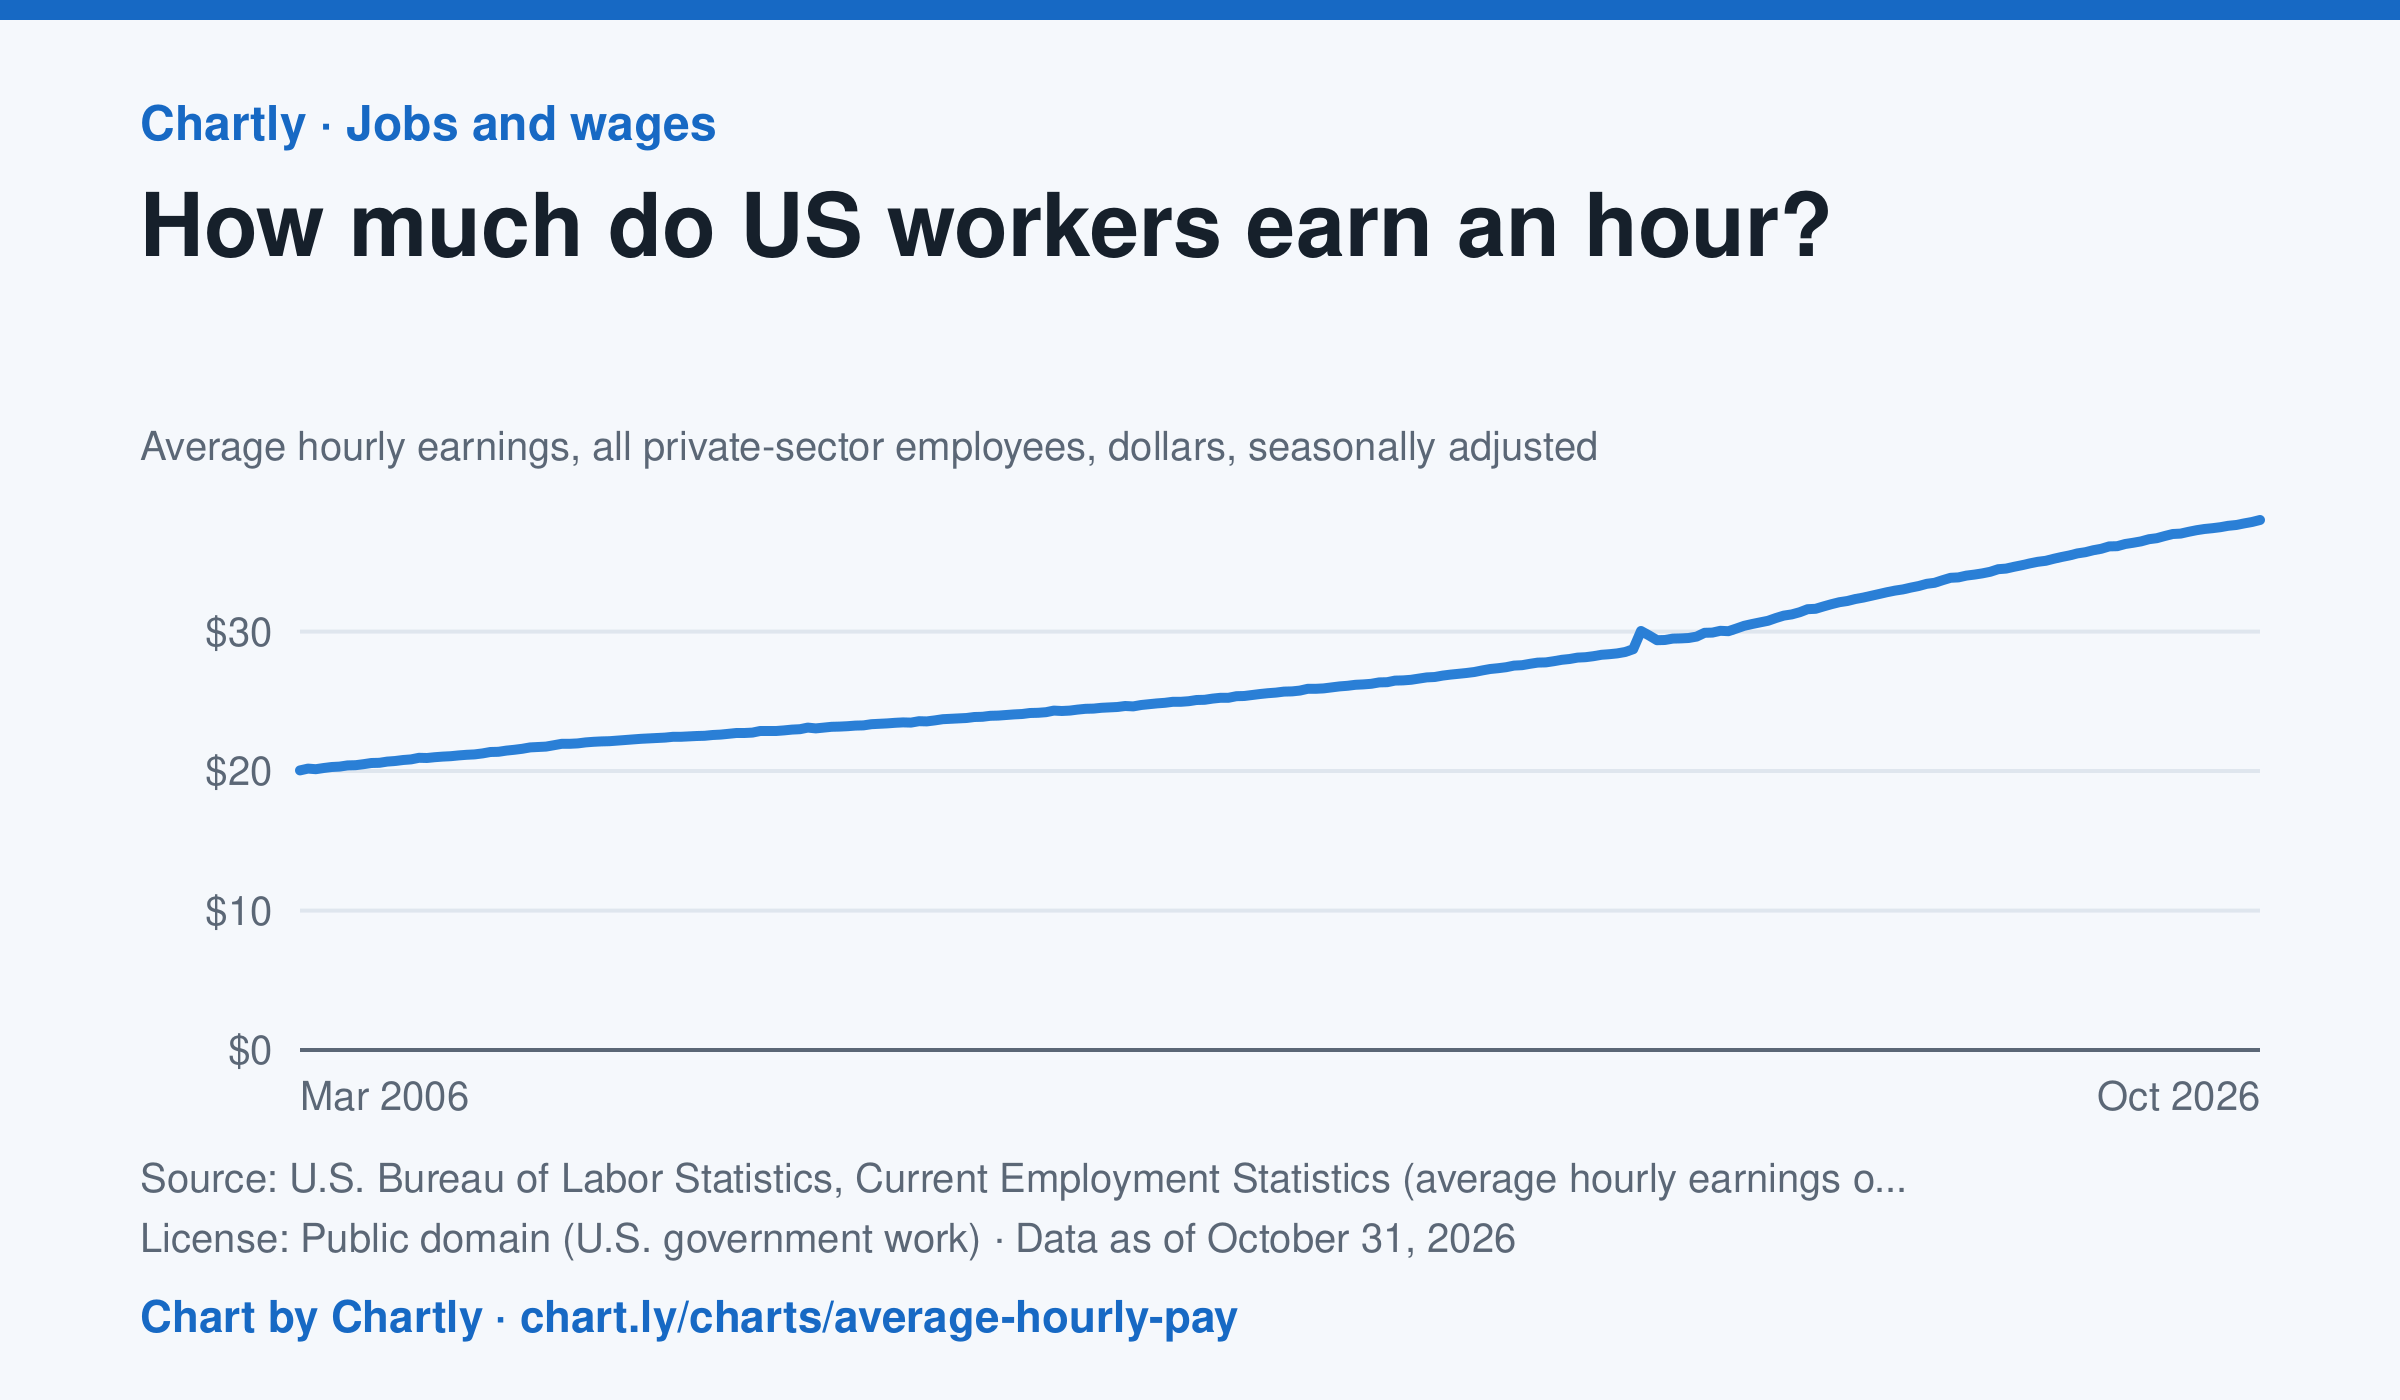
Private-sector employees earned an average of $38.00 an hour in October 2026, 3.1% more than in October 2025 and 1.9 times the $20.04 of March 2006, when the series begins. That is in dollars of the day, not adjusted for inflation; the monthly jobs report compares it with prices. The average rose sharply in spring 2020 because the pandemic put mostly lower-paid people out of work, not because pay jumped.
Source: U.S. Bureau of Labor Statistics, Current Employment Statistics (average hourly earnings of all employees, total private) (Public domain (U.S. government work)) · Data as of Oct 31, 2026
How to read this chart
Each point is the average hourly pay of private-sector employees in one month, in dollars, before taxes. It is not adjusted for inflation, so a rise in pay doesn't always mean workers can buy more. Hover or tap a point to read its month and value.
Questions
- How much did average hourly pay change from the first month on the chart to the newest?
- Find a month when pay jumped more than usual. Can you think of a reason that might happen, other than everyone getting a raise?
- If prices rose faster than pay over a year, were workers better or worse off? How could you check that with another chart?
Chart and numbers: chart.ly/charts/average-hourly-pay · More free charts at chart.ly
Chart 2 of 2 · Energy
How much of US electricity comes from wind and solar?
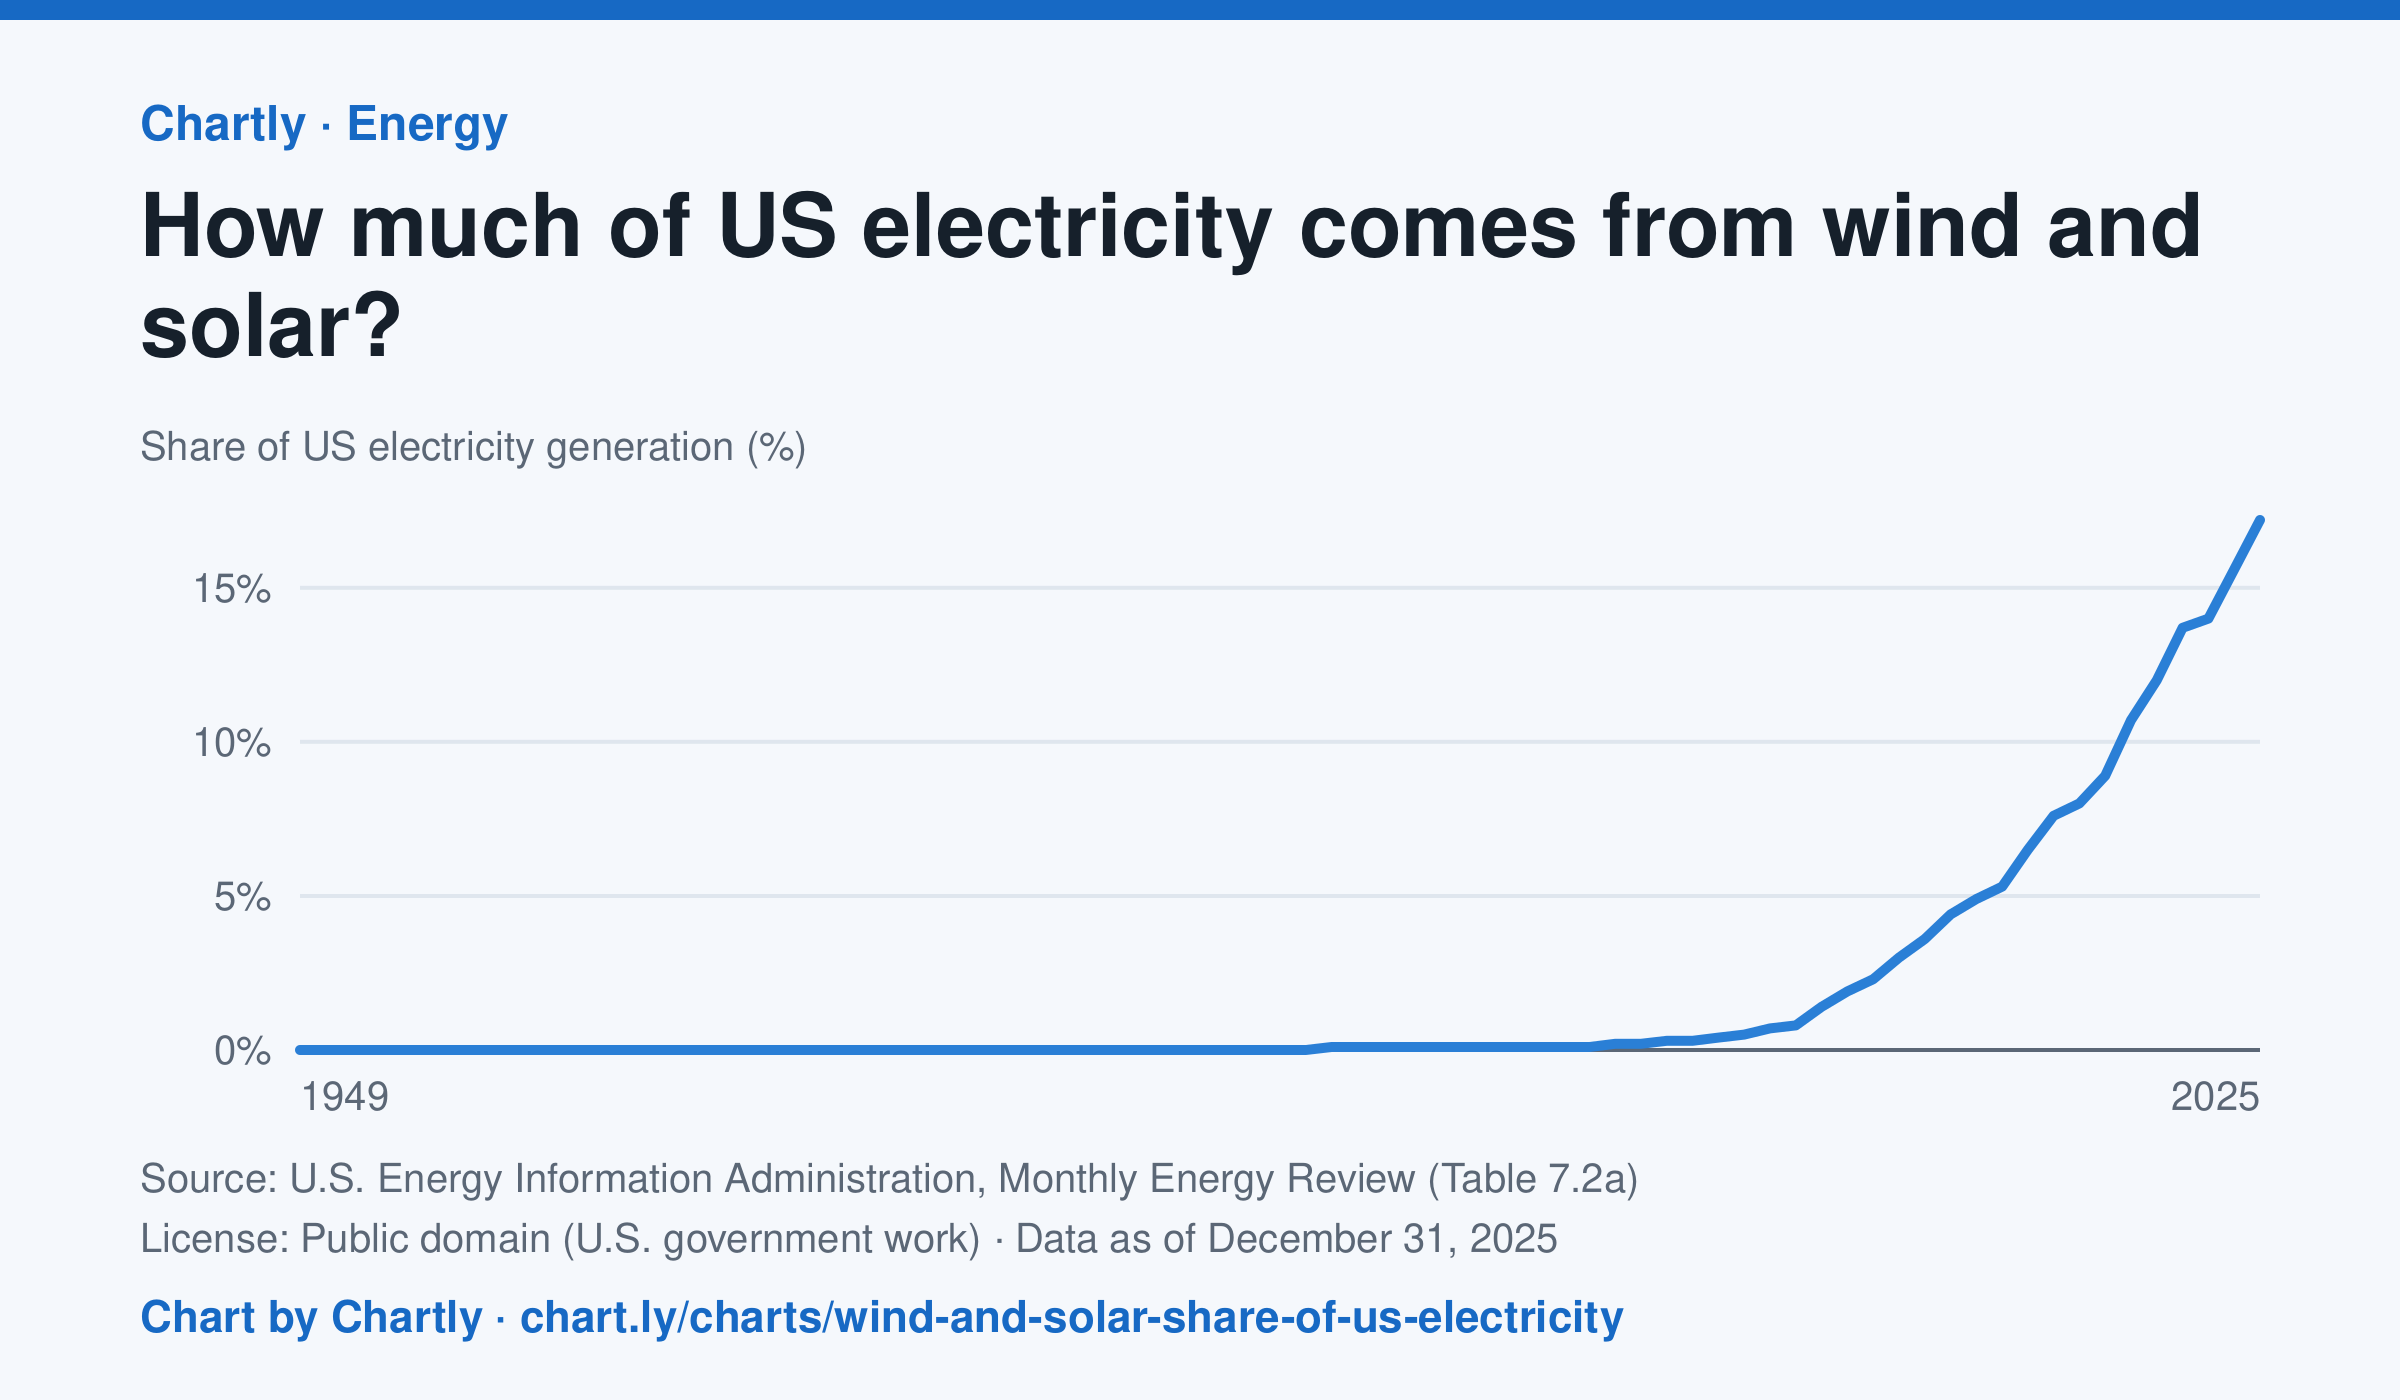
Wind and solar made 17.2% of US electricity in 2025, up from 2.3% in 2010 and under 1% through 2007. Solar counts only utility-scale plants, not rooftop panels, and the 2025 figures are preliminary.
Source: U.S. Energy Information Administration, Monthly Energy Review (Table 7.2a) (Public domain (U.S. government work)) · Data as of Dec 31, 2025
How to read this chart
Each point is the share of all U.S. electricity made by wind turbines and solar power plants in a year, in percent. Solar counts only large power plants, not rooftop panels, so the true share is a little higher. The newest year's figure is preliminary.
Questions
- In about what year did wind and solar first pass 5% of U.S. electricity? What is the share in the newest year?
- Is the line getting steeper or flatter in recent years? What does that tell you about how fast wind and solar are growing?
- Wind and solar make power only when the wind blows or the sun shines. What else does a power grid need because of that?
Chart and numbers: chart.ly/charts/wind-and-solar-share-of-us-electricity · More free charts at chart.ly