Print this worksheet, or choose "Save as PDF" in the print window to share a file.
Chart worksheet
Charts to read and discuss
Name:
Class:
Date:
Chart 1 of 3 · Jobs and wages
How much do US workers earn an hour?
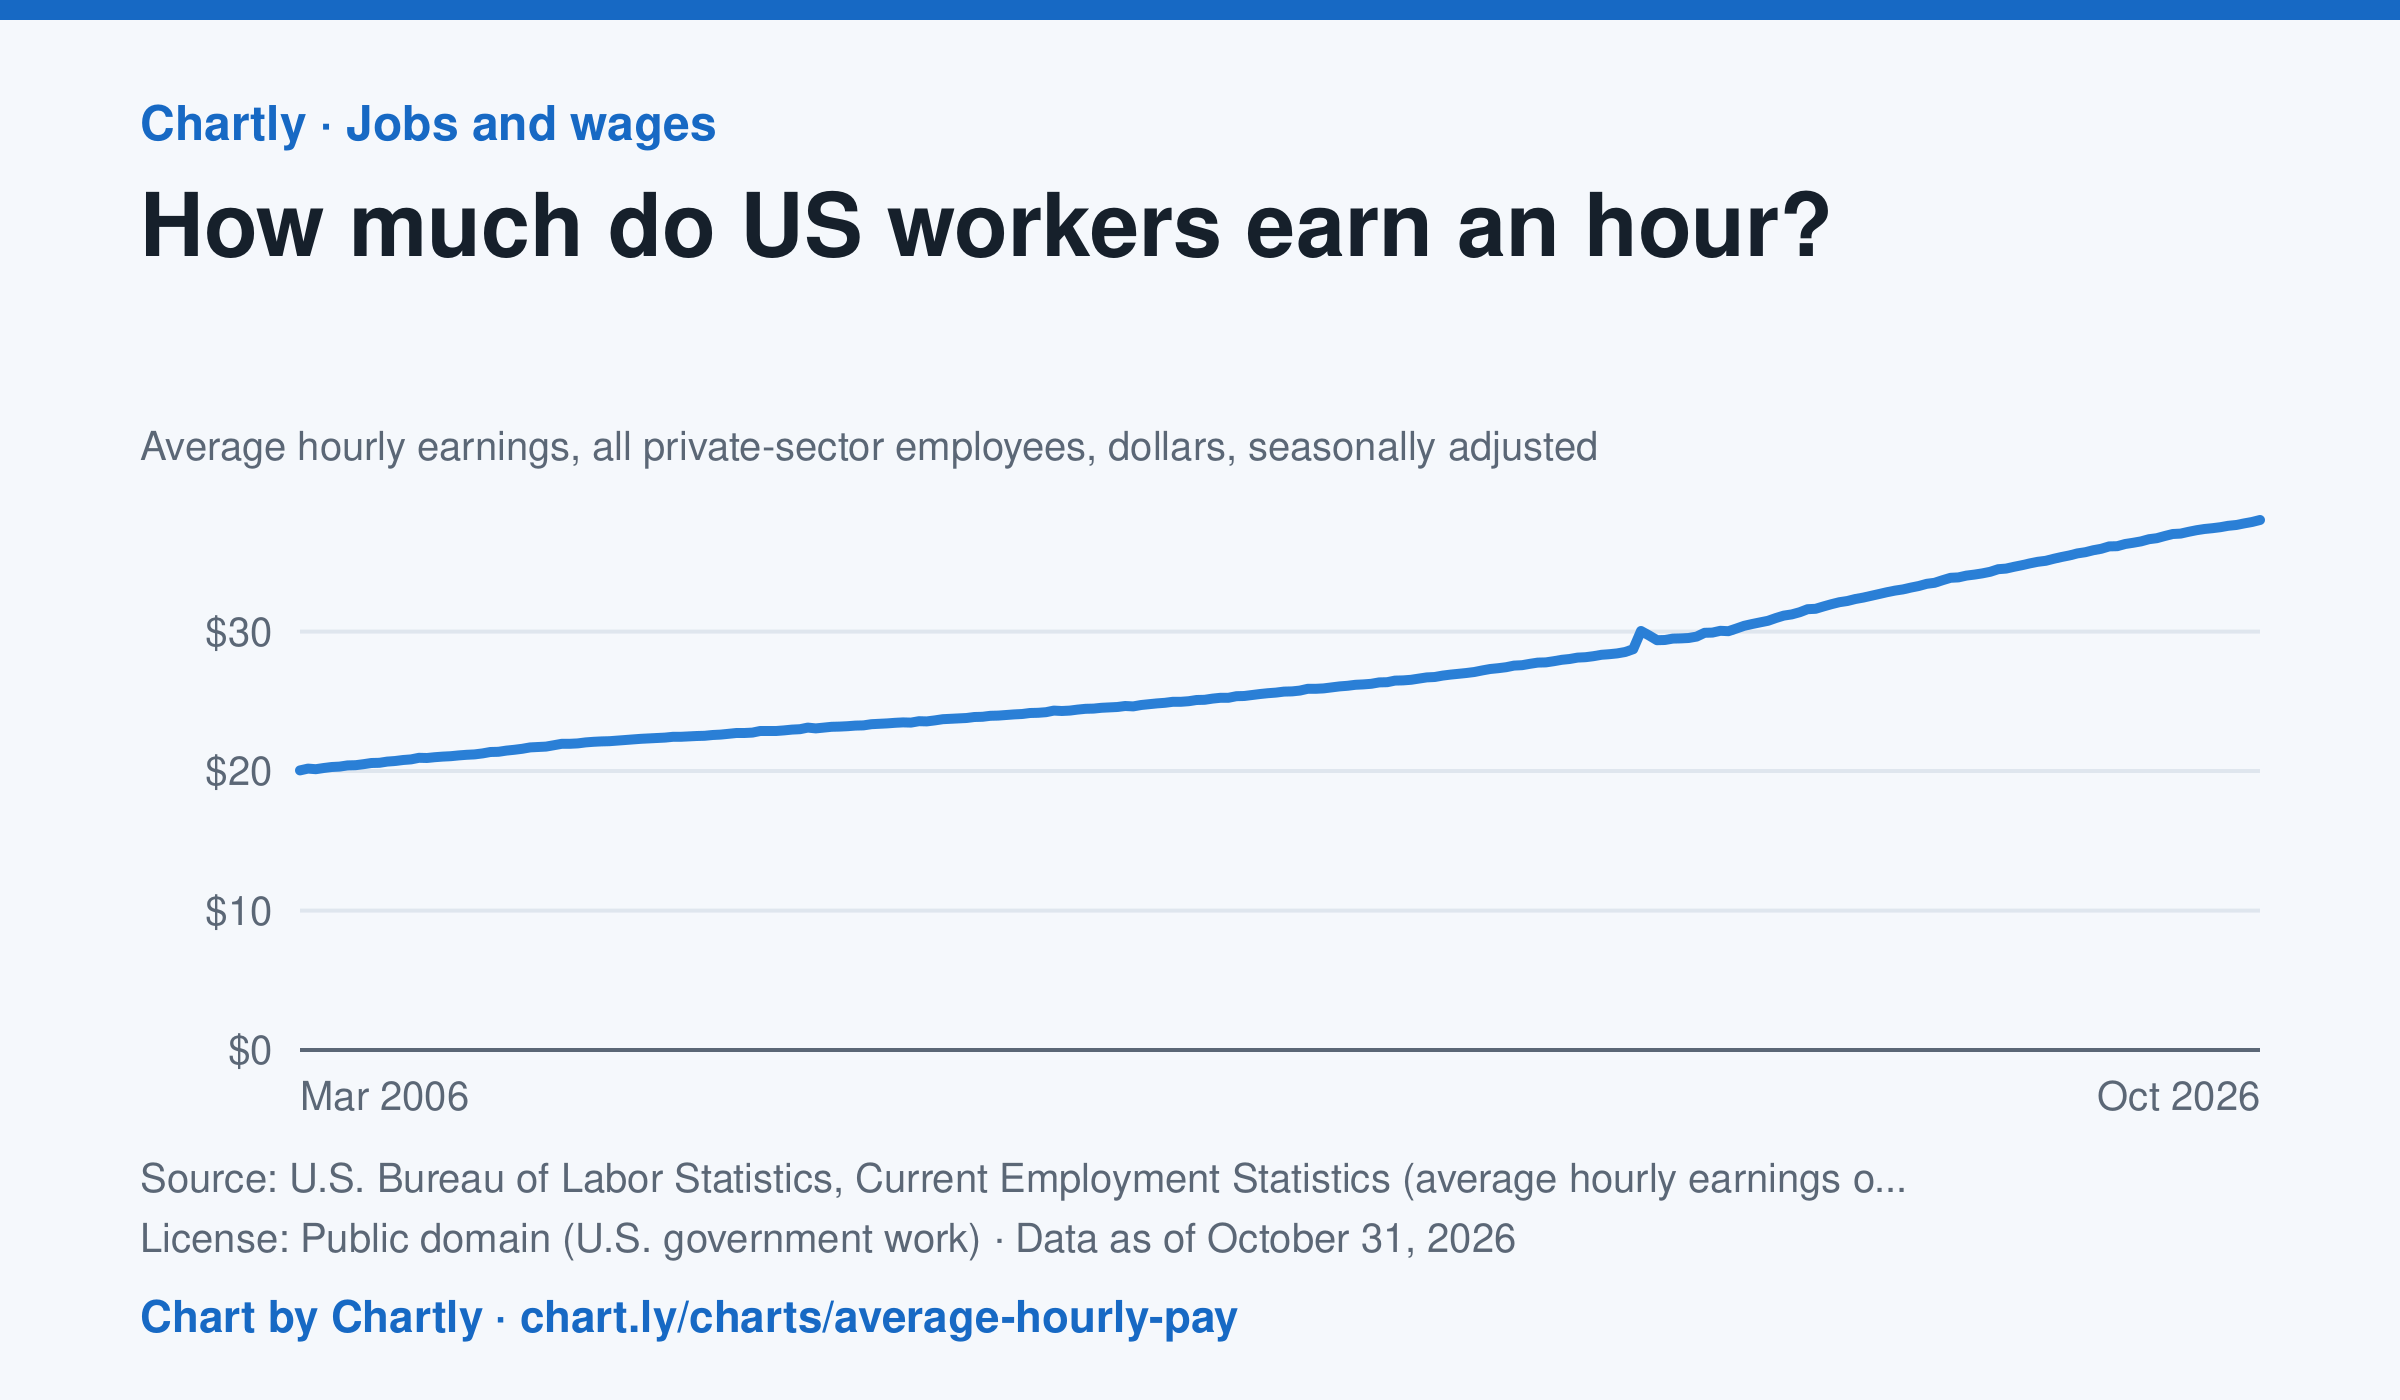
Private-sector employees earned an average of $38.00 an hour in October 2026, 3.1% more than in October 2025 and 1.9 times the $20.04 of March 2006, when the series begins. That is in dollars of the day, not adjusted for inflation; the monthly jobs report compares it with prices. The average rose sharply in spring 2020 because the pandemic put mostly lower-paid people out of work, not because pay jumped.
Source: U.S. Bureau of Labor Statistics, Current Employment Statistics (average hourly earnings of all employees, total private) (Public domain (U.S. government work)) · Data as of Oct 31, 2026
How to read this chart
Each point is the average hourly pay of private-sector employees in one month, in dollars, before taxes. It is not adjusted for inflation, so a rise in pay doesn't always mean workers can buy more. Hover or tap a point to read its month and value.
Questions
- How much did average hourly pay change from the first month on the chart to the newest?
- Find a month when pay jumped more than usual. Can you think of a reason that might happen, other than everyone getting a raise?
- If prices rose faster than pay over a year, were workers better or worse off? How could you check that with another chart?
Chart and numbers: chart.ly/charts/average-hourly-pay · More free charts at chart.ly
Chart 2 of 3 · Inflation
How much does a dozen eggs cost in the US?
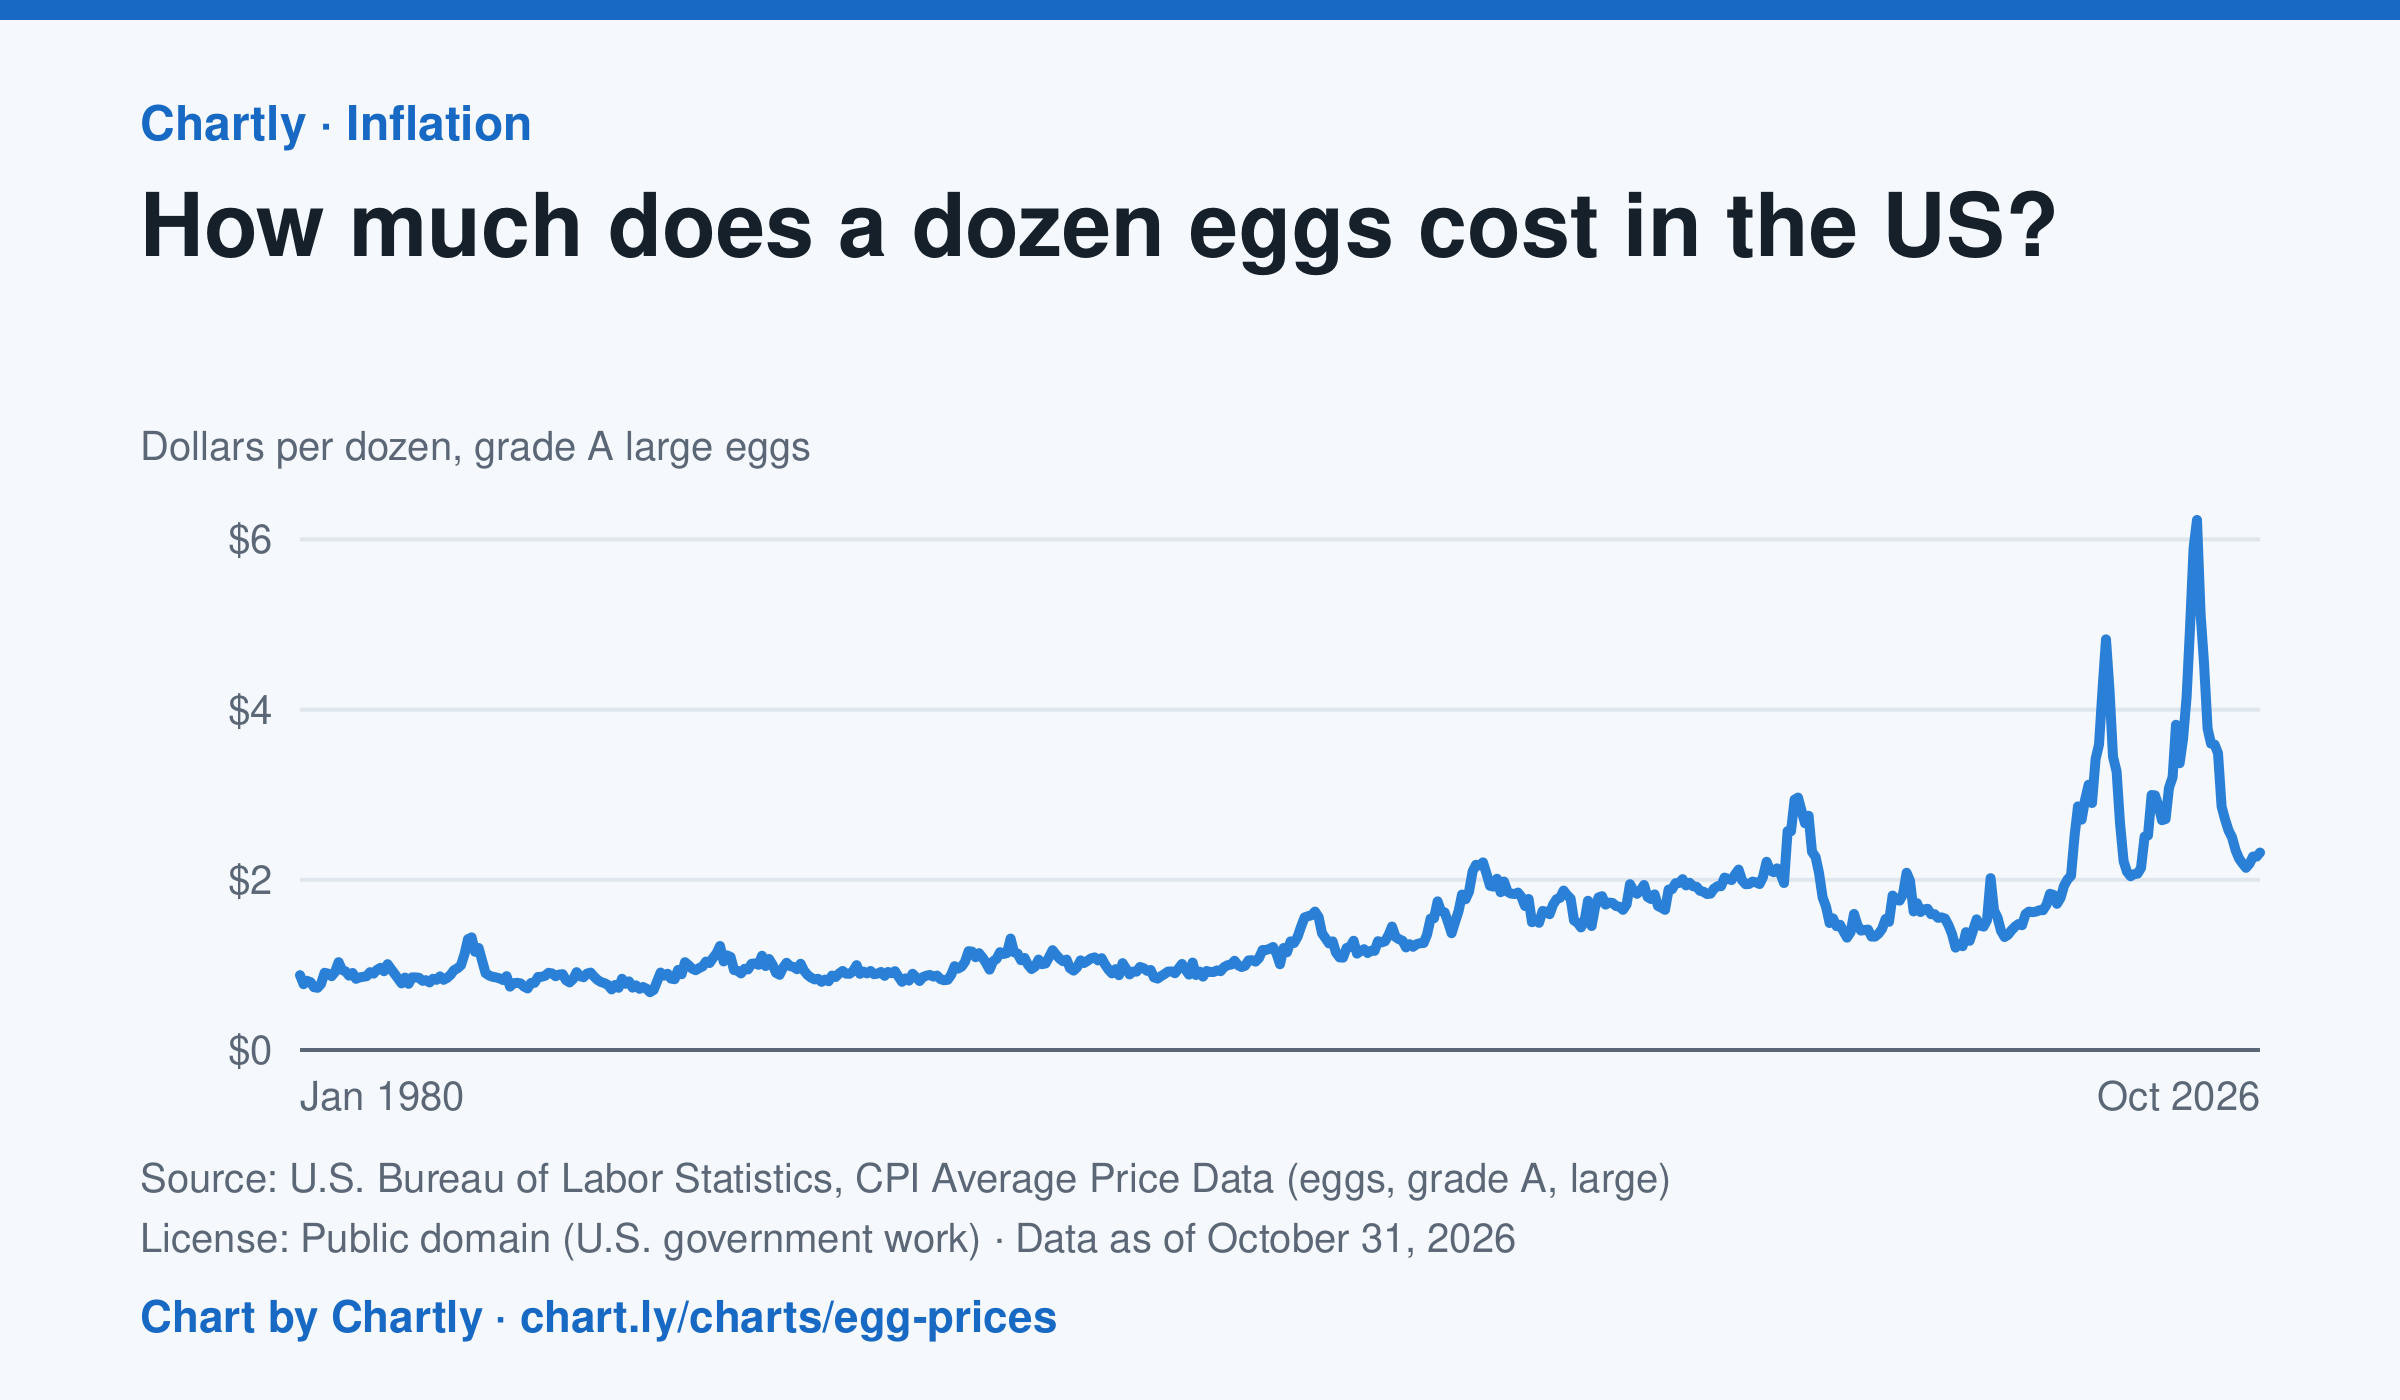
A dozen grade A large eggs averaged $2.32 in October 2026. The record so far is $6.23 in March 2025; prices spiked in 2023 and 2025 when bird flu cut the number of laying hens. Prices are BLS averages across US cities since 1980, when this series begins, in dollars of the day, not adjusted for inflation. October 2025 is missing because a lapse in federal funding stopped data collection.
Source: U.S. Bureau of Labor Statistics, CPI Average Price Data (eggs, grade A, large) (Public domain (U.S. government work)) · Data as of Oct 31, 2026
How to read this chart
Each point is the average price of a dozen grade A large eggs in U.S. cities in one month, in dollars. The axis starts at zero, so the height of the line shows the true price. Spikes often come when bird flu forces farms to lose laying hens, which cuts the supply of eggs.
Questions
- What was the highest price on the chart, and how many times more is it than the lowest?
- Showing your work, by what percent did the price change from the first month on the chart to the newest?
- When fewer hens are laying eggs but people want just as many, what happens to the price, and why?
Chart and numbers: chart.ly/charts/egg-prices · More free charts at chart.ly
Chart 3 of 3 · World
How long do people around the world live, and how has that changed since 1960?
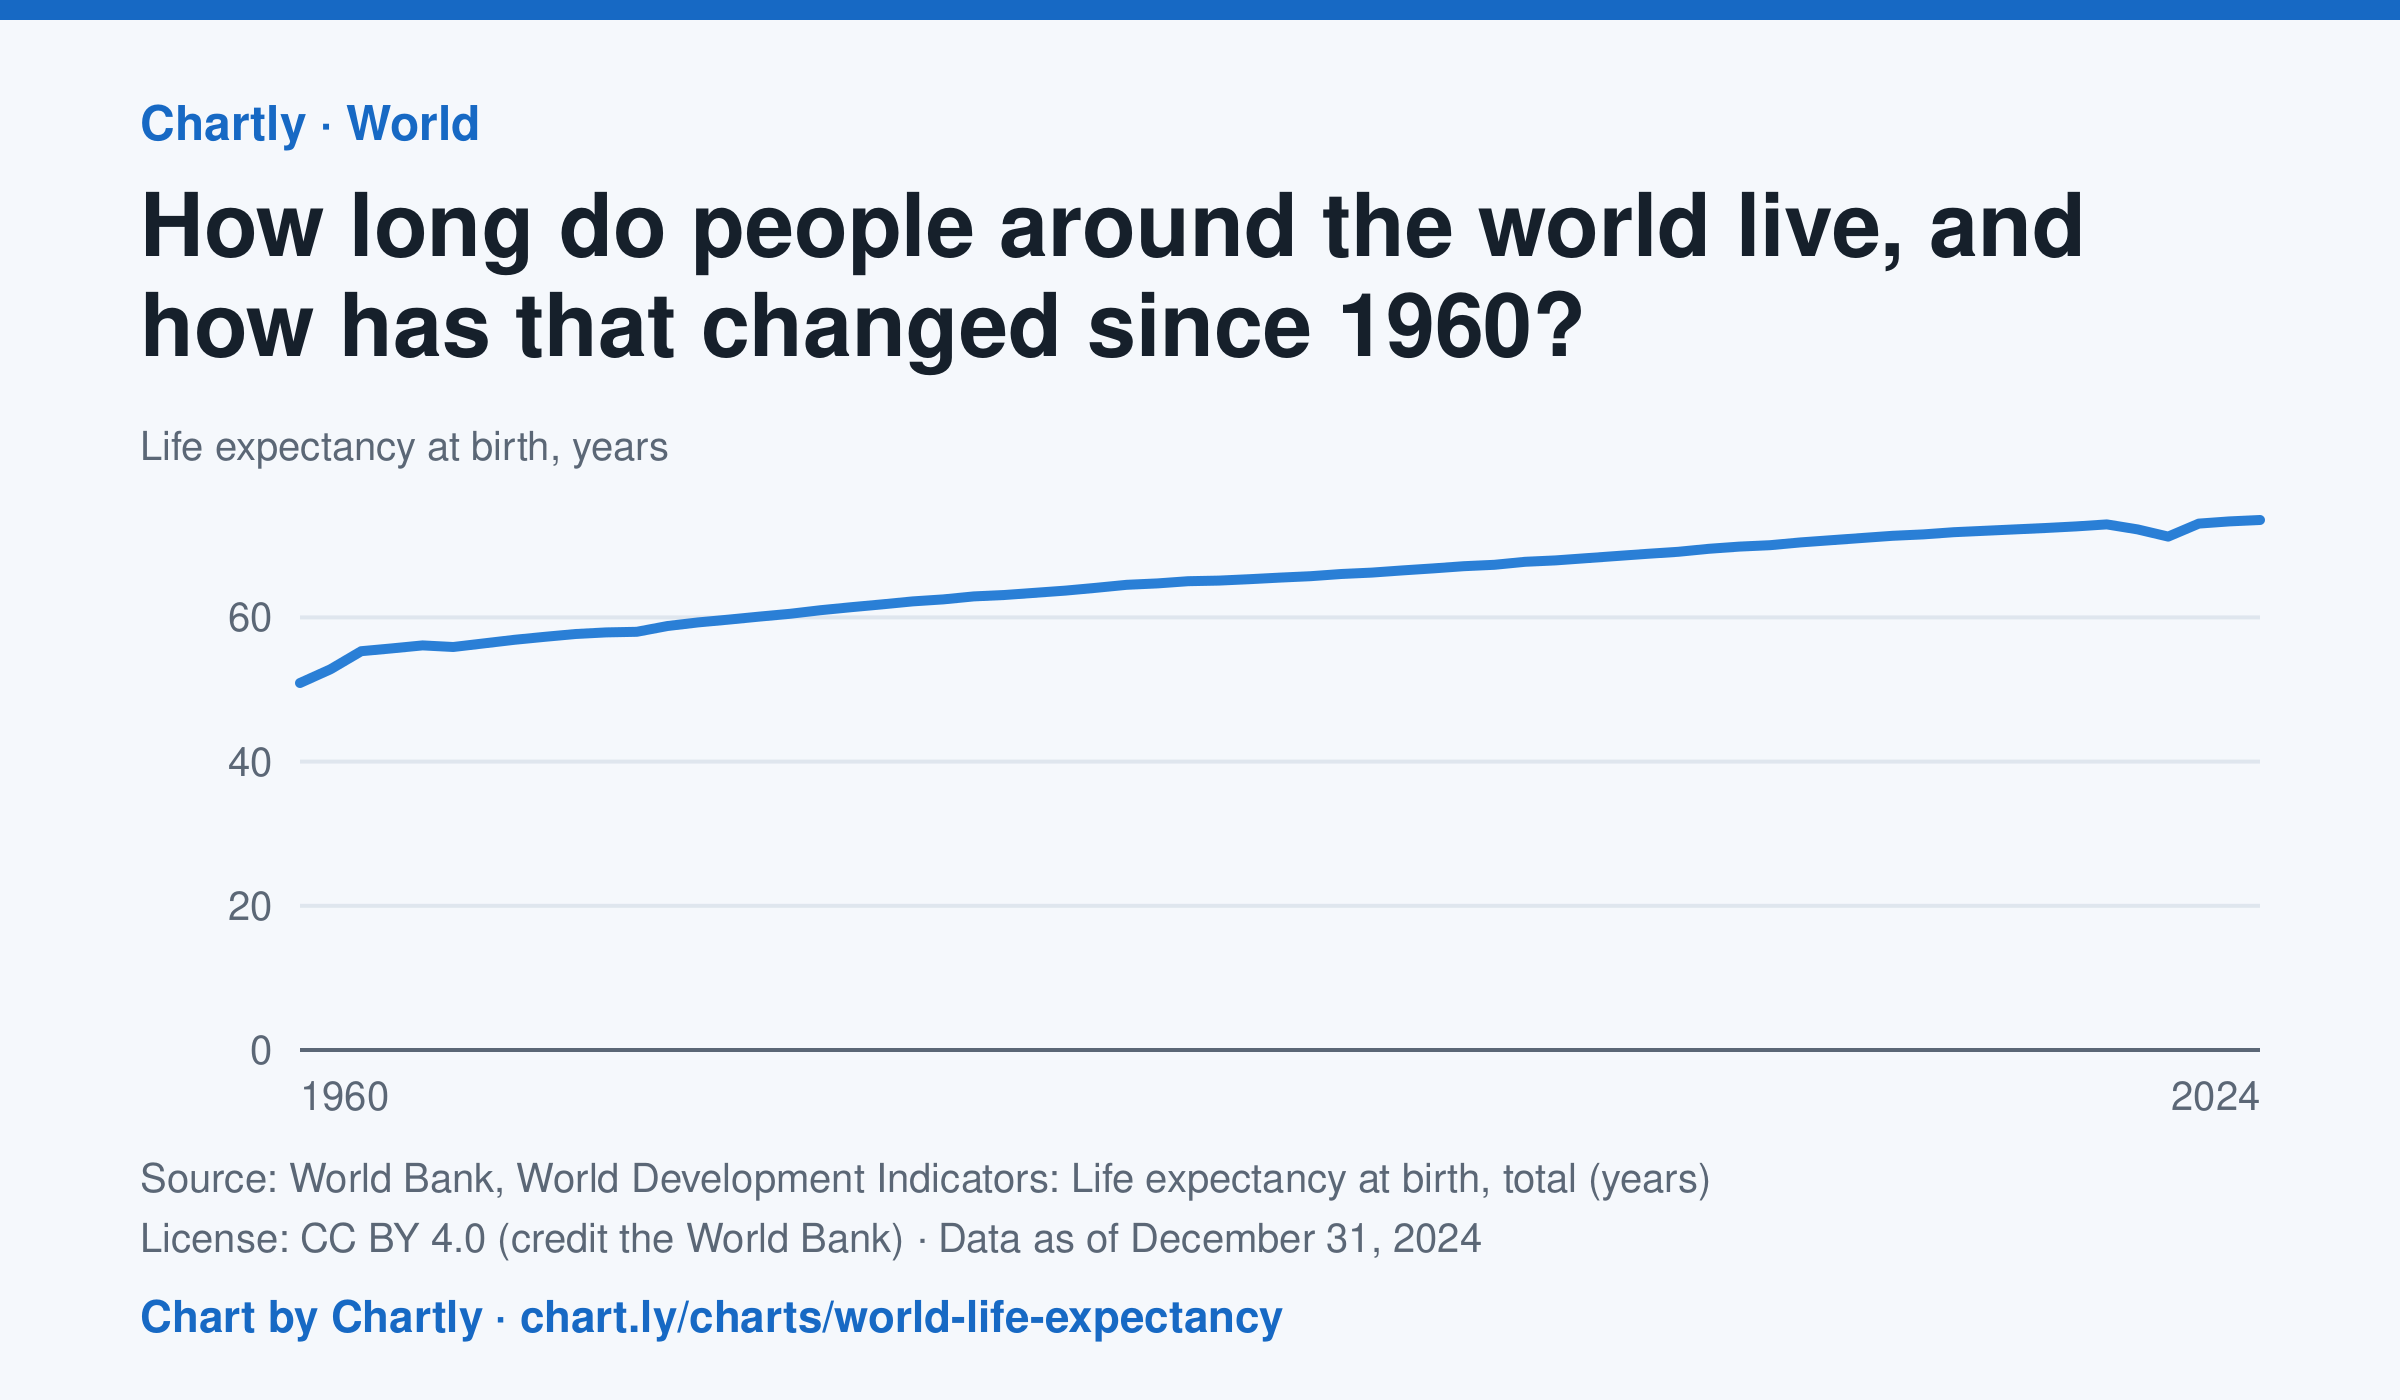
A baby born in 2024 could expect to live 73.5 years on average across the world, up from 50.9 in 1960. The very low early-1960s figures include the famine in China. Life expectancy fell to 71.2 years in 2021, during the COVID-19 pandemic, then recovered. These are United Nations estimates.
Source: World Bank, World Development Indicators: Life expectancy at birth, total (years) (CC BY 4.0 (credit the World Bank)) · Data as of Dec 31, 2024
How to read this chart
Each point is how long a baby born that year could expect to live, on average, across the whole world, if death rates stayed as they were. Because it averages every country, it rises when poorer countries cut deaths of babies and young children. The World Bank publishes the numbers.
Questions
- How many years did world life expectancy rise between the first year on the chart and the newest?
- Find a year when the line dipped. What happened in the world then?
- Compare this chart with the U.S. life expectancy lesson. Why might the world's average have risen faster?
Chart and numbers: chart.ly/charts/world-life-expectancy · More free charts at chart.ly